. 2017 Jul 3;7(1):4543.
doi: 10.1038/s41598-017-04876-2.

Lack of evidence for involvement of TonEBP and hyperosmotic stimulus in induction of autophagy in the nucleus pulposus

Affiliations

Lack of evidence for involvement of TonEBP and hyperosmotic stimulus in induction of autophagy in the nucleus pulposus

Chao Liu et al. Sci Rep. .

Abstract

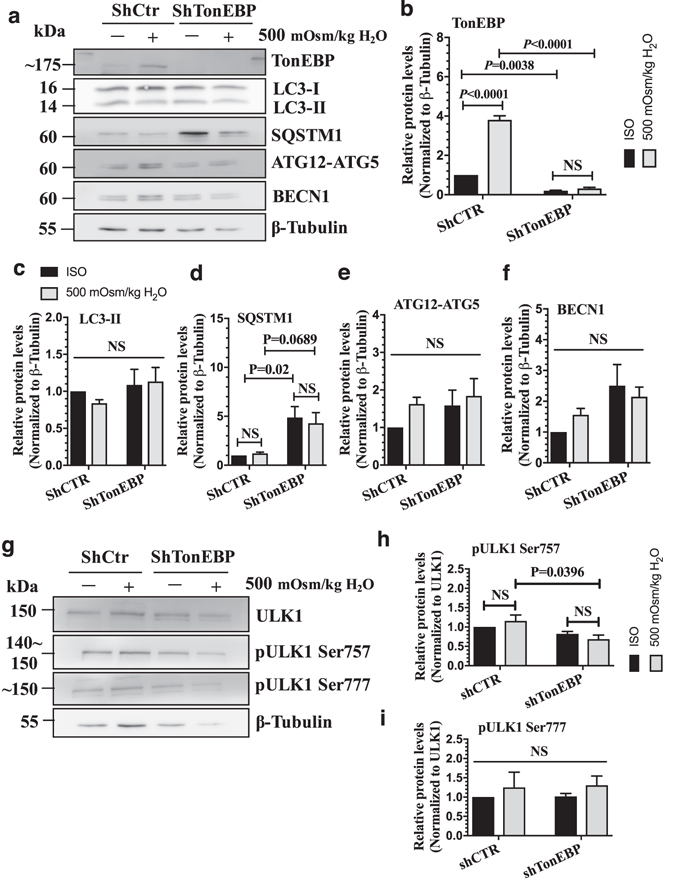
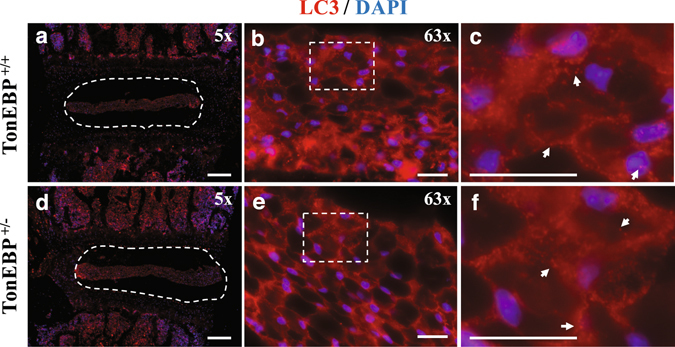
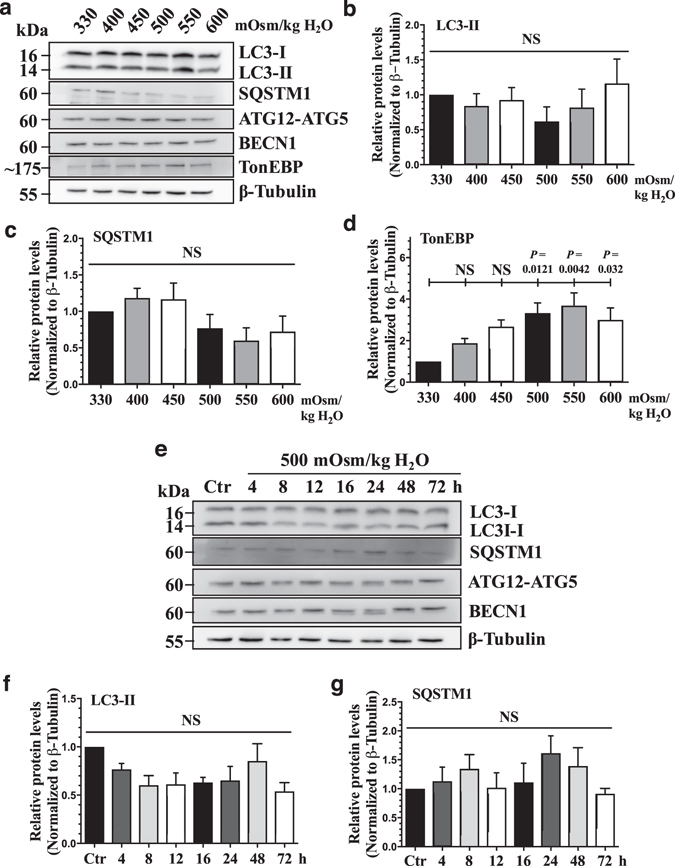
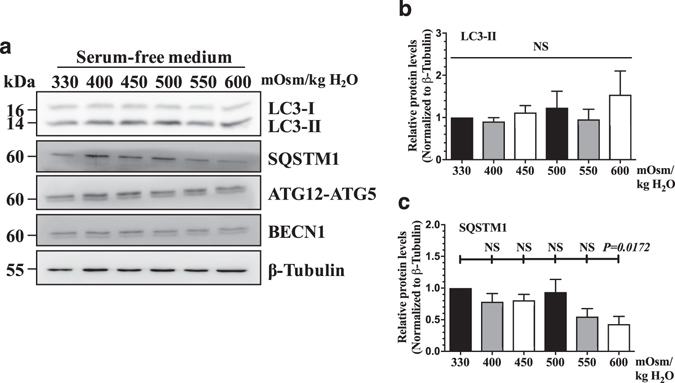
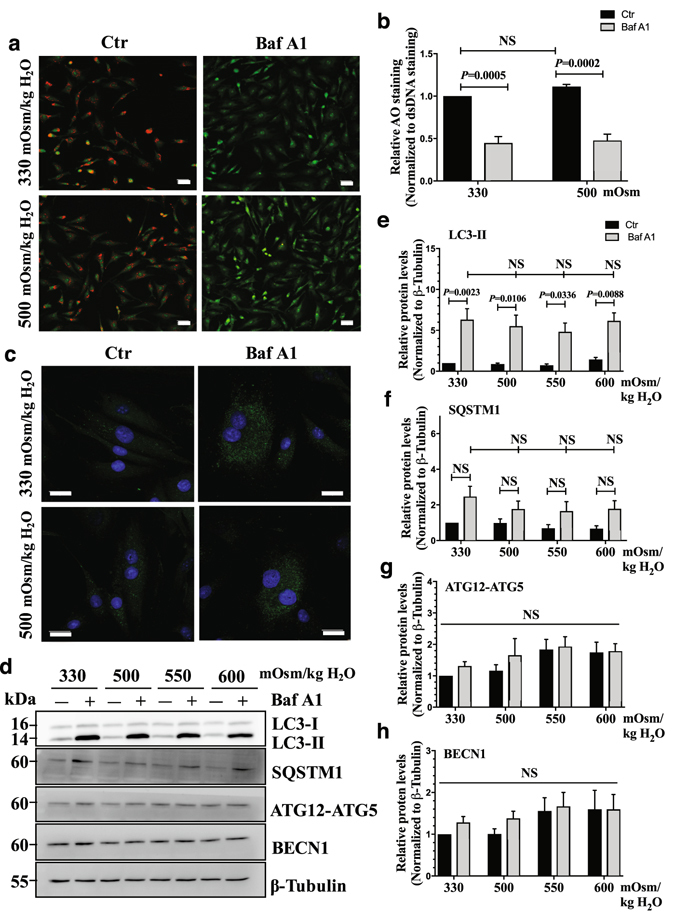
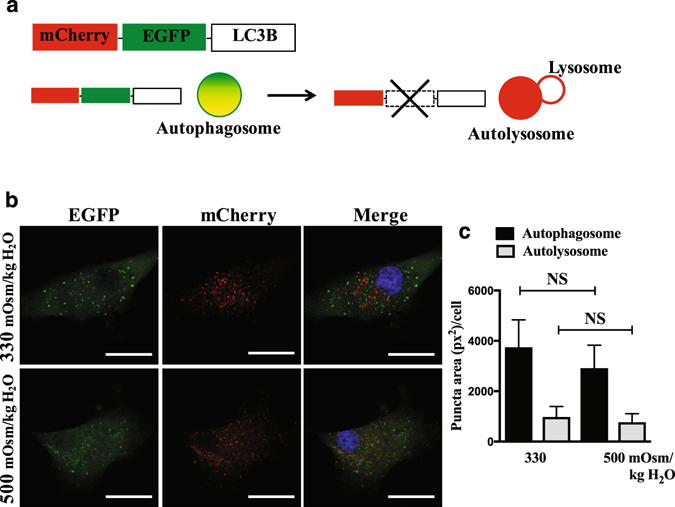
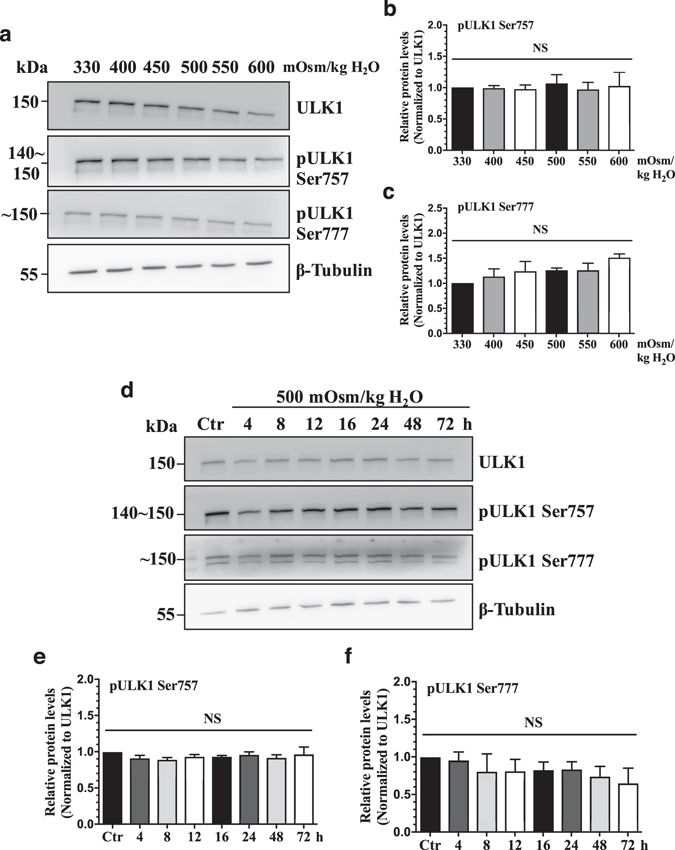
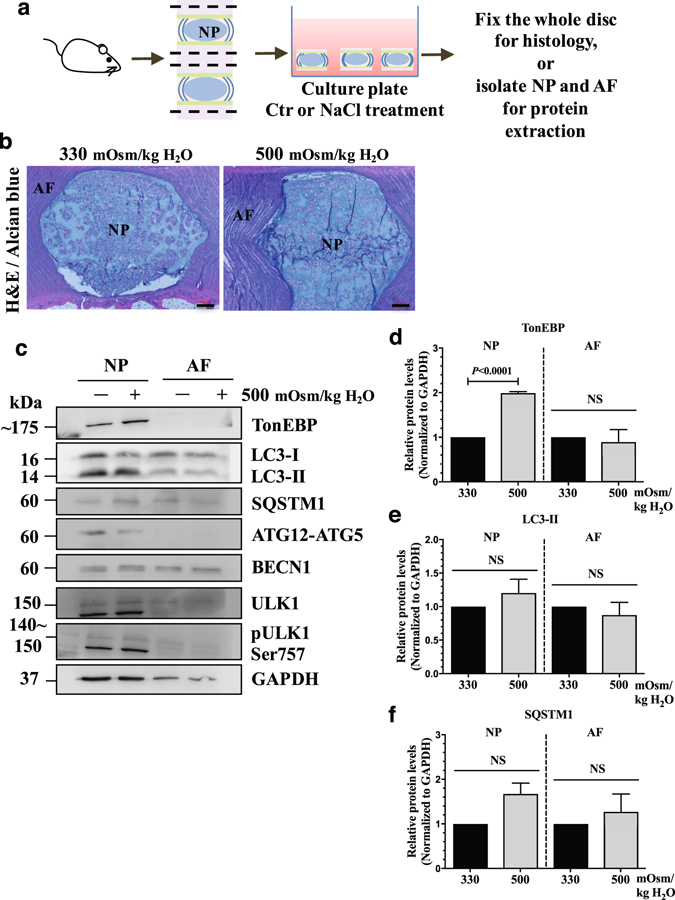
Nucleus pulposus (NP) cells reside in a physiologically hyperosmotic environment within the intervertebral disc. TonEBP/NFAT5 is an osmo-sensitive transcription factor that controls expression of genes critical for cell survival under hyperosmotic conditions. A recent report on NP and studies of other cell types have shown that hyperosmolarity triggers autophagy. However, little is known whether such autophagy induction occurs through TonEBP. The goal of this study was to investigate the role of TonEBP in hyperosmolarity-dependent autophagy in NP. Loss-of-function studies showed that autophagy in NP cells was not TonEBP-dependent; hyperosmolarity did not upregulate autophagy as previously reported. NP tissue of haploinsufficient TonEBP mice showed normal pattern of LC3 staining. NP cells did not increase LC3-II or LC3-positive puncta under hyperosmotic conditions. Bafilomycin-A1 treatment and tandem mCherry-EGFP-LC3B reporter transfection demonstrated that the autophagic flux was unaffected by hyperosmolarity. Even under serum-free conditions, NP cells did not induce autophagy with increasing osmolarity. Hyperosmolarity did not change the phosphorylation of ULK1 by mTOR and AMPK. An ex vivo disc organ culture study supported that extracellular hyperosmolarity plays no role in promoting autophagy in the NP. We conclude that hyperosmolarity does not play a role in autophagy induction in NP cells.


Conflict of interest statement

The authors declare that they have no competing interests.

Figures

Figure 1
Figure 1
TonEBP does not control autophagy in NP cells. (a) Western blot analysis of NP cells transduced with a lentivirus expressing either control shRNA or shTonEBP plasmid showed that TonEBP silencing did not affect the levels of LC3-II, ATG12-ATG5, and BECN1. The levels of SQSTM1 increased with TonEBP silencing. (bf) Densitometric analyses of multiple Western blots shown in (a). (g) Western blot analysis of ULK1 activation status showed that the levels of pULK1 Ser757 was slightly lower, while that of pULK1 Ser777 remained unaffected after TonEBP knockdown under hyperosmotic conditions. (h,i) Densitometric analyses of multiple western blots shown in (g). Bars represent mean ± SEM (n = 4). Two-way ANOVA with Tukey’s multiple comparisons test was used to determine statistical significance. NS, non-significant. Western blot images were cropped and acquired under same experimental conditions. See Supplementary Fig. S1 for examples of uncropped images.
Figure 2
Figure 2
TonEBP haploinsufficient mice do not show altered autophagy in NP. LC3 immunofluorescence staining of intervertebral discs from 4-month-old TonEBP+/+ (ac) and haploinsufficient TonEBP+/− (df) mice demonstrated similar pattern and distribution of LC3 positive autophagosomes. (a,d) White dotted line demarks the NP tissue compartment. (c,f) Magnified images of dotted inserts from B and E respectively. White arrows indicate LC3-positive autophagosomes. Scale bar: 200 μm for (a) and (d); 20 μm for (b), (c), (e), and (f).
Figure 3
Figure 3
Hyperosmolarity does not upregulate the levels of canonical autophagic markers. (a) Western blot analysis of NP cells cultured under increasing osmolarity (330–600 mOsm/kg H2O) showed that the levels of LC3-II, SQSTM1, ATG12-ATG5, and BECN1 did not change by hyperosmolarity. However, TonEBP expression increased under hyperosmotic condition. (bd) Densitometric analyses of multiple Western blots represented by (a) confirmed significant induction of TonEBP, while LC3-II and SQSTM1 levels remained unaltered (n = 5). (e) Western blot analysis of NP cells cultured under hyperosmotic condition for increasing lengths of time demonstrated that LC3-II, SQSTM1, ATG12-ATG5, and BECN1 levels were unaffected by hyperosmolarity up till 72 h. (fi) Densitometric analyses of multiple Western blots shown in (e) (n = 3). Bars represent mean ± SEM. One-way ANOVA with Sidak’s multiple comparisons test was used to determine statistical significance. NS, non-significant. Western blot images were cropped and acquired under same experimental conditions. See Supplementary Fig. S1 for examples of uncropped images.
Figure 4
Figure 4
Serum withdrawal does not modulate the effect of hyperosmolarity on autophagy in NP cells. (a) Western blot analysis of NP cells cultured in serum-free media with increasing osmolarity (330–600 mOsm/kg H2O) showed that the levels of autophagic markers including LC3-II, ATG12-ATG5, and BECN1 were unaltered. SQSTM1 levels did not change with increasing osmolarity except for a small decrease at 600 mOsm/kg H2O. (b,c) Densitometric analyses of multiple Western blots. Bars represent mean ± SEM (n = 5). One-way ANOVA with Sidak’s multiple comparisons test was used to determine statistical significance. NS, non-significant. Western blot images were cropped and acquired under same experimental conditions. See Supplementary Fig. S1 for examples of uncropped images.
Figure 5
Figure 5
Hyperosmolarity does not influence autophagic flux in NP cells. (a) Acridine orange staining of NP cells cultured under iso- (330 mOsm/kg H2O, top row) or hyperosmotic (500 mOsm/kg H2O, bottom row) condition, treated with (right) or without (left) bafilomycin A1. Hyperosmotic stimulus alone showed no change in number of acidic organelles. Bafilomycin A1 significantly reduced the acridine orange staining irrespective of osmolarity. Scale bar, 35 μm. (b) Quantification of acridine orange staining confirmed that hyperosmolarity had no effect on the number of acidic organelles. (c) LC3 immunofluorescence staining of NP cells cultured under hyperosmolarity with or without bafilomycin A1 treatment. Hyperosmotic stimulus did not upregulate LC3-positive autophagosomes. Scale bar, 20 μm. (d) Western blot analysis of NP cells cultured under increasing osmolarity (330–600 mOsm/kg H2O) with or without bafilomycin A1 treatment. The accumulation of LC3-II with bafilomycin A1 treatment was similar under iso- and hyperosmotic conditions. SQSTM1 also showed a trend of accumulation with bafilomycin A1 treatment under all conditions. The levels of ATG12-ATG5 and BECN1 remained unaltered between the experimental groups. (eh) Densitometric analyses of multiple Western blots shown in (d). Bars represent mean ± SEM (n = 5). Two-way ANOVA with Tukey’s multiple comparisons test was used to determine statistical significance. NS, non-significant. BafA1, bafilomycin A1. Western blot images were cropped and acquired under same experimental conditions. See Supplementary Fig. S1 for examples of uncropped images.
Figure 6
Figure 6
Number of autophagosomes and autolysosomes do not change by hyperosmolarity in NP cells. (a) Schematic diagram of tandem mCherry-EGFP-LC3B plasmid. Autophagosomes in the NP cells expressing mCherry-EGFP-LC3B are tagged with both fluorophores and therefore appear yellow/green. When these autophagosomes fuse with lysosomes, acid labile EGFP signal is lost, leaving mCherry signal (red), which measures autophagic flux. (b) NP cells transduced with retrovirus expressing a tandem mCherry-EGFP-LC3B construct cultured under either iso- or hyperosmotic condition showed that the numbers of autophagosome (yellow/green puncta) and autolysosome (red puncta) did not change by hyperosmolarity. Scale bar: 25 μm. (c) Quantification of puncta area per cell using Colocalization Plugin of ImageJ software confirmed the insensitivity of autophaigc flux to hyperosmotic stimulus. At least 27 cells per group imaged at 126x magnification from 10 random microscopic fields were used for quantification analysis. Bars represent mean ± SEM (n = 3). Student t test was used to determine statistical significance. NS, non-significant.
Figure 7
Figure 7
Hyperosmolarity does not activate autophagy through MTOR-AMPK-ULK1 axis in NP cells. (a) Western blot analysis of NP cells treated with increasing osmolarity (330–600 mOsm/kg H2O) showed that the levels of pULK1 Ser757 and pULK1 Ser777 were not affected by hyperosmolarity. (b, c) Densitometric analyses of multiple Western blots represented in (a) confirmed lack of effect on ULK1 phosphorylaiton at Ser757 and Ser777 by hyperosmolarity. (d) Western blot analysis of NP cells cultured in hyperosmotic media for increasing lengths of time demonstrated that phosphorylation of ULK1 at both Ser757 and Ser777 by MTOR and AMPK respectively was not affected by hyperosmolarity till 72 h. (E, F) Denstiometric analyses of multiple Western blots represented in (d). Bars represent mean ± SEM (n = 3). One-way ANOVA with Sidak’s multiple comparisons test was used to determine statistical significance. NS, non-significant. Western blot images were cropped and acquired under same experimental conditions. See Supplementary Fig. S1 for examples of uncropped images.
Figure 8
Figure 8
NP cells do not induce autophagy in response to hyperosmotic stimulus in an ex vivo disc organ culture model. (a) A schematic depicting ex vivo rat intervertebral disc organ culture model. (b) H&E and alcian blue staining of discs cultured under iso- (330 mOsm/kg H2O) or hyperosmotic (500 mOsm/kg H2O) conditions showing that NP maintained its structure and cellular morphology. Scale bar: 100 μm. (c) Western blot analysis of tissue proteins from NP or AF (annulus fibrosus) compartments of the organ culture discs. The level of TonEBP increased with hyperosmotic stimulus only in the NP. However, the levels of LC3-II, SQSTM1, ATG12-ATG5, BECN1, as well as pULK1 Ser757 did not change with hyperosmolarity in both NP and AF. (df) Densitometric analyses of multiple Western blots represented in (c). Bars represent mean ± SEM (n = 3; For each independent experiment, one motion segment per group was used for histology and 6 motion segments per group were used for tissue protein Western blot). Student t test was used to determine statistical significance. NS, non-significant. Western blot images were cropped and acquired under same experimental conditions. See Supplementary Fig. S1 for examples of uncropped images.

Similar articles

Cited by

References

    1. Johnson ZI, Shapiro IM, Risbud MV. Extracellular osmolarity regulates matrix homeostasis in the intervertebral disc and articular cartilage: Evolving role of TonEBP. Matrix Biol. 2014;40:10–16. doi: 10.1016/j.matbio.2014.08.014. - DOI - PMC - PubMed
    1. Urban JP, Maroudas A. Swelling of the intervertebral disc in vitro. Connect. Tissue Res. 1981;9:1–10. doi: 10.3109/03008208109160234. - DOI - PubMed
    1. Ishihara H, Warensjo K, Roberts S, Urban JP. Proteoglycan synthesis in the intervertebral disk nucleus: the role of extracellular osmolality. Am. J. Physiol. 1997;272:C1499–506. - PubMed
    1. van Dijk B, Potier E, Ito K. Culturing bovine nucleus pulposus explants by balancing medium osmolarity. Tissue Eng. Part C. Methods. 2011;17:1089–96. doi: 10.1089/ten.tec.2011.0215. - DOI - PubMed
    1. Lee S, Kwon M, Woo S. TonEBP transcriptional activator in the cellular response to increased osmolality. Pflugers Arch. Eur. J. Physiol. 2002;444:579–585. doi: 10.1007/s00424-002-0849-2. - DOI - PubMed

Publication types