. 2017 Jun 15:8:1040.
doi: 10.3389/fpls.2017.01040. eCollection 2017.

Identification of Novel Associations of Candidate Genes with Resistance to Late Blight in Solanum tuberosum Group Phureja

Affiliations

Identification of Novel Associations of Candidate Genes with Resistance to Late Blight in Solanum tuberosum Group Phureja

María F Álvarez et al. Front Plant Sci. .

Abstract

The genetic basis of quantitative disease resistance has been studied in crops for several decades as an alternative to R gene mediated resistance. The most important disease in the potato crop is late blight, caused by the oomycete Phytophthora infestans. Quantitative disease resistance (QDR), as any other quantitative trait in plants, can be genetically mapped to understand the genetic architecture. Association mapping using DNA-based markers has been implemented in many crops to dissect quantitative traits. We used an association mapping approach with candidate genes to identify the first genes associated with quantitative resistance to late blight in Solanum tuberosum Group Phureja. Twenty-nine candidate genes were selected from a set of genes that were differentially expressed during the resistance response to late blight in tetraploid European potato cultivars. The 29 genes were amplified and sequenced in 104 accessions of S. tuberosum Group Phureja from Latin America. We identified 238 SNPs in the selected genes and tested them for association with resistance to late blight. The phenotypic data were obtained under field conditions by determining the area under disease progress curve (AUDPC) in two seasons and in two locations. Two genes were associated with QDR to late blight, a potato homolog of thylakoid lumen 15 kDa protein (StTL15A) and a stem 28 kDa glycoprotein (StGP28). Key message: A first association mapping experiment was conducted in Solanum tuberosum Group Phureja germplasm, which identified among 29 candidates two genes associated with quantitative resistance to late blight.

Keywords: SNP; association mapping; candidate genes; late blight; quantitative disease resistance.


Figures

FIGURE 1
FIGURE 1
Evaluation of quantitative resistance to late blight in four environments and 104 accessions of S. tuberosum Group Phureja. The histogram is based on the adjusted means for area under disease progress curve (AUDPC) values. Shapiro–Wilk normality test, p-value = 0.003263.
FIGURE 2
FIGURE 2
Correlation between areas under disease progress curve (AUDPC) for late blight disease in S. tuberosum Group Phureja accessions from the CCC evaluated in four environments. (A) Heat map of the correlations between AUDPC values for the environments 1, 2, 3, and 4. The higher the correlation coefficient, the darker the red color. (B) The PCA (principal component analysis) for accessions and environment scores, in green, AUDPC values for the accessions and in blue the four environments.
FIGURE 3
FIGURE 3
Comparative Q-Q plots for –log10 p-values for five association models. Three GLM, general linear models: GLM without any other correction parameter, GLMQ (use population structure as parameter K = 2), GLMPC (use PCA as a parameter in the model) and two mixed linear models (MLM), MLMK use kinship as a parameter, MLMKPC, use kinship plus PCA The best fit was obtained with the GLM with PCA (GLMPC).
FIGURE 4
FIGURE 4
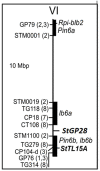
Physical map of potato chromosome VI. Positions of RFLP and SSR markers (see Supplementary Table 3 for details) linked with QTL for resistance to late blight according to the literature are shown on the left. Numbers in parenthesis code for the corresponding references: (1) Leonards-Schippers et al. (1994), (2) Collins et al. (1999), (3) Oberhagemann et al. (1999), (7) Simko et al. (2006), and (8) Brouwer et al. (2004). Black bars highlight the physical segments tagged by QTL linked markers. The approximate positions of potato QRL, Pin6a and Pin6b according to the SOL function map for pathogen resistance (http://www.gabipd.org/database/maps.shtml), of tomato QRL lb6a and lb6b (Brouwer et al., 2004) and the position of the Rpi-blb2 late blight resistance gene (NCBI accession DQ122125, van der Vossen et al., 2005) are shown on the right along with the positions of the candidate loci St GP28 and StTL15A.
FIGURE 5
FIGURE 5
Box plot for the distribution of AUDPC in the genotype classes AT and TT of SNP StSGP28G49101958 (locus PGSC0003DMG402016495 on chromosome VI) in S. tuberosum Group Phureja from the Working Collection. The y-axis shows AUDPC values and the x-axis the two genotype classes. The third genotype class AA was absent in the collection.
FIGURE 6
FIGURE 6
Box plot for the distribution of AUDPC in the genotype classes CC, TC, and TT of SNP StTL15A56859831 (locus PGSC0003DMG400034939 on chromosome VI) in S. tuberosum Group Phureja from the Working Collection. The y-axis shows AUDPC values and the x-axis the three genotype classes.

References

    1. Abdukarimov I. Y., Abdukarimov A. (2008). Application of association mapping to understanding the genetic diversity of plant germplasm resources. Int. J. Plant Genomics 2008 1–18. 10.1155/2008/574927 - DOI - PMC - PubMed
    1. Aghnoum R., Marcel T. C., Johrde A., Pecchioni N., Schweizer P., Niks R. E. (2009). Basal host resistance of barley to powdery mildew: connecting quantitative trait loci and candidate genes. Mol. Plant Microbe Interact. 23 91–102. 10.1094/MPMI-23-1-0091 - DOI - PubMed
    1. Álvarez M. F., Mosquera T., Blair M. W. (2015). The use of association genetics approaches in plant breeding. Plant Breed. Rev. 38 Chap. 2 17–67.
    1. Berdugo-Cely J., Valbuena R. I., Sánchez-Betancourt E., Barrero L. S., Yockteng R. (2017). Genetic diversity and association mapping in the Colombian Central Collection of Solanum tuberosum L. Andigenum group using SNPs markers. PLoS ONE 12:e0173039 10.1371/journal.pone.0173039 - DOI - PMC - PubMed
    1. Bormann C. A., Rickert A. M., Castillo R. A., Paal J., Lübeck J., Strahwald J., et al. (2004). Tagging quantitative trait loci for maturity-corrected late blight resistance in tetraploid potato with PCR-based candidate gene markers. Mol. Plant Microbe Interact. 17 1126–1138. 10.1094/MPMI.2004.17.10.1126 - DOI - PubMed

LinkOut - more resources