. 2017 Jun 26:10:166.
doi: 10.1186/s13068-017-0838-5. eCollection 2017.

A design-build-test cycle using modeling and experiments reveals interdependencies between upper glycolysis and xylose uptake in recombinant S. cerevisiae and improves predictive capabilities of large-scale kinetic models

Affiliations

A design-build-test cycle using modeling and experiments reveals interdependencies between upper glycolysis and xylose uptake in recombinant S. cerevisiae and improves predictive capabilities of large-scale kinetic models

Ljubisa Miskovic et al. Biotechnol Biofuels. .

Abstract

Background: Recent advancements in omics measurement technologies have led to an ever-increasing amount of available experimental data that necessitate systems-oriented methodologies for efficient and systematic integration of data into consistent large-scale kinetic models. These models can help us to uncover new insights into cellular physiology and also to assist in the rational design of bioreactor or fermentation processes. Optimization and Risk Analysis of Complex Living Entities (ORACLE) framework for the construction of large-scale kinetic models can be used as guidance for formulating alternative metabolic engineering strategies.

Results: We used ORACLE in a metabolic engineering problem: improvement of the xylose uptake rate during mixed glucose-xylose consumption in a recombinant Saccharomyces cerevisiae strain. Using the data from bioreactor fermentations, we characterized network flux and concentration profiles representing possible physiological states of the analyzed strain. We then identified enzymes that could lead to improved flux through xylose transporters (XTR). For some of the identified enzymes, including hexokinase (HXK), we could not deduce if their control over XTR was positive or negative. We thus performed a follow-up experiment, and we found out that HXK2 deletion improves xylose uptake rate. The data from the performed experiments were then used to prune the kinetic models, and the predictions of the pruned population of kinetic models were in agreement with the experimental data collected on the HXK2-deficient S. cerevisiae strain.

Conclusions: We present a design-build-test cycle composed of modeling efforts and experiments with a glucose-xylose co-utilizing recombinant S. cerevisiae and its HXK2-deficient mutant that allowed us to uncover interdependencies between upper glycolysis and xylose uptake pathway. Through this cycle, we also obtained kinetic models with improved prediction capabilities. The present study demonstrates the potential of integrated "modeling and experiments" systems biology approaches that can be applied for diverse applications ranging from biotechnology to drug discovery.

Keywords: Bioethanol; HXK2 deletion; Hexokinase; Large-scale kinetic models; Metabolic control analysis; S. cerevisiae; Xylose utilization.


Figures

Fig. 1
Fig. 1
Substrates and products time evolutions of glucose–xylose co-utilization obtained for the VTT C-10880 strain growing in a bioreactor under anaerobic conditions: glucose (blue squares), xylose (red diamonds), xylitol (green triangles), glycerol (cyan pluses), acetate (magenta crosses), and ethanol (orange asterisks)
Fig. 2
Fig. 2
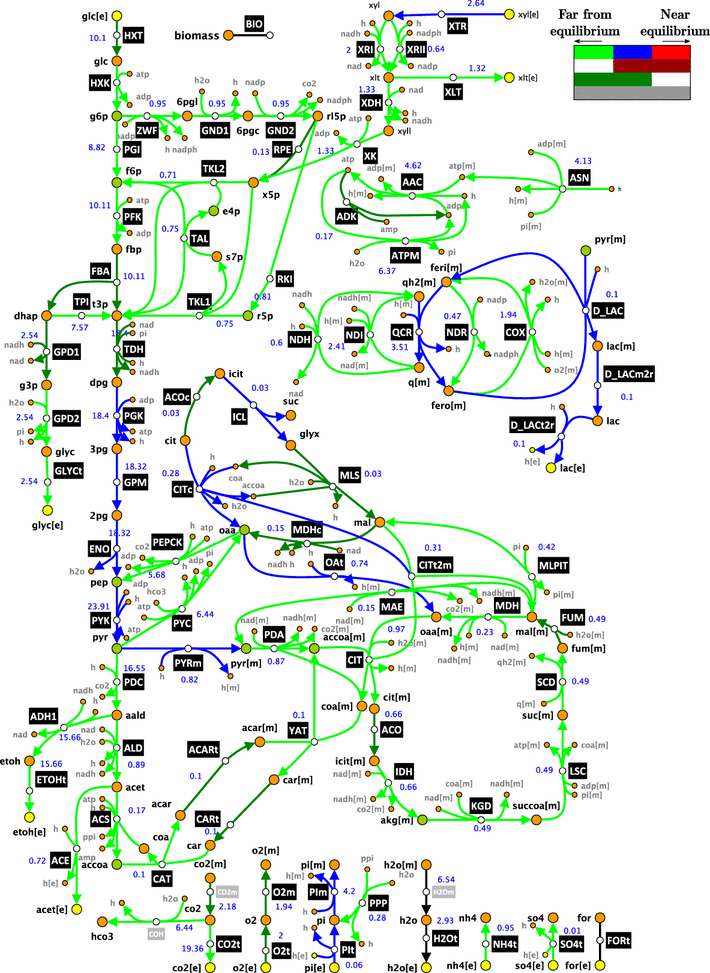
Schematic representation of the VTT C-10880 metabolism together with the displacement of the reactions from thermodynamic equilibrium. Reactions can operate (i) strictly far from thermodynamic equilibrium (light green), i.e., 0<Γ0.1; (ii) with the middle displacements (blue), i.e., 0.1Γ0.9; and (iii) strictly near equilibrium (light red), i.e., 0.9Γ<1. Reactions whose displacements belonged to more than one of these ranges were denoted with (iv) dark red, for 0<Γ0.9; (v) dark green, for 0.1Γ<1; and (vi) gray, for 0<Γ<1. The numerical values next to reactions denote flux values
Fig. 3
Fig. 3
Control coefficients of the xylose uptake during glucose–xylose co-utilization. The bars represent the mean values of the control coefficients through xylose transporters (XTR). The error bars denote the 1st and the 3rd quartile of the control coefficients with respect to their mean value, i.e., 50% of the samples closest to the mean value are within the error bars. The enzymes whose distributions of control coefficients were spread around zero, i.e., whose values did not allow us to predict with certainty the responses of metabolic network, are marked in gray
Fig. 4
Fig. 4
Control coefficients of the cytosolic ATP concentration during glucose–xylose co-utilization. The bars represent the mean values of the control coefficients, and the error bars denote the 1st and the 3rd quartile of the control coefficients with respect to their mean value, i.e., 50% of the samples closest to the mean value are within the error bars
Fig. 5
Fig. 5
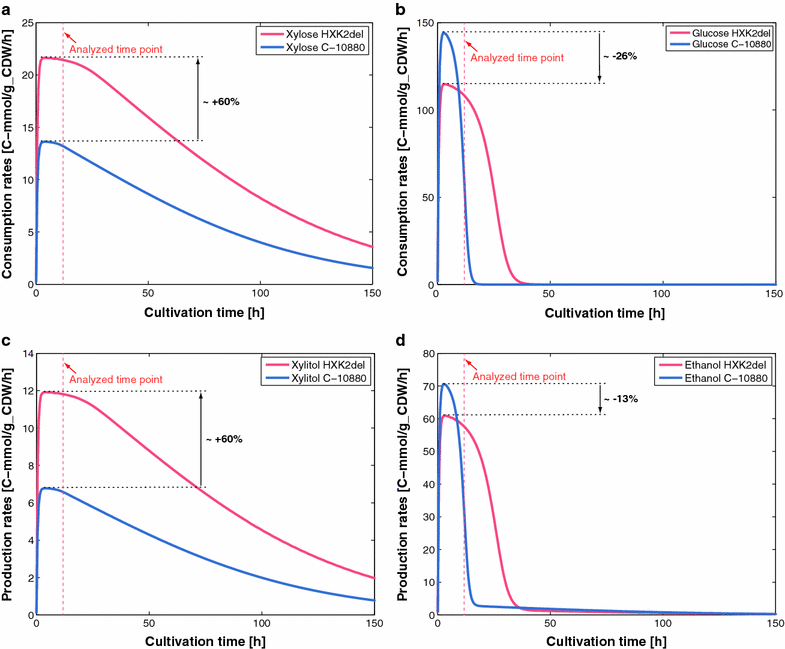
Fermentation profiles of the C-10880 strain (blue) and of the engineered HXK2-deficient strain (red): specific xylose consumption rates (a), specific glucose consumption rates (b), specific xylitol production rates (c), and specific ethanol production rates (d)
Fig. 6
Fig. 6
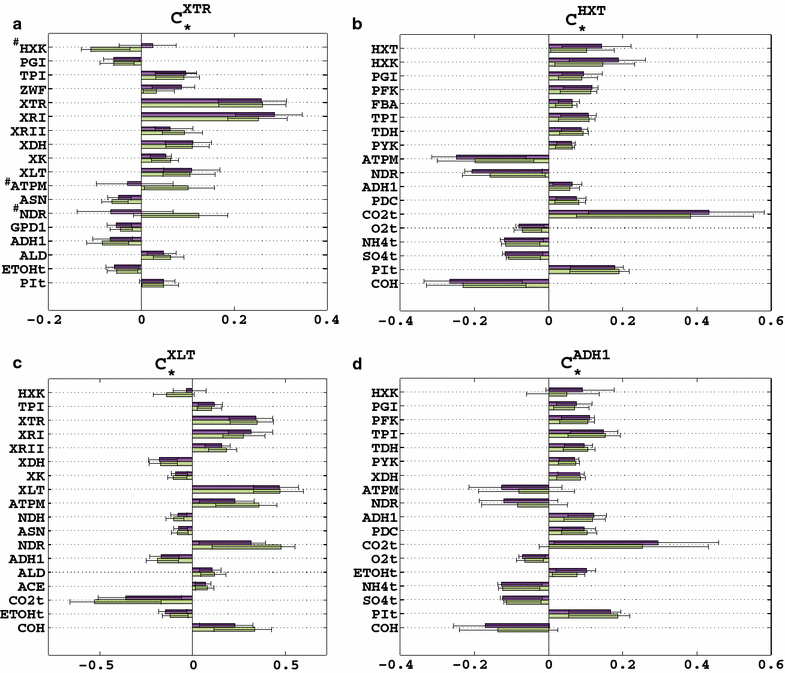
Control coefficients of the original (purple) and refined (green) models for xylose uptake rate, XTR (a), glucose uptake rate, HXT (b), xylitol production, XLT (c), and alcohol dehydrogenase, ADH1 (d). The bars represent the mean values of the control coefficients, and the error bars denote the 1st and the 3rd quartile of the control coefficients with respect to their mean value, i.e., 50% of the samples closest to the mean value are within the error bars. With # are denoted the enzymes whose distributions of control coefficients were spread around zero in the original (purple) models
Fig. 7
Fig. 7
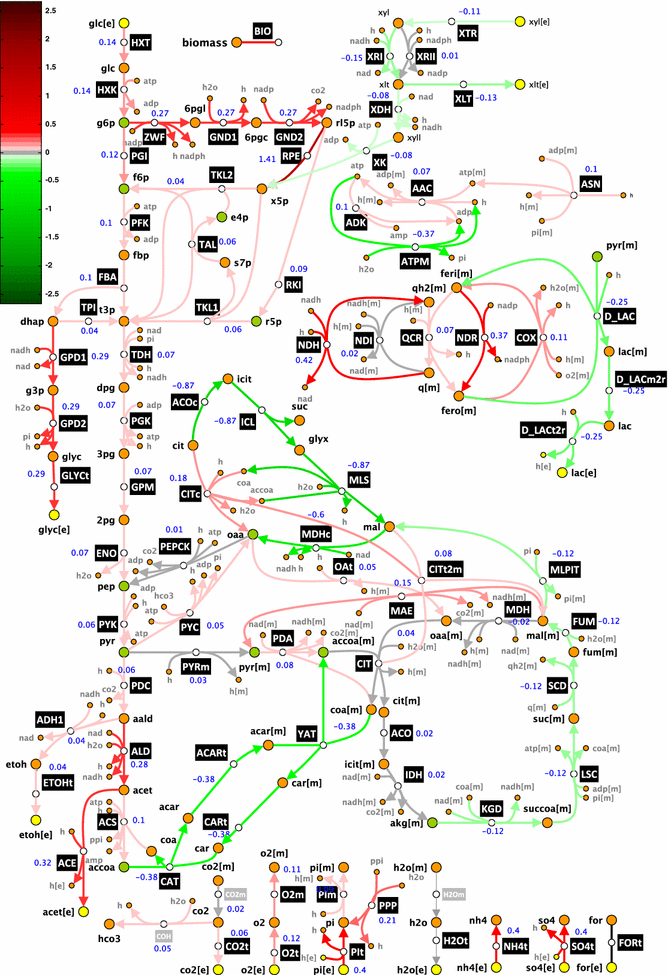
Predicted effects of HXK manipulations on the metabolic fluxes. An increased activity of HXK would result in reactions with: increased flux (red), decreased flux (green), or negligible changes in flux (gray). Higher intensity of red or green indicates larger changes in fluxes. The numerical values shown above reactions denote the mean control coefficients upon changes in HXK, i.e., CHXK where asterisk denotes any metabolic flux in the network
Fig. 8
Fig. 8
Flowchart of the ORACLE framework. The successive application of computational procedures integrates biological information from different sources, thereby refining kinetic models and providing guidance for metabolic engineering

References

    1. Lynd LR, Wyman CE, Gerngross TU. Biocommodity engineering. Biotechnol Progr. 1999;15(5):777–793. doi: 10.1021/bp990109e. - DOI - PubMed
    1. Furusawa C, Horinouchi T, Hirasawa T, Shimizu H. Systems metabolic engineering: the creation of microbial cell factories by rational metabolic design and evolution. Adv Biochem Eng Biotechnol. 2013;131:1–23. - PubMed
    1. Aristidou A, Penttila M. Metabolic engineering applications to renewable resource utilization. Curr Opin Biotechnol. 2000;11(2):187–198. doi: 10.1016/S0958-1669(00)00085-9. - DOI - PubMed
    1. Nielsen LK. Metabolic engineering from retrofitting to green field. Nat Chem Biol. 2011;7(7):407–408. doi: 10.1038/nchembio.601. - DOI - PubMed
    1. Kotter P, Amore R, Hollenberg CP, Ciriacy M. Isolation and characterization of the Pichia-stipitis xylitol dehydrogenase gene, Xyl2, and construction of a xylose-utilizing Saccharomyces-cerevisiae transformant. Curr Genet. 1990;18(6):493–500. doi: 10.1007/BF00327019. - DOI - PubMed