. 2017 Jun 19:4:86.
doi: 10.3389/fmed.2017.00086. eCollection 2017.

Visualization of Global Disease Burden for the Optimization of Patient Management and Treatment

Affiliations

Visualization of Global Disease Burden for the Optimization of Patient Management and Treatment

Winfried Schlee et al. Front Med (Lausanne). .

Abstract

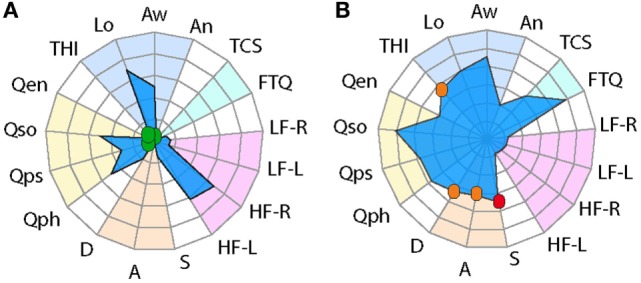
Background: The assessment and treatment of complex disorders is challenged by the multiple domains and instruments used to evaluate clinical outcome. With the large number of assessment tools typically used in complex disorders comes the challenge of obtaining an integrative view of disease status to further evaluate treatment outcome both at the individual level and at the group level. Radar plots appear as an attractive visual tool to display multivariate data on a two-dimensional graphical illustration. Here, we describe the use of radar plots for the visualization of disease characteristics applied in the context of tinnitus, a complex and heterogeneous condition, the treatment of which has shown mixed success.

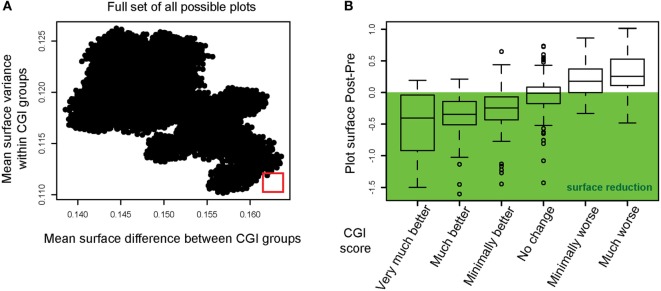
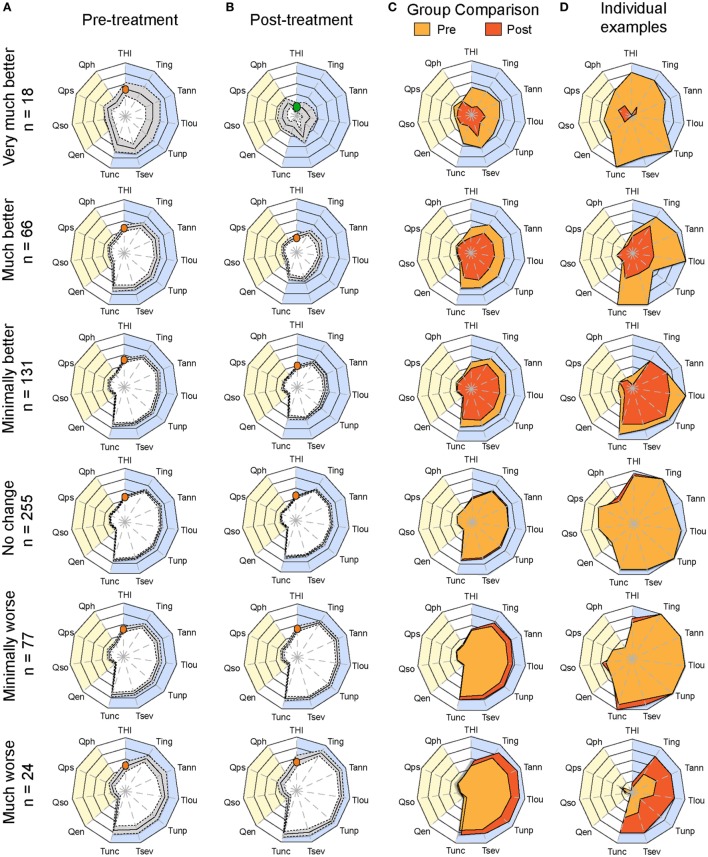
Methods: Data from two different cohorts, the Swedish Tinnitus Outreach Project (STOP) and the Tinnitus Research Initiative (TRI) database, were used. STOP is a population-based cohort where cross-sectional data from 1,223 non-tinnitus and 933 tinnitus subjects were analyzed. By contrast, the TRI contained data from 571 patients who underwent various treatments and whose Clinical Global Impression (CGI) score was accessible to infer treatment outcome. In the latter, 34,560 permutations were tested to evaluate whether a particular ordering of the instruments could reflect better the treatment outcome measured with the CGI.

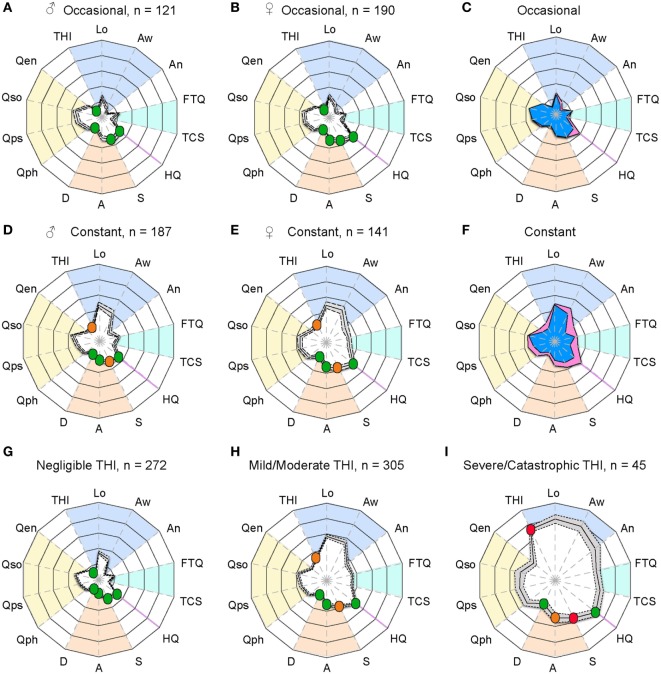
Results: Radar plots confirmed that tinnitus subtypes such as occasional and chronic tinnitus from the STOP cohort could be strikingly different, and helped appreciate a gender bias in tinnitus severity. Radar plots with greater surface areas were consistent with greater burden, and enabled a rapid appreciation of the global distress associated with tinnitus in patients categorized according to tinnitus severity. Permutations in the arrangement of instruments allowed to identify a configuration with minimal variance and maximized surface difference between CGI groups from the TRI database, thus affording a means of optimally evaluating the outcomes in individual patients.

Conclusion: We anticipate such a tool to become a starting point for more sophisticated measures in clinical outcomes, applicable not only in the context of tinnitus but also in other complex diseases where the integration of multiple variables is needed for a comprehensive evaluation of treatment response.

Keywords: diagnostic tests; disease progression; gender differences; patient management; subtyping; treatment outcome; treatment response; value-based decision-making.


Figures

Figure 1
Figure 1
Radar plot profiling for characterizing global health burden in individuals with constant tinnitus. Two tinnitus cases are represented in the radar plots. (A) A 72-year-old male subject with high loudness and awareness values displays high-frequency hearing loss but little tinnitus-associated burden. (B) A 31-year-old male subject with no hearing loss shows high loudness and awareness scores but with mild/moderate THI scores, moderate depression and anxiety, and severe stress scores. Domains of tinnitus-related burden are grouped in the dark blue region, hearing loss comorbidities in light blue, emotional comorbidities in orange region, and health-related quality of life in yellow. Instruments are labeled as follows: THI, tinnitus-related psychological distress; Lo, tinnitus loudness; Aw, tinnitus awareness; An, tinnitus annoyance; TCS, tinnitus catastrophizing; FTQ, tinnitus fears; LF, low frequency hearing in the left (-L) and right (-R) ears; HF, high-frequency hearing in the left (-L) and right (-R) ears; S, stress; A, anxiety; D, depression scores; Qph, Quality of Life for physical; Qps, psychological, Qso, social; Qen, environment. Color dots illustrate the severity score of those instruments with published severity category boundaries: negligible (green), moderate (orange), and severe (red).
Figure 2
Figure 2
Radar plot profiling that characterizes greater burden in women with tinnitus than in men. Radar plots illustrating the evaluation of global changes in tinnitus burden according to occasional tinnitus for men (A) and women (B) and constant tinnitus for men (D) and women (E). In all four plots, a solid line shows the average, with the 95% confidence intervals represented by the dashed lines. Average tinnitus-associated burden, for men (blue) and women (pink) is shown for occasional (C) and constant (F) tinnitus. Measures from (G) negligible, (H) mild/moderate, and (I) severe/catastrophic THI groups from the STOP database. The blue background gathers the tinnitus domain assessed with the THI and several numerical rating scales, the light blue represents the tinnitus-associated fears, the hyperacusis domain is marked in purple, emotional affects are in orange, and the yellow background represents the quality of life domain evaluated with the WHOQoL-BREF. The continuous line shows the average scores, and the dashed lines illustrate the 95% confidence intervals. Instruments are labeled as follows: THI, tinnitus-related psychological distress; Lo, tinnitus loudness; Aw, tinnitus awareness; An, tinnitus annoyance; TCS, tinnitus catastrophizing; FTQ, tinnitus fears; HQ, hyperacusis questionnaire; S, stress; A, anxiety; D, depression scores; quality of life for physical (Qph), psychological (Qps), social (Qso), and environment (Qen). Color dots illustrate the severity score of those instruments with published severity category boundaries: negligible (green), moderate (orange), and severe (red).
Figure 3
Figure 3
Instrument permutations and alignment of the radar plot with improvements in Clinical Global Impression. (A) The full set of all possible radar plots with different surface outlines (i.e., different organization of axes) was simulated. The mean surface difference between CGI groups was calculated for all radar plots (abscissa). The mean surface variance within CGI groups was calculated and plotted on the ordinate. The red square highlights the radar plot outline optimized for maximum difference between CGI categories and minimum variance within CGI categories. (B) Radar plot surface differences (post-intervention minus pre-intervention) are displayed for the optimal outline. The mean surface difference is shown for each CGI category.
Figure 4
Figure 4
Plots of average pretreatment and posttreatment scores based on CGI ratings. Radar plots illustrating the evaluation of global changes in tinnitus burden according to measures from (A) baseline (pretreatment) and (B) follow-up (posttreatment) during the evaluation of various treatments within the TRI database. Patients were grouped according to Clinical Global Impression scores and their number is shown on the left. The yellow background represents the quality of life domain evaluated with the WHOQoL-BREF and the blue background gathers the tinnitus domain assessed with the THI and several numerical rating scales. The continuous line in the pretreatment and posttreatment shows the average scores, and the dashed lines illustrate the 95% confidence intervals. (C) Pretreatment (yellow) and posttreatment (orange) average values are presented on the same plot. The orange dot in the THI scale marks the moderate scores of the group for this instrument, whereas the green shows the progression of the group to negligible THI. Note the reduction of tinnitus-associated burden in the “very much better” group. (D) Example of individuals within each CGI category to illustrate changes before and after treatment for the same patient. Instruments are labeled as follows: THI, Tinnitus Handicap Inventory; Tign, Tinnitus Numeric Rating Scale (Ignore); Tann, Tinnitus Numeric Rating Scale (Annoyance); Tlou, Tinnitus Numeric Rating Scale (Loudness); Tunp, Tinnitus Numeric Rating Scale (Unpleasant); Tsev, Tinnitus Numeric Rating Scale (Severity); Tunc, Tinnitus Numeric Rating Scale (Uncomfortable); Qen, WHO Quality of Life (environment); Qso, WHO Quality of Life (social relationships); Qps, WHO Quality of Life (psychological); Qph, WHO Quality of Life (physical health). Statistical analyses comparing (A,B) are available in Table S2 in Supplementary Material.

References

    1. Hunter DJ. Gene-environment interactions in human diseases. Nat Rev Genet (2005) 6:287–98.10.1038/nrg1578 - DOI - PubMed
    1. Massa MS, Wang N, Bickerton WL, Demeyere N, Riddoch MJ, Humphreys GW. On the importance of cognitive profiling: a graphical modelling analysis of domain-specific and domain-general deficits after stroke. Cortex (2015) 71:190–204.10.1016/j.cortex.2015.06.006 - DOI - PubMed
    1. Tyler RS, Baker LJ. Difficulties experienced by tinnitus sufferers. J Speech Hear Disord (1983) 48:150–4.10.1044/jshd.4802.150 - DOI - PubMed
    1. Stouffer JL, Tyler RS. Characterization of tinnitus by tinnitus patients. J Speech Hear Disord (1990) 55:439–53.10.1044/jshd.5503.439 - DOI - PubMed
    1. Elgoyhen AB, Langguth B, De Ridder D, Vanneste S. Tinnitus: perspectives from human neuroimaging. Nat Rev Neurosci (2015) 16:632–42.10.1038/nrn4003 - DOI - PubMed

LinkOut - more resources