. 2018 May;218(3):1143-1155.
doi: 10.1111/nph.14676. Epub 2017 Jul 4.

Two proteases with caspase-3-like activity, cathepsin B and proteasome, antagonistically control ER-stress-induced programmed cell death in Arabidopsis

Affiliations

Two proteases with caspase-3-like activity, cathepsin B and proteasome, antagonistically control ER-stress-induced programmed cell death in Arabidopsis

Yao-Min Cai et al. New Phytol. 2018 May.

Abstract

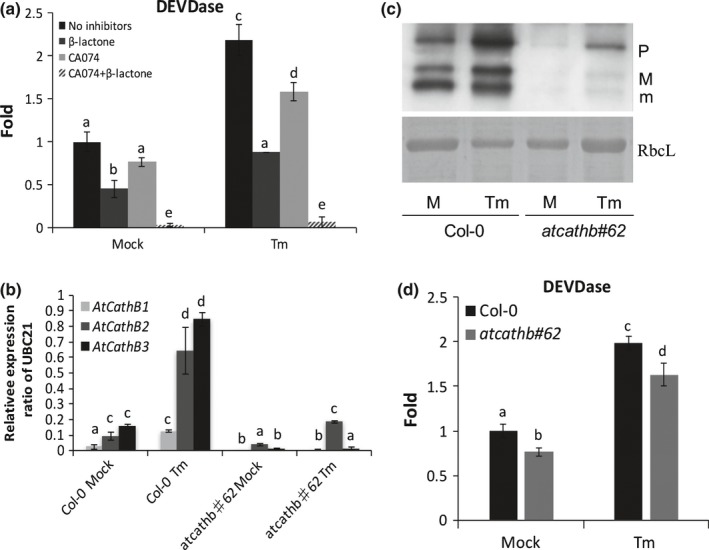
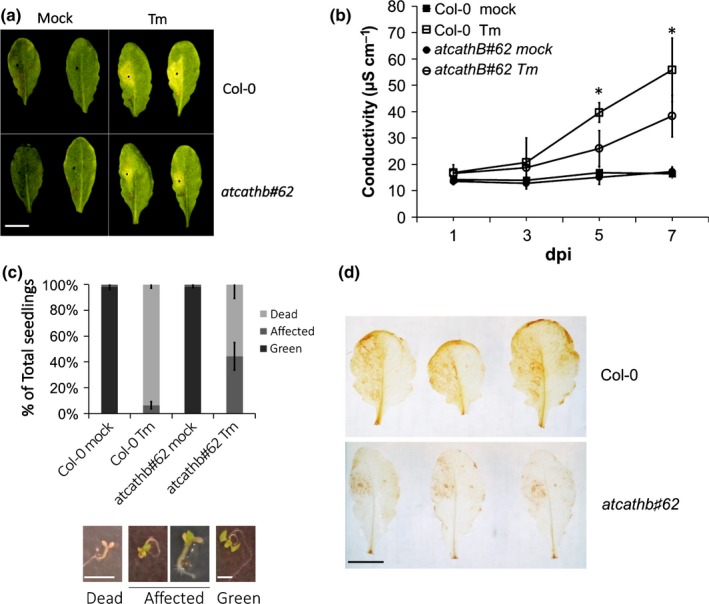
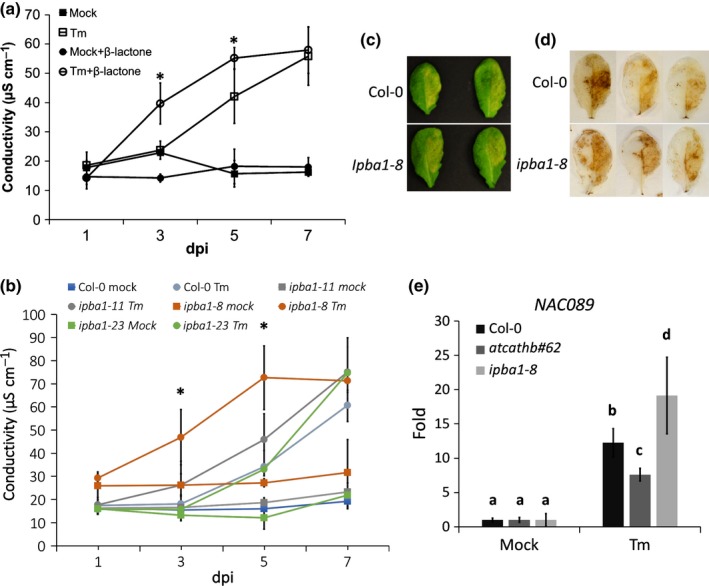
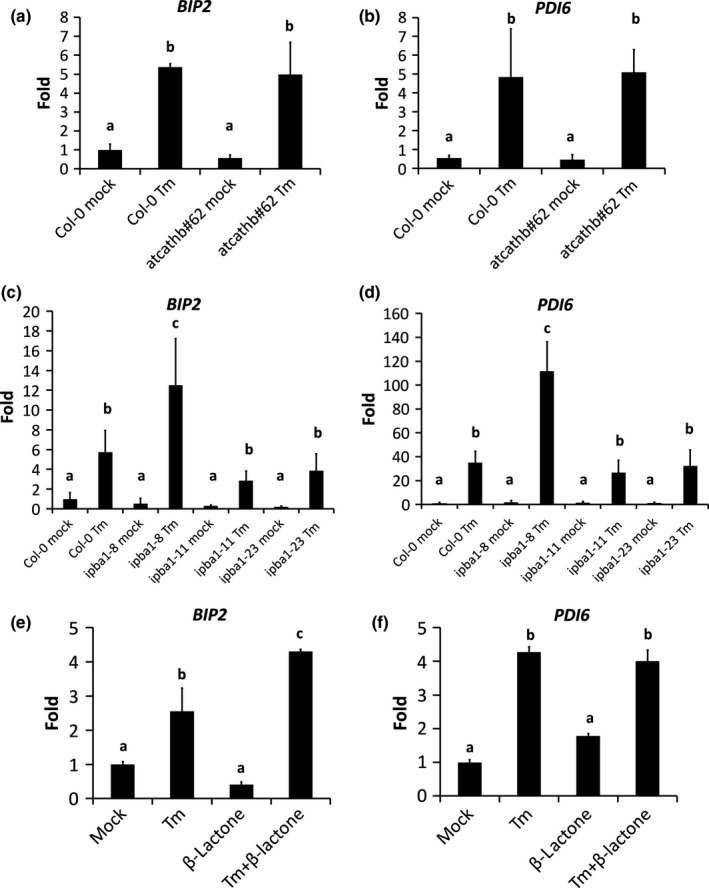
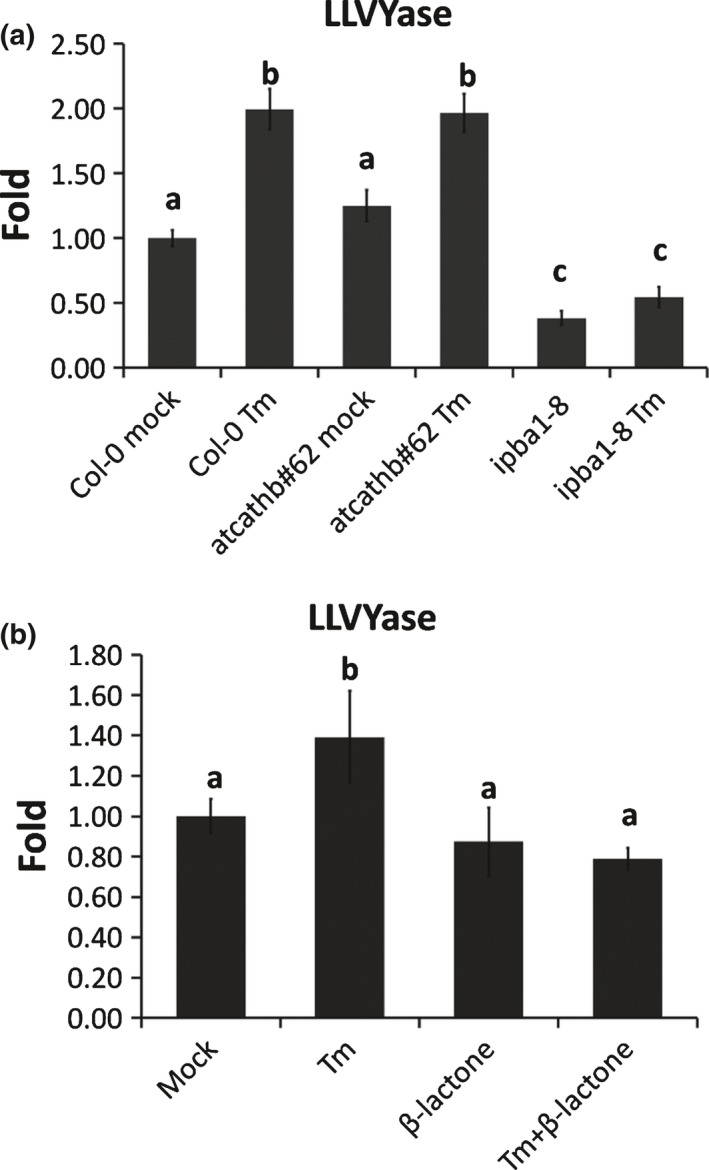
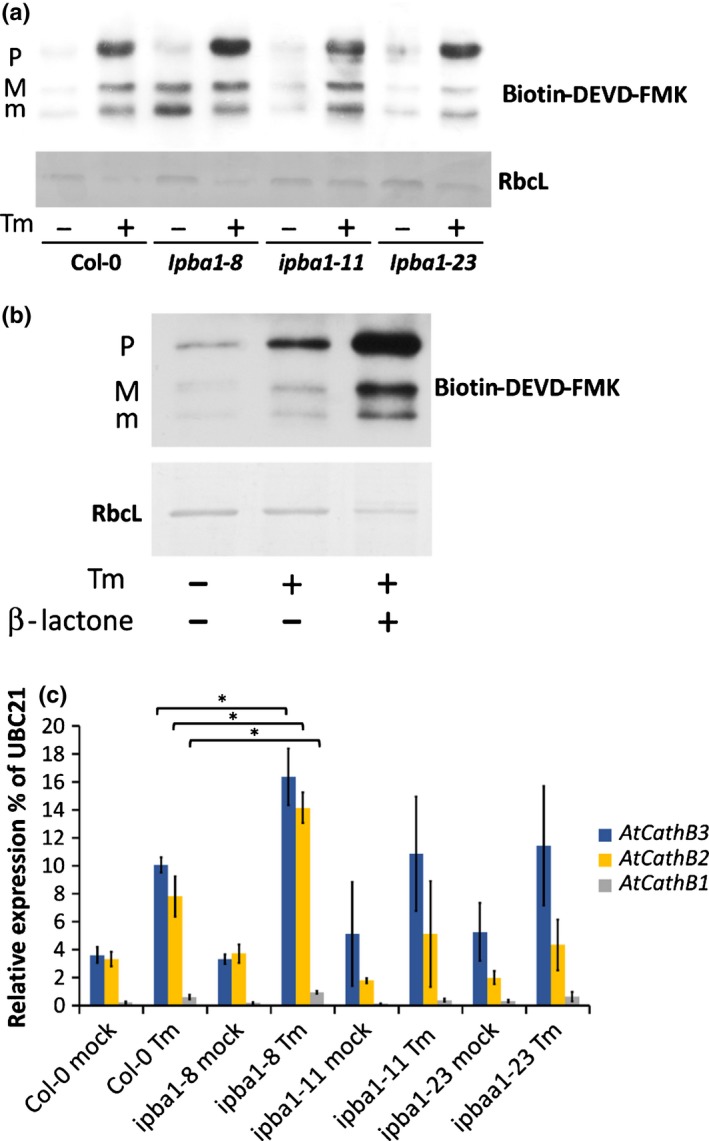
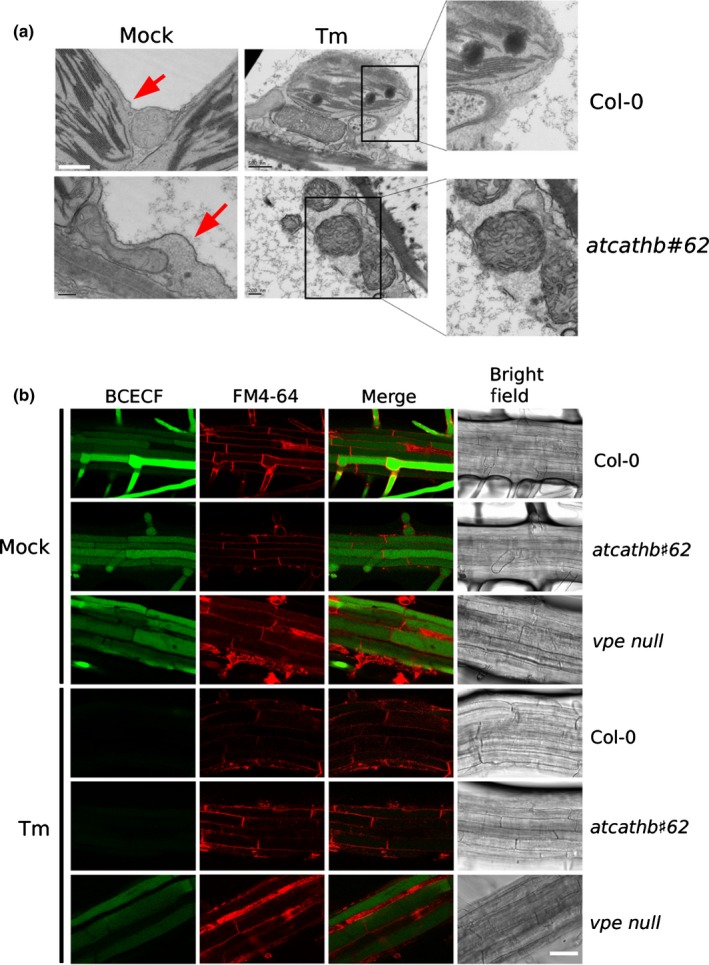
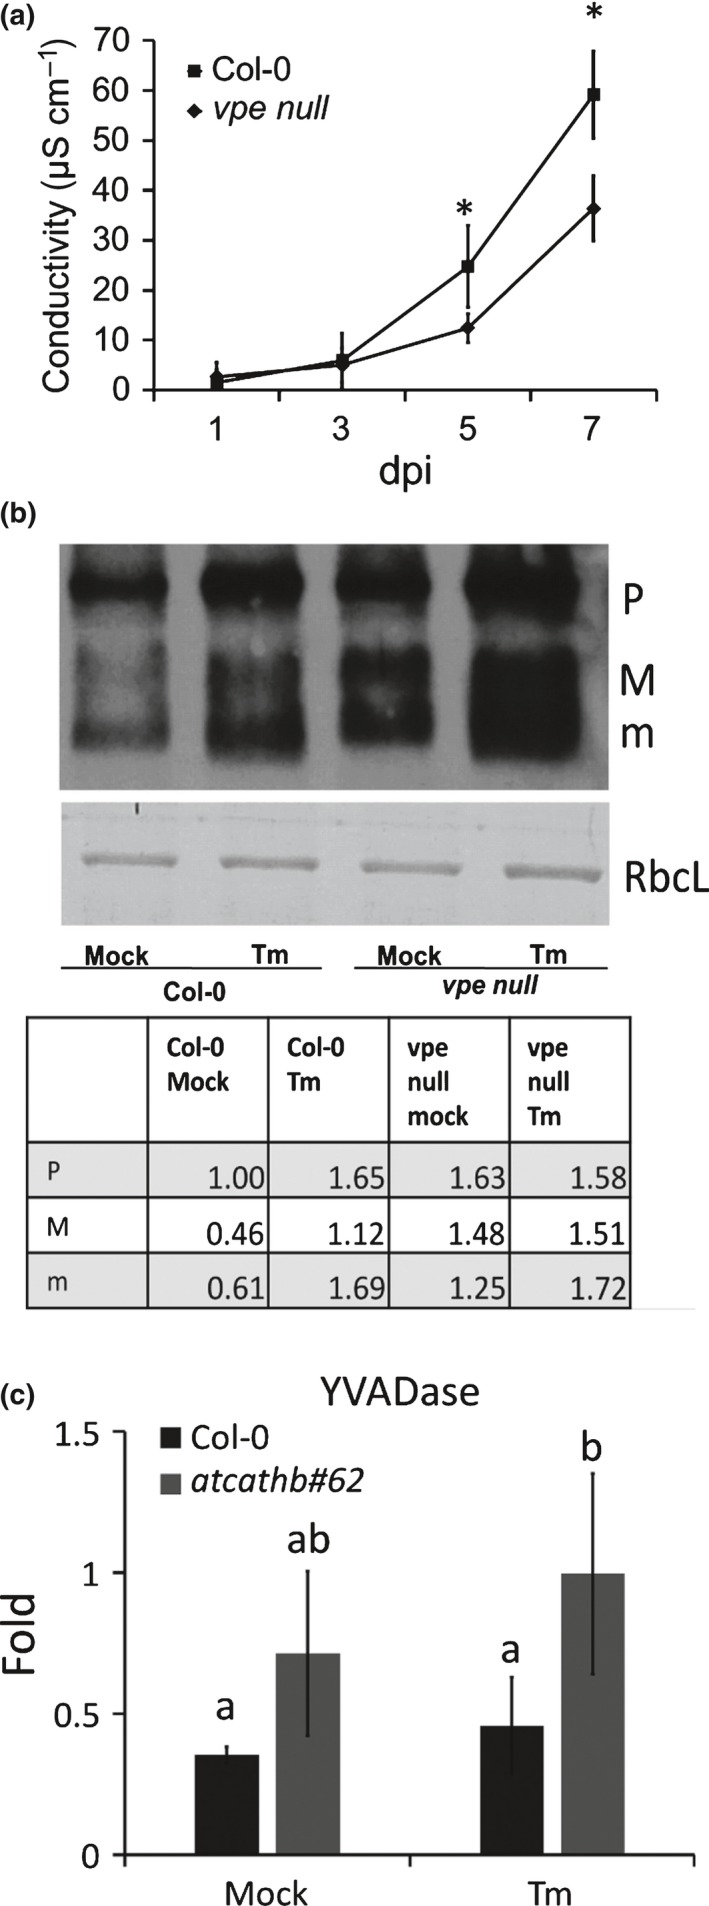
Programmed cell death (PCD) induced by endoplasmic reticulum (ER) stress is implicated in various plant physiological processes, yet its mechanism is still elusive. An activation of caspase-3-like enzymatic activity was clearly demonstrated but the role of the two known plant proteases with caspase-3-like activity, cathepsin B and proteasome subunit PBA1, remains to be established. Both genetic downregulation and chemical inhibition were used to investigate the function of cathepsin B and PBA1 in ER-stress-induced PCD (ERSID). Transcript level and activity labelling of cathepsin B were used to assess activation. To study tonoplast rupture, a plant PCD feature, both confocal and electronic microscopies were used. Cathepsin B downregulation reduced reactive oxygen species (ROS) accumulation and ERSID without affecting the induction of the unfolded protein response (UPR), but downregulation of PBA1 increased UPR and ERSID. Tonoplast rupture was not altered in the cathepsin B mutant and cathepsin B activation was independent of vacuolar processing enzyme (VPE). VPE activity was independent of cathepsin B. ERSID is regulated positively by cathepsin B and negatively by PBA1, revealing a complex picture behind caspase-3-like activity in plants. Cathepsin B may execute its function after tonoplast rupture and works in parallel with VPE.

Keywords: ER-stress-induced death (ERSID); endoplasmic reticulum (ER)-stress; plant protease; proteasome subunit PBA1; tunicamycin; unfolded protein response (UPR); vacuolar processing enzyme (VPE); vacuole.


Figures

Figure 1
Figure 1
Both proteasome and cathepsin B contribute to caspase‐3‐like activity induced by endoplasmic reticulum (ER) stress in Arabidopsis leaves. (a) Caspase‐3‐like activity (DEVDase) in Arabidopsis thaliana leaf extract was measured using 50 μM DEVD‐Rh110 at Day 3 after mock (no inhibitor) or 15 μg ml−1 tunicamycin (Tm) treatment. β‐lactone (50 μM) was added to extracts to inhibit PBA1 and CA074 (1 mM) from inhibiting cathepsin B. Activity is presented as relative fold change against the Col‐0 mock sample. Error bars are 95% confidence interval (CI) of three biological replicates. Letters a–e represent groups with significant differences (P < 0.05; Student's t‐test). (b) Transcript levels of the three cathepsin B paralogues (AtCathB1, AtCathB2 and AtCathB3). Arabidopsis Col‐0 and the triple mutant atcathb♯62 leaves were infiltrated with mock solution or 15 μg ml−1 Tm. Total RNA was extracted at Day 3 post‐infiltration. Quantitative reverse transcription polymerase chain reaction (qRTPCR) data are presented as ratio to the reference gene UBC21. Primers used are in Supporting Information Table S1. Error bar represent 95% CI of three biological replicates. Letters a–d represent groups with significant differences (P < 0.05; Student's t‐test). (c) Leaves of Col‐0 or of cathepsin B triple mutant (atcathb♯62) were infiltrated with or without 15 μg ml−1 Tm. Leaves were harvested 3 d post‐infiltration. Leaf protein extracts were incubated with 100 μM biotin‐DEVDFMK for cathepsin B activity labelling. Biotin‐labelled proteins were separated by SDSPAGE and transferred to a nylon membrane following by detection using streptavidin‐HRP. As a loading control, the Rubisco large subunit (RbcL) was detected by ponceau S staining. Cathepsin B forms: procathepsin B (P), mature form1 (M), mature form2 (m). (d) Caspase‐3‐like activity (DEVDase) in leaf extract from Arabidopsis Col‐0 and atcathb#62 was measured using 50 μM DEVD‐Rh110 at Day 3 after mock or 15 μg ml−1 Tm treatment. Activity is presented as relative fold change against Col‐0 mock (no inhibitor) sample. Error bars are 95% CI of three biological replicates. Letters a–d represent groups with significant differences (P < 0.05; Student's t‐test).
Figure 2
Figure 2
Reduced programmed cell death (PCD) phenotype of an Arabidopsis cathepsin B triple mutant under ER stress. (a) Arabidopsis Col‐0 and cathepsin B triple mutant (atcathb♯62) leaves were treated with 15 μg ml−1 tunicamycin (Tm) or mock solution on the left half of each leaf. Photos were taken 3 d after treatment. Yellow area indicates leaf cells undergoing chlorosis. Two representative leaves for each treatment are presented. Bar, 6 mm. (b) For each leaf, the mean of the ion leakage (conductivity) for three leaf discs combined was recorded at the indicated days post‐infiltration (dpi). Error bars represent 95% confidence interval (CI) of three biological triplicates. Asterisks indicate statistical significance (P < 0.05; Student's t‐test). (c) Col‐0 and atcathb♯62 seedlings growing in Murashige & Skoog medium plate containing 0.2 μg ml−1 Tm or mock solution. Seedlings were scored into three classes (Dead, Affected and Green) based on their phenotype illustrated in images below. The stacked bar chart represents the % of each seedling class in total seedlings (n = 40) under different treatments. Error bars represent 95%CI of three replicates. (d) Col‐0 and atcathb♯62 leaves were stained using a DAB solution to detect H2O2. The left half of each leaf was infiltrated with 15 μg ml−1 Tm, the other half was infiltrated with mock solution. Three representative leaves for each treatment are presented. Bar, 5 mm.
Figure 3
Figure 3
Biochemical or genetic downregulation of the proteasome increases ion leakage induced by endoplasmic reticulum (ER) stress. (a) Inhibitor. Col‐0 leaves were infiltrated with 15 μg ml−1 tunicamycin (Tm), 50 μM of the proteasome inhibitor β‐lactone or both. For each leaf, the mean of the ion leakage (conductivity) for three leaf discs combined was recorded at the indicated days post‐infiltration (dpi). Error bars represent 95% confidence interval (CI) of three biological triplicates. Asterisks indicate statistical significance (P < 0.05; Student's t‐test) between Tm and Tm plus β‐lactone samples. (b) RNAi lines. Leaves of Col‐0 or of three RNAi lines downregulated for PBA1 (ipba1‐8, ipba1‐11 and ipba1‐23) were infiltrated with 15 μg ml−1 Tm. For each replicate, the mean of the ion leakage (conductivity) for three leaf discs combined was recorded at the indicated days post infiltration (dpi). Error bars represent 95% CI of three biological triplicates. Asterisks indicate statistical significance (P < 0.05; Student's t‐test). (c) Leaves of Arabidopsis Col‐0 and of the ipba1‐8 RNAi line (ipba1‐8) were treated with 15 μg ml−1 Tm on the right half or mock solution on the left half of each leaf. Photos were taken 3 d after treatment. Yellow area indicates leaf cells undergoing chlorosis. Two representative leaves for each treatment are presented. (d) Col‐0 and atcathb♯62 leaves were stained using a DAB solution to detect H2O2. The right half of each leaf was infiltrated with 15 μg ml−1 Tm, the left half was infiltrated with mock solution. Three representative leaves for each treatment are presented. (e) Transcript levels of the AtNAC089 gene (NAC089) in Col‐0, atcathb♯62 and ipba1‐8 leaves infiltrated with mock solution or 15 μg ml−1 Tm. Total RNA was extracted at 3 dpi. Quantitative reverse transcription polymerase chain reaction (qRTPCR) data are presented as ratio against the reference gene UBC21. Primers used are in Table S1. Error bar represent 95% confidence interval (CI) of three biological replicates. Letters a–d represent groups with significant differences (P < 0.05; Student's t‐test).
Figure 4
Figure 4
Cathepsin B and PBA1 downregulation have contrasting effects on the expression of unfolded protein response (UPR) genes. Arabidopsis leaves for each genetic background were infiltrated with mock solution or 15 μg ml−1 tunicamycin (Tm) and total RNA was extracted 1 or 3 d post‐infiltration (dpi). Quantitative reverse transcription polymerase chain reaction (qRTPCR) data for the UPR genes BIP2 and PDI6 are presented as a ratio of transcript level against the reference gene UBC21. Error bar represents 95% confidence interval (CI) of three independent leaves. Letters a–c represent groups with significant differences (P < 0.05; Student's t‐test). Primers used are in Table S1. (a, b) Col‐0 and the cathepsin B triple mutant atcathb♯62, 3 dpi. (c, d) Col‐0 and three RNAi lines downregulated for PBA1 (ipba1‐8, ipba1‐11 and ipba1‐23), 3 dpi. (e, f) Col‐0 leaves treated for 1 d with mock solution and 15 μg ml−1 Tm with or without the proteasome inhibitor β‐lactone (50 μM).
Figure 5
Figure 5
Cathepsin B downregulation does not affect proteasome activity during endoplasmic reticulum (ER) stress. Proteasome activity (LLVYase) was measured in Arabidopsis leaf protein extract using 50 μM suc‐LLVYAMC. Data are presented as fold change compared to Col‐0 mock. Error bars represent 95% confidence interval (CI) of three independent leaves. Letters a–c represent groups with significant differences (P < 0.05; Student's t‐test). (a) Leaves of Col‐0, the cathepsin B triple mutant atcathb♯62 or the ipba1‐8 downregulated line (ipba1‐8) were assayed 3 d after a 15 μg ml−1 tunicamycin (Tm) or a mock solution (Mock) infiltration. (b) Proteasome activity (LLVYase) was measured in Arabidopsis leaf protein extract of Col‐0 using 50 μM suc‐LLVYAMC. Leaves of Col‐0 were assayed 1 d post‐infiltration with mock solution (Mock), 15 μg ml−1 Tm infiltration, mock and 50 μM of the proteasome inhibitor β‐lactone (β‐lactone) or Tm (15 μg ml−1) with β‐lactone (50 μM) (Tm+β‐lactone).
Figure 6
Figure 6
Biochemical or genetic downregulation of the proteasome does increase cathepsin B activity during endoplasmic reticulum (ER) stress. Cathepsin B forms: pro‐cathepsin B (P), mature form1 (M), mature form2 (m). (a) Cathepsin B activity labelling. Arabidopsis leaves of Col‐0 or of three RNAi lines downregulated for PBA1 (ipba1‐8, ipba1‐11 and ipba1‐23) were infiltrated with or without 15 μg ml−1 tunicamycin (Tm), then harvested 3 d post‐infiltration (dpi). For cathepsin B activity labelling, leaf protein extract were incubated with 100 μM biotin‐DEVDFMK. After SDSPAGE and transfer to a nylon membrane, biotin‐labelled proteins were detected using streptavidin‐HRP. As a loading control, the Rubisco large subunit (RbcL) was detected by ponceau S staining. (b) Cathepsin B activity labelling. Leaves of Col‐0 were infiltrated mock solution, 15 μg ml−1 (Tm), Tm plus 50 μM of the proteasome inhibitor β‐lactone then harvested 3 dpi. For cathepsin B activity labelling, leaf protein extracts were incubated with 100 μM biotin‐DEVDFMK. After SDSPAGE and transfer to a nylon membrane, biotin‐labelled proteins were detected using streptavidin‐HRP. As a loading control, the Rubisco large subunit (RbcL) was detected by ponceau S staining. (c) Transcript levels of the three cathepsin B paralogues in Col‐0 Arabidopsis, and three RNAi lines downregulated for PBA1 (ipba1‐8, ipba1‐11 and ipba1‐23). Leaves of each genotype were treated with or without 15 μg ml−1 Tm and total RNA extracted at 3 d. Quantitative reverse transcription polymerase chain reaction (qRTPCR) results for each gene are presented as a ratio with the control gene UBC21 transcript level. Error bars represent 95% confidence interval (CI) for three independent leaves. Asterisks and brackets indicate the relevant statistical significance (P < 0.05; Student's t‐test).
Figure 7
Figure 7
Vacuole collapse in endoplasmic reticulum (ER)‐stress‐induced programmed cell death (PCD) is independent of cathepsin B. (a) Transmission electron microscopy of representative leaf cells of Arabidopsis Col‐0 and cathepsin B triple mutant atcathb♯62. Leaf cells were fixed at 3 d post‐infiltration (dpi) with 15 μg ml−1 tunicamycin (Tm) or mock treatment. Red arrows point at the intact tonoplast. Two insets show an enlarged area of ruptured tonoplast. Bars, 200 nm. (b) Four‐day old Arabidopsis seedlings of Col‐0, atcatgb♯62 and vpe null mutants were treated with or without 2.5 μg ml−1 Tm for 3 d. Vacuoles in root cells were stained using BCECF (green) and the membranes using FM4‐64 (red). Red, green channel, merged and white‐light confocal images of representative roots are presented. Bar, 100 μm.
Figure 8
Figure 8
Increased cathepsin B activity labelling in vpe null Arabidopsis during endoplasmic reticulum (ER)‐stress‐induced programmed cell death (PCD). (a) Ion leakage of Col‐0 and vpe null leaves treated with or without 15 μg ml−1 tunicamyacin (Tm) were recorded from 1 to 7 d‐post‐infiltration (dpi) with intervals of 2 d. Tm and mock with an equivalent concentration of dimethyl sulfoxide (DMSO) were infiltrated into adjacent halves of one leaf. Three discs were punched out in each half‐leaf. The relative ion leakage was obtained by subtracting ion leakage of mock samples from Tm‐treated samples. Error bars represent 95% confidence interval (CI) of biological triplicates. Asterisks indicate statistical significance (P < 0.05; Student's t‐test). (b) Leaves of Col‐0 or of cathepsin B triple mutant (atcatgb♯62) were infiltrated with or without 15 μg ml−1 Tm, then harvested 3 dpi. Leaf protein extracts were incubated with 100 μM biotin‐DEVDFMK for cathepsin B activity labelling. After SDSPAGE and transfer to a nylon membrane, biotin‐labelled proteins were detected using streptavidin‐HRP. As a loading control, the Rubisco large subunit (RbcL) was detected by ponceau S staining. Band intensities in the table were measured using scanning and imagej (http://imagej.nih.gov/ij/) processing and expressed as a ratio of Col‐0, mock P band. All band intensities were calibrated relative to RbcL intensity as a loading reference. Cathepsin B forms: pro‐cathepsin B (P), mature form1 (M), mature form2 (m). (c) Caspase‐1‐like activity (YVADase) in leaf extract was measured using 200 μM ac‐YVADAMC at day 3 after mock or 15 μg ml−1 Tm treatment. Activity is presented as relative fold change against Col‐0 mock (no inhibitor) sample. Error bars represent 95%CI of three biological replicates. Letters a and b represent groups with significant differences (P < 0.05; Student's t‐test).

Comment in

References

    1. Cacas JL. 2010. Devil inside: does plant programmed cell death involve the endomembrane system? Plant, Cell & Environment 33: 1453–1473. - PubMed
    1. Cai Y‐M, Yu J, Gallois P. 2014. Endoplasmic reticulum stress‐induced PCD and caspase‐like activities involved. Frontiers in Plant Science 5: 41. - PMC - PubMed
    1. Carter C, Pan S, Zouhar J, Avila EL, Girke T, Raikhel NV. 2004. The vegetative vacuole proteome of Arabidopsis thaliana reveals predicted and unexpected proteins. Plant Cell 16: 3285–3303. - PMC - PubMed
    1. Costa MDL, Reis PAB, Valente MAS, Irsigler AST, Carvalho CM, Loureiro ME, Aragão FJL, Boston RS, Fietto LG, Fontes EPB. 2008. A new branch of endoplasmic reticulum stress signaling and the osmotic signal converge on plant‐specific asparagine‐rich proteins to promote cell death. Journal of Biological Chemistry 283: 20209–20219. - PubMed
    1. Craiu A, Gaczynska M, Akopian T, Gramm CF, Fenteany G, Goldberg AL, Rock KL. 1997. Lactacystin and clasto‐lactacystin beta‐lactone modify multiple proteasome beta‐subunits and inhibit intracellular protein degradation and major histocompatibility complex class I antigen presentation. Journal of Biological Chemistry 272: 13437–13445. - PubMed

Publication types