

Comparative analysis of gut microbiota associated with body mass index in a large Korean cohort
- PMID: 28676106
- PMCID: PMC5497371
- DOI: 10.1186/s12866-017-1052-0
Comparative analysis of gut microbiota associated with body mass index in a large Korean cohort
Abstract
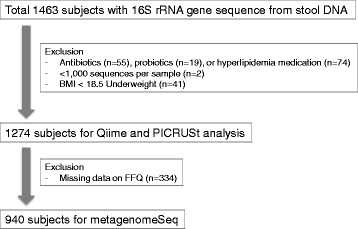
Background: Gut microbiota plays an important role in the harvesting, storage, and expenditure of energy obtained from one's diet. Our cross-sectional study aimed to identify differences in gut microbiota according to body mass index (BMI) in a Korean population. 16S rRNA gene sequence data from 1463 subjects were categorized by BMI into normal, overweight, and obese groups. Fecal microbiotas were compared to determine differences in diversity and functional inference analysis related with BMI. The correlation between genus-level microbiota and BMI was tested using zero-inflated Gaussian mixture models, with or without covariate adjustment of nutrient intake.
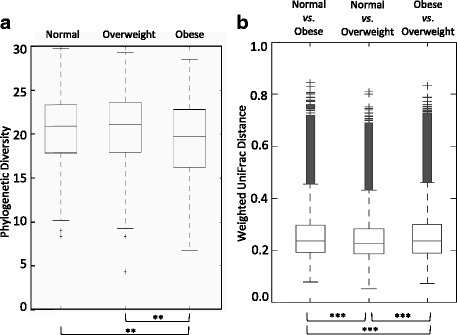
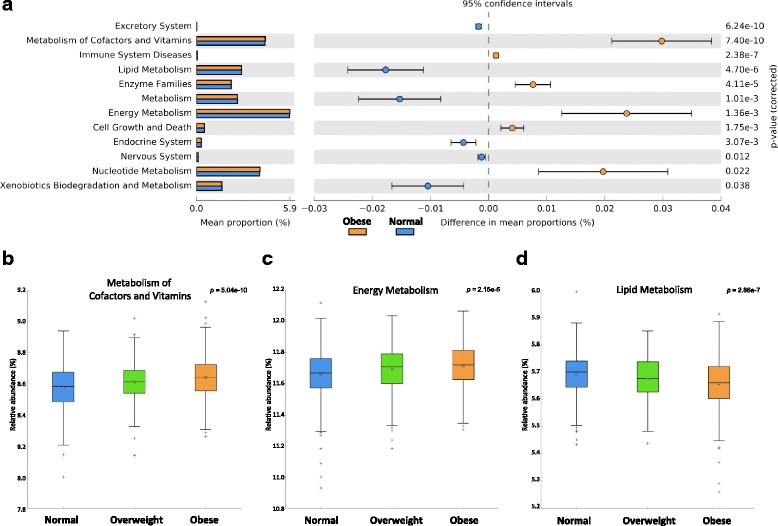
Results: We confirmed differences between 16Sr RNA gene sequencing data of each BMI group, with decreasing diversity in the obese compared with the normal group. According to analysis of inferred metagenomic functional content using PICRUSt algorithm, a highly significant discrepancy in metabolism and immune functions (P < 0.0001) was predicted in the obese group. Differential taxonomic components in each BMI group were greatly affected by nutrient adjustment, whereas signature bacteria were not influenced by nutrients in the obese compared with the overweight group.
Conclusions: We found highly significant statistical differences between normal, overweight and obese groups using a large sample size with or without diet confounding factors. Our informative dataset sheds light on the epidemiological study on population microbiome.
Keywords: Body mass index (BMI); Gut microbiota; Obesity.
Figures
Similar articles
-
Comprehensive analysis of the fecal microbiota of healthy Japanese adults reveals a new bacterial lineage associated with a phenotype characterized by a high frequency of bowel movements and a lean body type.BMC Microbiol. 2016 Nov 28;16(1):284. doi: 10.1186/s12866-016-0898-x. BMC Microbiol. 2016. PMID: 27894251 Free PMC article.
-
Low dietary fiber intake increases Collinsella abundance in the gut microbiota of overweight and obese pregnant women.Gut Microbes. 2018;9(3):189-201. doi: 10.1080/19490976.2017.1406584. Epub 2018 Mar 13. Gut Microbes. 2018. PMID: 29144833 Free PMC article.
-
Association between childhood obesity and gut microbiota: 16S rRNA gene sequencing-based cohort study.World J Gastroenterol. 2024 Apr 28;30(16):2249-2257. doi: 10.3748/wjg.v30.i16.2249. World J Gastroenterol. 2024. PMID: 38690025 Free PMC article.
-
Gut Microbiome Composition in Obese and Non-Obese Persons: A Systematic Review and Meta-Analysis.Nutrients. 2021 Dec 21;14(1):12. doi: 10.3390/nu14010012. Nutrients. 2021. PMID: 35010887 Free PMC article.
-
Progress of analytical tools and techniques for human gut microbiome research.J Microbiol. 2018 Oct;56(10):693-705. doi: 10.1007/s12275-018-8238-5. Epub 2018 Sep 28. J Microbiol. 2018. PMID: 30267313 Review.
Cited by
-
Unraveling the mystery: a Mendelian randomized exploration of gut microbiota and different types of obesity.Front Cell Infect Microbiol. 2024 Feb 5;14:1352109. doi: 10.3389/fcimb.2024.1352109. eCollection 2024. Front Cell Infect Microbiol. 2024. PMID: 38375360 Free PMC article.
-
The association of tonsillar microbiota with biochemical indices based on obesity and tonsillar hypertrophy in children.Sci Rep. 2023 Dec 20;13(1):22716. doi: 10.1038/s41598-023-49871-y. Sci Rep. 2023. PMID: 38123635 Free PMC article.
-
Reconstructing the landscape of gut microbial species across 29,000 diverse individuals.Nucleic Acids Res. 2023 May 22;51(9):4178-4190. doi: 10.1093/nar/gkad249. Nucleic Acids Res. 2023. PMID: 37070603 Free PMC article.
-
The Microbiota and Evolution of Obesity.Endocr Rev. 2025 Mar 11;46(2):300-316. doi: 10.1210/endrev/bnae033. Endocr Rev. 2025. PMID: 39673174 Free PMC article. Review.
-
An overview of basic pathophysiological interactions between gut bacteria and their host.Front Nutr. 2025 Aug 12;12:1565609. doi: 10.3389/fnut.2025.1565609. eCollection 2025. Front Nutr. 2025. PMID: 40873453 Free PMC article. Review.
References
-
- WHO Obesity and Overweight. Fact sheet No 311. 2015. http://www.who.int/mediacentre/factsheets/fs311/en/.
Publication types
MeSH terms
Substances
LinkOut - more resources
Full Text Sources
Other Literature Sources
Medical
