. 2017 Jul 4;7(1):4577.
doi: 10.1038/s41598-017-04111-y.

Transcriptomic profiling of Melilotus albus near-isogenic lines contrasting for coumarin content

Affiliations

Transcriptomic profiling of Melilotus albus near-isogenic lines contrasting for coumarin content

Kai Luo et al. Sci Rep. .

Abstract

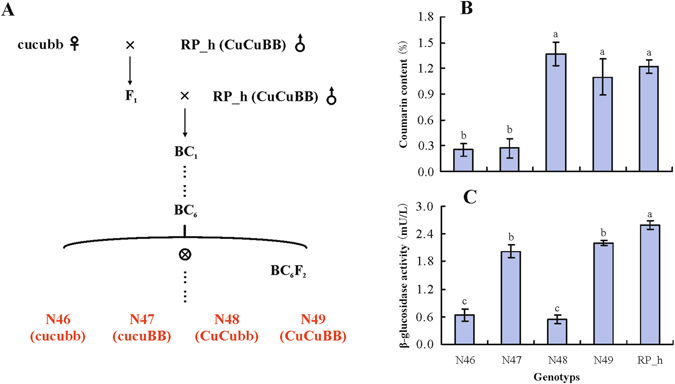
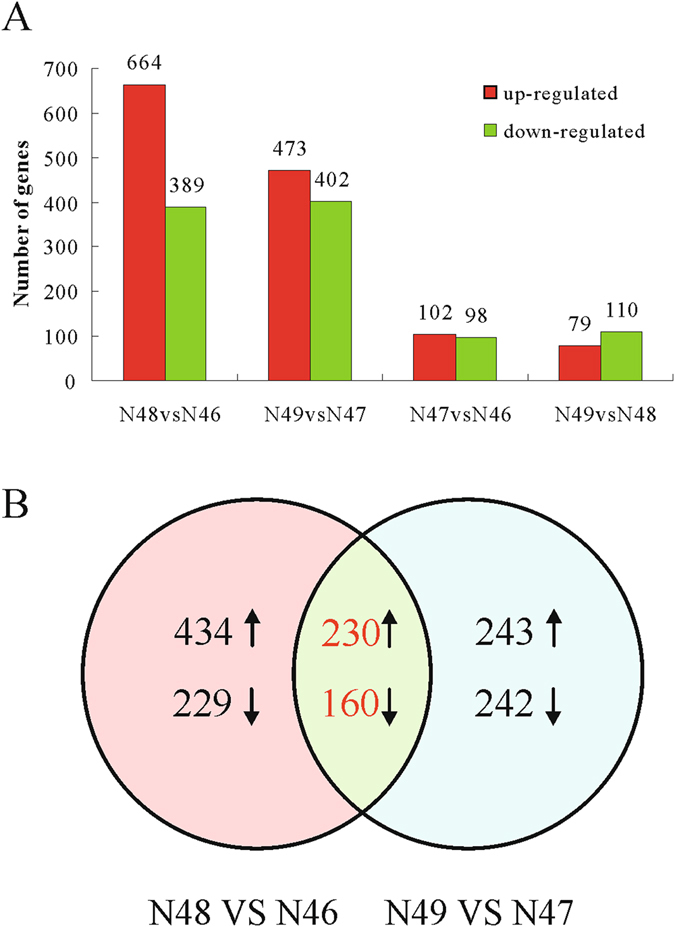
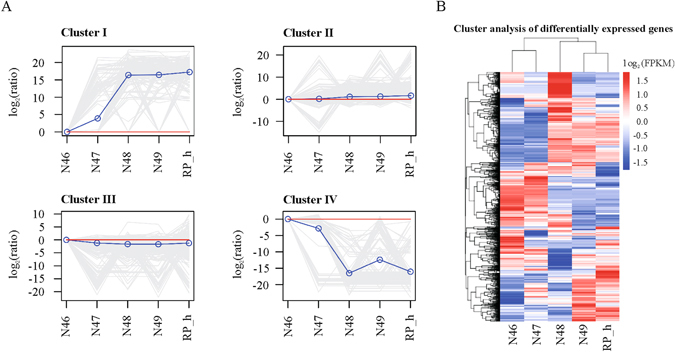
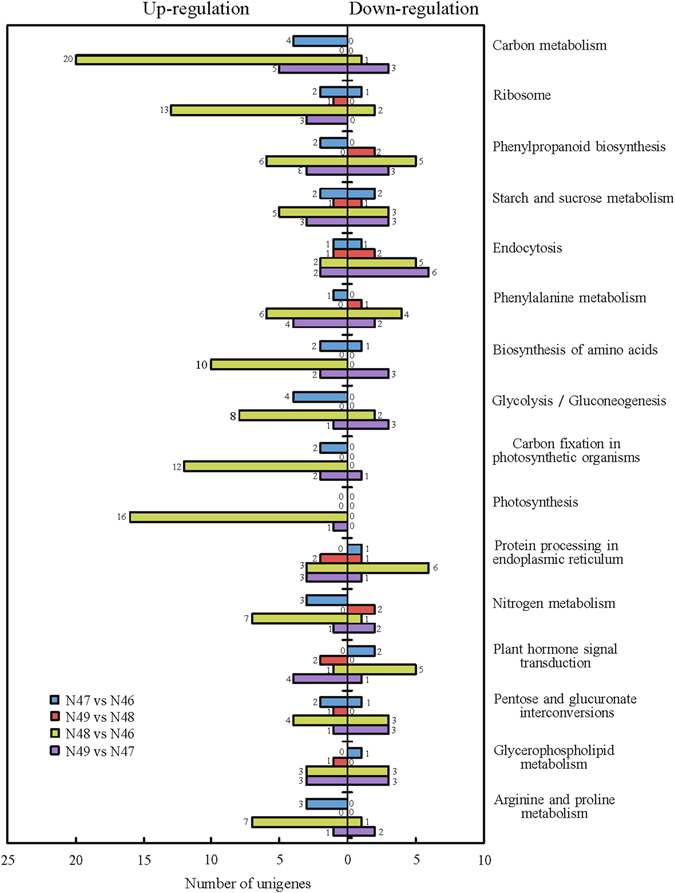
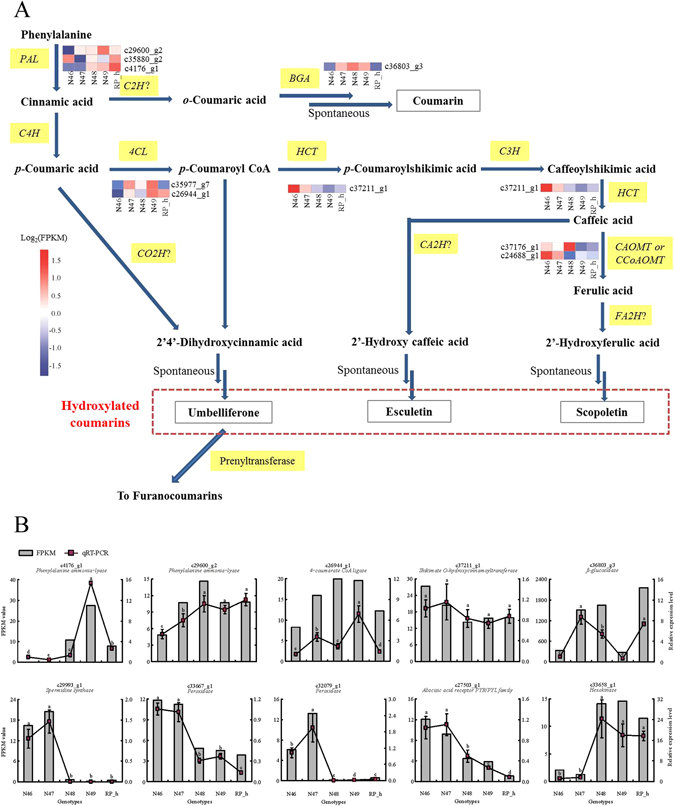
Coumarin and its derivatives are widely used as fragrances in industrial products and have medical value. The goal of the present study was to discover genes and pathways related to coumarin biosynthesis in Melilotus albus using transcriptome analysis. The genes of five M. albus near-isogenic lines (NILs) that had different coumarin content and β-glucosidase activity according to the investigation of pedigree were quantified and then analysed by RNA-Seq. Using transcriptome analysis, differentially expressed genes (DEGs) were identified in two pairwise comparisons that differed in coumarin content as well as in two pairwise comparisons that differed in β-glucosidase activity. Gene expression pattern analysis suggested similar transcriptional trends in the genotypes with the same coumarin levels. Furthermore, the Kyoto Encyclopedia of Genes and Genomes (KEGG) database of DEGs was used to identify functional pathways associated with coumarin biosynthesis. We identified 111 unigenes, with several DEGs among them possibly being related to coumarin synthesis pathways. Unigenes encoding a hexokinase, an abscisic acid receptor, a phenylalanine ammonia-lyase (PAL) and two peroxidases particularly showed correspondence with the coumarin content of different genotypes. These results will contribute to a better understanding of the coumarin biosynthesis in M. albus.


Conflict of interest statement

The authors declare that they have no competing interests.

Figures

Figure 1
Figure 1
Details of M. albus genotypes used in deep sequencing. (A) Summary of the pedigrees of five genotypes, (B) and (C) The coumarin content and β-glucosidase activity in each genotypes, three individual replicates were performed for each genotype. The significant differences were analysis and alphabet indicated P value < 0.05. Cu/cu and B/b are two pairs of alleles affecting coumarin content and β-glucosidase activity, respectively.
Figure 2
Figure 2
Differential gene expressions of M. albus. (A) The number of up- and down-regulated genes in comparisons of N48 vs N46; N49 vs N47; N47 vs N46 and N49 vs N48. (B) The Venn diagrams of DEGs from N48 vs N46 and N49 vs N47. The numbers marked in the diagram are the number of common genes between the two sets (log2 fold change ≥ 1 and padj ≤ 0.05).
Figure 3
Figure 3
Cluster analysis of DEGs among five M. albus genotypes. (A) K-means clusters of the gene expression. All differentially expressed unigenes were divided into 4 distinct expression profiles. The x-axis represents the different genotypes. The y-axis gives the degree of fold change observed for the each given genotype vs the N46 (‘reference’), presented as the log2 (ratio) value. The blue lines show model expression profiles. The gray lines represent individual gene expression profiles. The red lines show the log2 (ratio) value of N46 (‘reference’). (B) Heat-map showing the expression of all DEGs, using RNA-seq data derived from mean value of three replicates in each genotype based on log2 (FPKM) values. Intensity of color indicates expression levels. Similarity between genotypes and unigenes with hierarchical clustering is shown above and the left of the heatmap, respectively.
Figure 4
Figure 4
Functional categorization of genes differentially expressed in four comparisons of N48 vs N46; N49 vs N47; N47 vs N46 and N49 vs N48 based on Kyoto Encyclopedia of Genes and Genomes (KEGG) classification. Down- regulated (right) and up-regulated (left) unigenes were quantified. The numbers on the top of bar chart indicate the number of unigenes that were enriched in the KEGG pathway with Q value ≤ 0.05.
Figure 5
Figure 5
Expression patterns of genes involved in coumarin biosynthesis. (A) Simplified diagram depicting the biosynthesis pathway of coumarins in plant adapted from Bourgaud et al.. Yellow box indicate that the enzyme involved in this pathway. Enzymes assigned by a question mark are hypothetical. Intensity of color indicates expression levels. Abbreviations: PAL, phenylalanine ammonia-lyase; C2H, cinnamic acid 2-hydroxylase; BGA, β-glucosidase; C4H, trans-cinnamate 4-monooxygenase; 4CL, 4-coumarate–CoA ligase; HCT, shikimate O-hydroxycinnamoyltransferase; C3H, coumaroylquinate (coumaroylshikimate) 3′-monooxygenase; CAOMT, caffeic acid 3-O-methyltransferase; CCoAOMT, caffeoyl CoA O-methyltransferase; CA2H, caffeic acid 2-hydroxylase; CO2H, 4-coumaric acid 2-hydroxylase, FA2H, ferulic acid 2-hydroxylase. Dotted border shows three major hydroxylated coumarins. (B) Expression patterns of genes probably related to coumarin biosynthesis by RNA-Seq were validated by qRT-PCR. Gray histograms indicate transcript abundance change based on FPKM values according to RNA-Seq (left y-axis). Lines with standard error bar represents relative expression level determined by qRT-PCR from three biological replicates of each genotype using 2−∆∆CT method (right y-axis). Values with the same letter are not significantly different (Duncan’s test, P < 0.05).
Figure 6
Figure 6
Heat-map showing expression patterns of phenylpropanoid biosynthesis genes differentially regulated among five M. albus genotypes. The gene expression was used RNA-seq data derived from mean value of three replicates in each genotype based on log2 (FPKM) values. Intensity of color indicates expression levels. Similarity between genotypes and unigenes with hierarchical clustering is shown above and the left of the heatmap, respectively. Abbreviations: 4CL, 4-coumarate–CoA ligase; BGA, β-glucosidase; PAL, phenylalanine ammonia-lyase; HCT, shikimate O-hydroxycinnamoyltransferase; CCoAOMT, caffeoyl CoA O-methyltransferase; CAD, coniferyl-aldehyde dehydrogenase.

References

    1. Smith WK, Gorz HJ. Sweetclover improvement. Adv. Agron. 1965;17:63–231.
    1. Stevenson GA. An agronomic and taxonomic review of the genus Melilotus Mill. Can. J. Plant Sci. 1969;49:1–20. doi: 10.4141/cjps69-001. - DOI
    1. Maddaloni J. Forage production on saline and alkaline soils in the humid region of Argentina. Reclam Reveg Res. 1986;5:11–16.
    1. Stickler FC, Johnson IJ. Dry matter and nitrogen production of legumes and legume associations in the fall of the seeding year. Agron. J. 1959;51:135–137. doi: 10.2134/agronj1959.00021962005100030004x. - DOI
    1. Allen, O. N. & Allen, E. K. The Leguminosae: A source book of characteristics, uses and nodulation. Madison: The University of Wisconsin Press (1981).

Publication types

LinkOut - more resources