. 2017 Jul 4;7(1):4583.
doi: 10.1038/s41598-017-03041-z.

A channelopathy mutation in the voltage-sensor discloses contributions of a conserved phenylalanine to gating properties of Kv1.1 channels and ataxia

Affiliations

A channelopathy mutation in the voltage-sensor discloses contributions of a conserved phenylalanine to gating properties of Kv1.1 channels and ataxia

Sonia Hasan et al. Sci Rep. .

Abstract

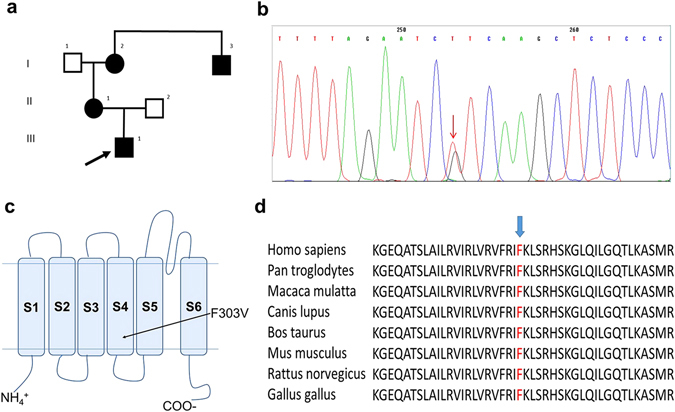
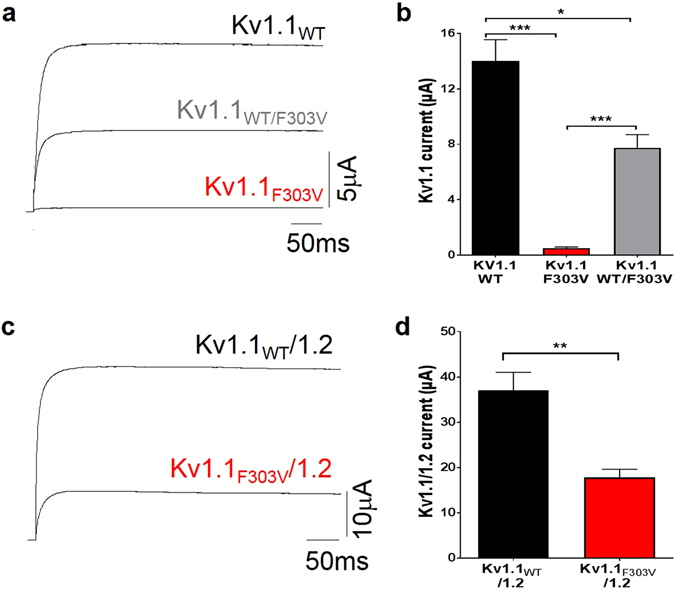
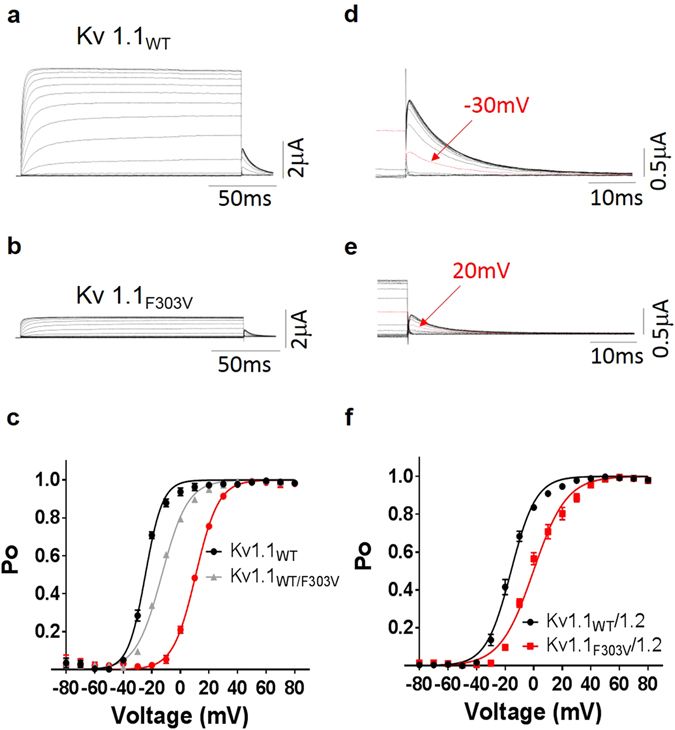
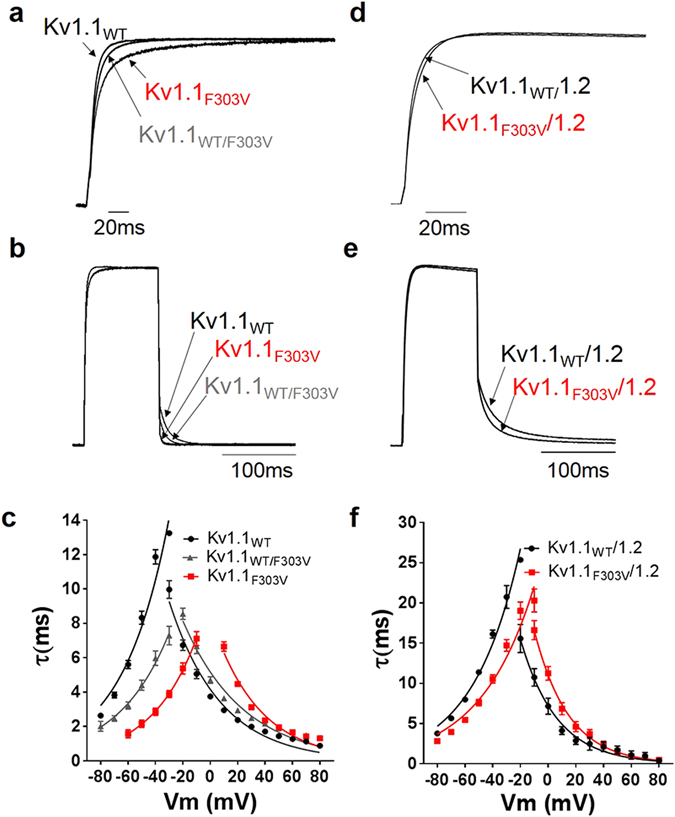
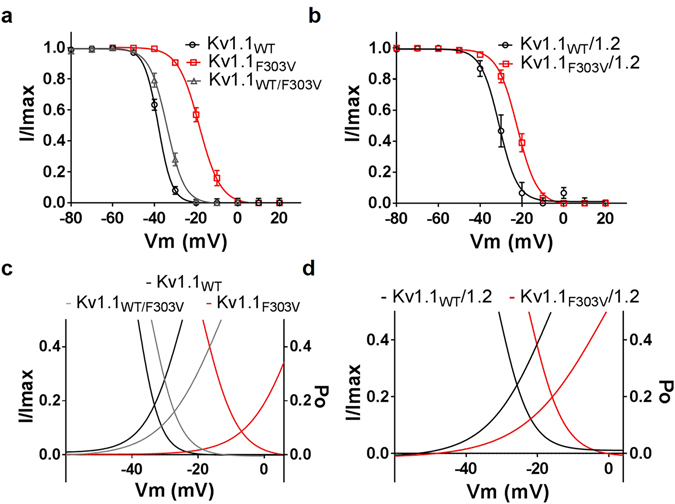
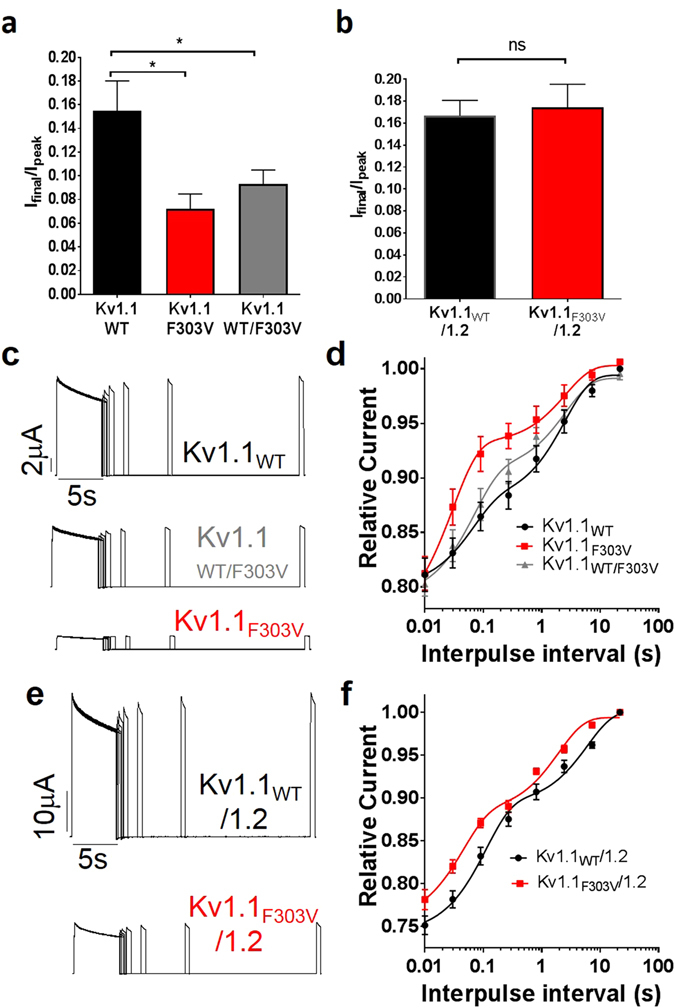
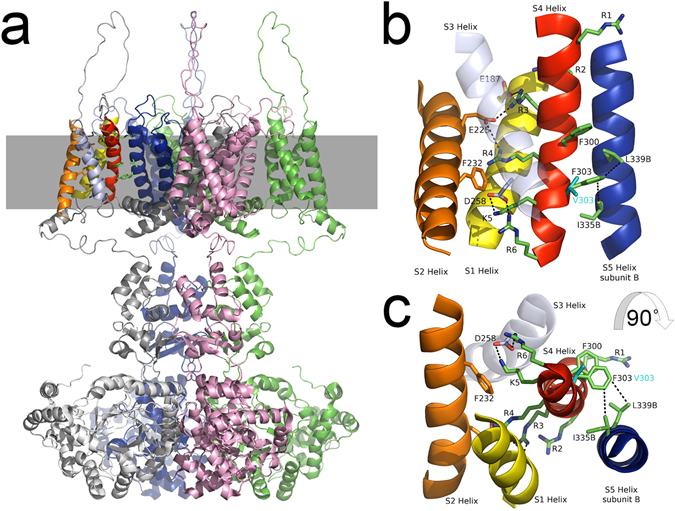
Channelopathy mutations prove informative on disease causing mechanisms and channel gating dynamics. We have identified a novel heterozygous mutation in the KCNA1 gene of a young proband displaying typical signs and symptoms of Episodic Ataxia type 1 (EA1). This mutation is in the S4 helix of the voltage-sensing domain and results in the substitution of the highly conserved phenylalanine 303 by valine (p.F303V). The contributions of F303 towards K+ channel voltage gating are unclear and here have been assessed biophysically and by performing structural analysis using rat Kv1.2 coordinates. We observed significant positive shifts of voltage-dependence, changes in the activation, deactivation and slow inactivation kinetics, reduced window currents, and decreased current amplitudes of both Kv1.1 and Kv1.1/1.2 channels. Structural analysis revealed altered interactions between F303V and L339 and I335 of the S5 helix of a neighboring subunit. The substitution of an aromatic phenylalanine with an aliphatic valine within the voltage-sensor destabilizes the open state of the channel. Thus, F303 fine-tunes the Kv1.1 gating properties and contributes to the interactions between the S4 segment and neighboring alpha helices. The resulting channel's loss of function validates the clinical relevance of the mutation for EA1 pathogenesis.


Conflict of interest statement

The authors declare that they have no competing interests.

Figures

Figure 1
Figure 1
Detecting and analyzing the mutation. (a) Pedigree of patient’s family. The arrow indicates the proband, black symbols indicate affected subjects. (b) DNA sequencing chromatogram of a section of KCNA1 (Kv1.1) exon 2 showing the heterozygous mutation segregating in the family. The arrow indicates the c907 T > G nucleotide substitution. (c) Schematic topology model of the human Kv1.1 subunit showing approximate site for the F303V mutation in the S4 segment. (d) Alignment of the region of interest for Kv1.1 channels from various species using MUSCLE 3.6. The arrow indicates the affected phenylalanine.
Figure 2
Figure 2
CMAPs evoked by repetitive nerve stimulation (RNS) of the tibial nerve at a high frequency (50 Hz). The decrement-increment phenomenon is indicated by the arrow.
Figure 3
Figure 3
Current reduction in cells expressing F303V cRNA. Representative Kv1.1 (a) and Kv1.1/1.2 (c) current traces recorded 5 days after oocyte injection at +60 mV from a holding potential of −80 mV. Bar graphs showing mean reduction in (b) Kv1.1 (n = 10 cells) and (d) Kv1.1/1.2 (n = 8) current amplitudes by the mutation (*p < 0.005, **p < 0.001, ***p < 0.0001).
Figure 4
Figure 4
Effect of F303V on the voltage-dependence of current activation. Representative Kv1.1WT (a) and Kv1.1F303V (b) whole-cell current families. Tail currents for Kv1.1WT (d) and Kv1.1F303V (e) were recorded at −50 mV preceded by several pre-pulse voltage commands. Arrows point out tail current amplitudes recorded after the indicated pre-pulse voltage commands. Kv1.1 (c) and Kv1.1/1.2 (f) activation (Po-V) curves derived from peak amplitudes of tail currents plotted as a function of pre-pulse potentials, and fitted with a Boltzmann function. For homomeric and heteromeric channels F303V mutation resulted in a right shift of the open probability curve to more positive potentials.
Figure 5
Figure 5
Effect of mutation on channel activation and deactivation kinetics. Activation kinetics were derived from the rising phase of currents evoked by depolarizing pulses (−20 to +80 mV), lasting 300 ms from a holding potential of −80 mV. Deactivation kinetics were derived from tail currents recorded at potentials −20 to −80 mV (pre-pulse potential +20 mV). Normalized and superimposed representative Kv1.1 (a) and Kv1.1/1.2 (d) activating currents were recorded at +20 mV, and Kv1.1 (b) and Kv1.1/1.2 (e) deactivating currents recorded at −50 mV. Activating and deactivating current traces were fitted with double and single exponential functions, respectively. Time constants of the currents were plotted as a function of membrane potential for Kv1.1 (c) and Kv1.1/1.2 (f) channels. Plots show that mutation results in slower activation but faster deactivation. The data points are mean ± SE of 8 cells.
Figure 6
Figure 6
Effect of mutation on voltage-dependence of slow inactivation of Kv1.1 channels and on window currents. Cells were depolarized to various pre-pulse potentials, from −80 mV to +20 mV in +10 mV increments for 20 seconds, and then held at +40 mV test potential for 200 msec. Peak current amplitudes recorded at test potential of +40 mV were normalized (I/Imax) and these values were plotted as a function of the pre-pulse potentials and fitted with a Boltzmann function. The mutation resulted in the positive shift of the inactivation-voltage relationships for both homomeric (a) and heteromeric (b) channels. F303V reduced both (c) Kv1.1 and (d) Kv1.1/1.2 window currents (the triangular areas under the overlapping point of the activation and inactivation curves of the respective channel).
Figure 7
Figure 7
Effect of F303V mutation on slow inactivation, residual current and recovery. (a and b) Bar graphs showing residual current after slow inactivation for Kv1.1 (a) and Kv1.1/1.2 (b) channels. A double-pulse recovery protocol at a depolarizing voltage of +60 mV was used to derive currents from (c) Kv1.1WT (top), Kv1.1WT/F303V (middle) and Kv1.1F303V (bottom) channels, and from (e) Kv1.1WT/1.2 (top) and Kv1.1F303V/1.2 (bottom) channels. Normalized peak current amplitudes were plotted as a function of interpulse interval for Kv1.1 (d) and Kv1.1/1.2 channels (f). The solid lines show the fit with the double exponential function Y = Y0 + SpanFast*(1-exp(-KFast*X)) + SpanSlow*(1-exp(-KSlow*X)), where SpanFast = (Plateau-Y0)*PercentFast*.01, SpanSlow = (Plateau-Y0)*(100-PercentFast)*.01 and K is the rate constant. Data points are mean ± SE of 6 cells.
Figure 8
Figure 8
Model structure of the human Kv1.1 potassium channel in the open-state. (a) The structure of the tetrameric channel is shown with each of the four polypeptide subunits colored overall grey, green, pink and blue. The position of the membrane is illustrated by a grey band and the brightly colored helices in the top left of the figure are shown in the expanded Figures b and c. (b) The membrane spanning region of interest depicting four helices of one subunit (S1 yellow, S2 orange, S3 lavender and S4 red) and one helix from a neighboring subunit (S5B, blue) are shown. Helix S3 lies in front of the other helices and is rendered transparent for clarity. Significant side chains are drawn in stick representations and binding partners indicated by black dotted lines between them. These include R3-E187, R3-E225, R4-E225, K5-D258, R6-D258, F303-L339B and F303-I335B. The predicted position of the V303 mutant side chain is also shown. (c) Illustrates the same structure as depicted in B rotated ninety degrees towards the observer. The stacking of F300 and F303 is well illustrated in this figure.

Comment in

Similar articles

Cited by

References

    1. Cusimano A, D’Adamo MC, Pessia M. An episodic ataxia type-1 mutation in the S1 segment sensitises the hKv1.1 potassium channel to extracellular Zn2+ FEBS Lett. 2004;576:237–244. doi: 10.1016/j.febslet.2004.09.018. - DOI - PubMed
    1. Wykes RC, et al. Optogenetic and Potassium Channel Gene Therapy in a Rodent Model of Focal Neocortical Epilepsy. Sci transl med. 2012;4:161ra152–161ra152. doi: 10.1126/scitranslmed.3004190. - DOI - PMC - PubMed
    1. Kole MHP, Letzkus JJ, Stuart GJ. Axon initial segment Kv1 channels control Axonal action potential Waveform and Synaptic efficacy. Neuron. 2007;55:633–647. doi: 10.1016/j.neuron.2007.07.031. - DOI - PubMed
    1. Rasband MN, Trimmer JS. Subunit composition and novel localization of K+ channels in spinal cord. J Comp Neurol. 2000;429:166–176. doi: 10.1002/1096-9861(20000101)429:1<166::AID-CNE13>3.0.CO;2-Y. - DOI - PubMed
    1. Geiger JRP, Jonas P. Dynamic control of Presynaptic Ca2+ inflow by Fast-Inactivating K+ channels in Hippocampal Mossy fiber Boutons. Neuron. 2000;28:927–939. doi: 10.1016/S0896-6273(00)00164-1. - DOI - PubMed

Publication types

MeSH terms

LinkOut - more resources