. 2017 Jun 20:11:42.
doi: 10.3389/fncir.2017.00042. eCollection 2017.

Trace Conditioning in Drosophila Induces Associative Plasticity in Mushroom Body Kenyon Cells and Dopaminergic Neurons

Affiliations

Trace Conditioning in Drosophila Induces Associative Plasticity in Mushroom Body Kenyon Cells and Dopaminergic Neurons

Kristina V Dylla et al. Front Neural Circuits. .

Abstract

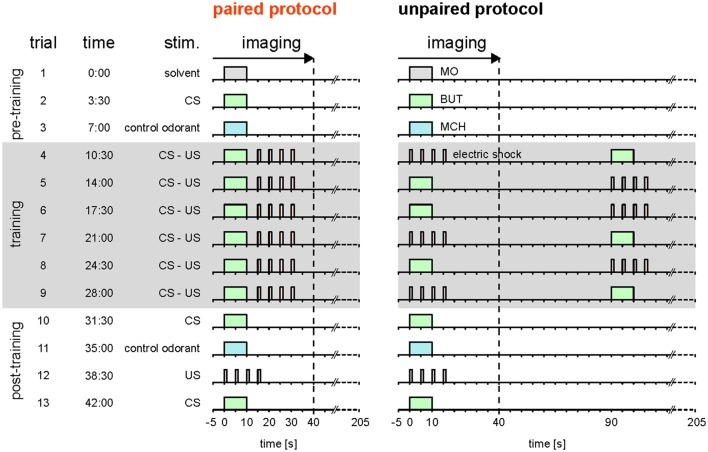
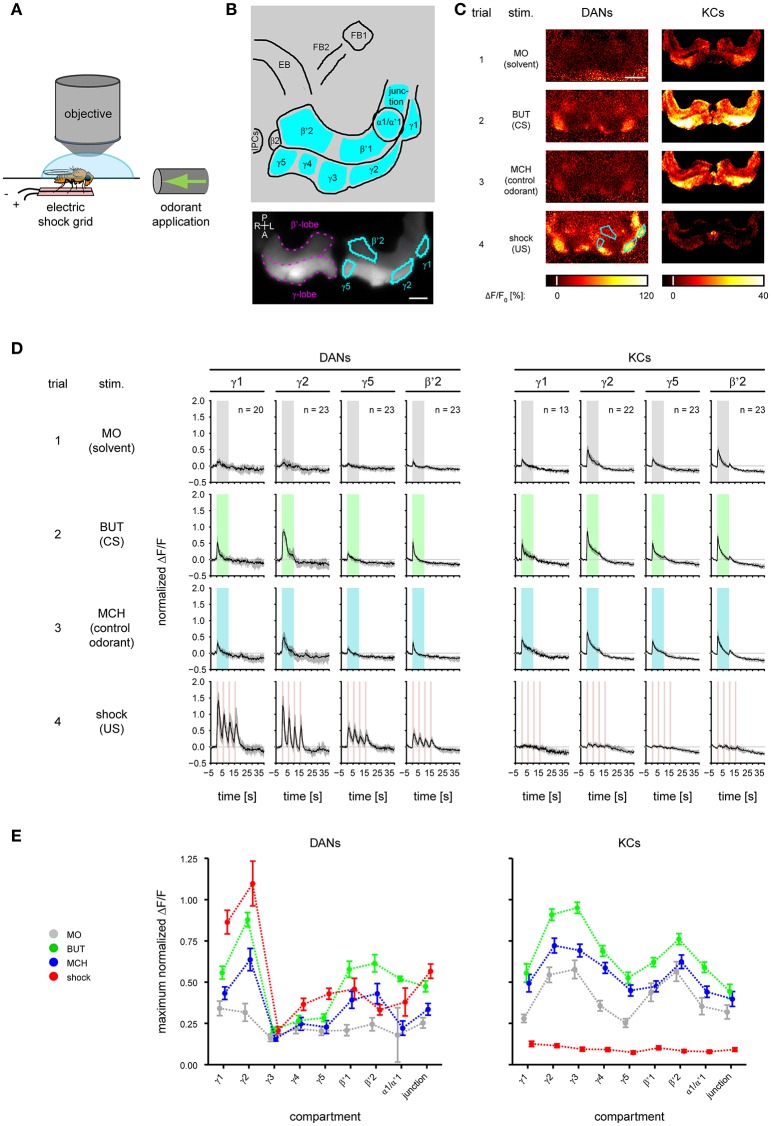
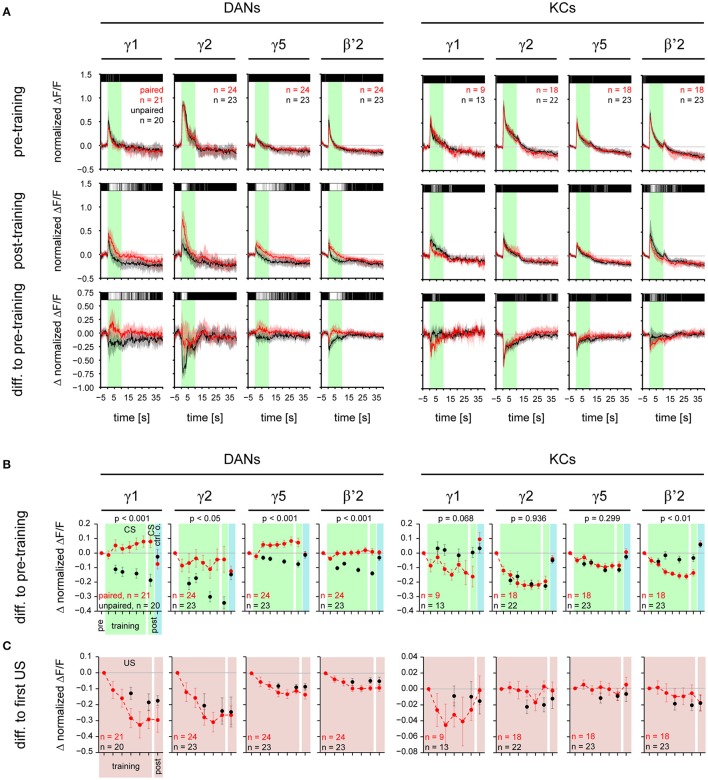
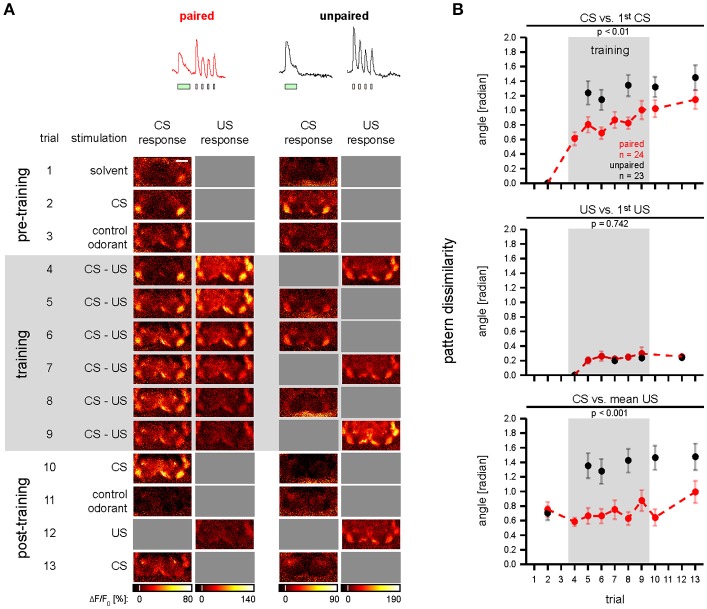
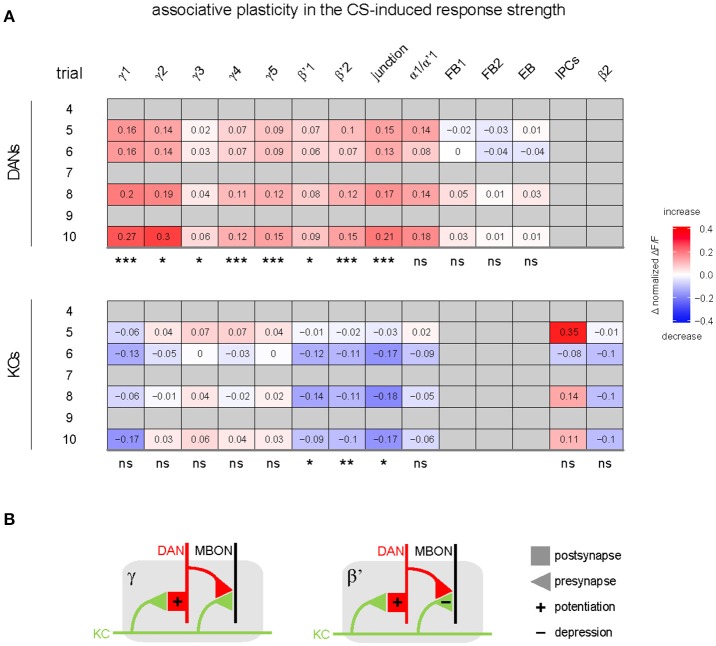
Dopaminergic neurons (DANs) signal punishment and reward during associative learning. In mammals, DANs show associative plasticity that correlates with the discrepancy between predicted and actual reinforcement (prediction error) during classical conditioning. Also in insects, such as Drosophila, DANs show associative plasticity that is, however, less understood. Here, we study associative plasticity in DANs and their synaptic partners, the Kenyon cells (KCs) in the mushroom bodies (MBs), while training Drosophila to associate an odorant with a temporally separated electric shock (trace conditioning). In most MB compartments DANs strengthened their responses to the conditioned odorant relative to untrained animals. This response plasticity preserved the initial degree of similarity between the odorant- and the shock-induced spatial response patterns, which decreased in untrained animals. Contrary to DANs, KCs (α'/β'-type) decreased their responses to the conditioned odorant relative to untrained animals. We found no evidence for prediction error coding by DANs during conditioning. Rather, our data supports the hypothesis that DAN plasticity encodes conditioning-induced changes in the odorant's predictive power.

Keywords: Drosophila; Kenyon cells; associative plasticity; calcium imaging; dopaminergic neurons; memory acquisition; mushroom body; trace conditioning.


Figures

Figure 1
Figure 1
Stimulation protocols. Paired and unpaired stimulation protocol. Both protocols were identical except for the training phase. Pre-training (trial 1–3): 10-s-long pulses of the solvent (MO; gray), the olfactory CS (BUT; green), and the control odorant (MCH; blue) were applied. Training (trial 4–9, shaded in gray): each of the six training trials consisted of a 10-s-long CS pulse and four 1.5-s-long 90 V US pulses (electric shock; red). The interval between the onsets of CS and US was 15 s in the paired protocol and 90 s in the unpaired protocol. In the unpaired group, the sequence of CS and US was pseudorandomized. Note that in both groups there was a stimulus-free gap between CS and US. Post-training (trial 10–13): CS, control odorant and US were followed by a last CS presentation at the end of the protocol to detect a possible run-down of calcium signals. The inter-trial interval was 210 s. Calcium imaging was performed during the first 45 s of each trial. Therefore, for the unpaired group only the first stimulus in each trial was recorded. The time of trial onsets is given in minutes. Each protocol lasted 45.5 min.
Figure 2
Figure 2
Odorant- and electric shock-induced responses in dopaminergic neurons (DANs) and Kenyon cells (KCs) differ between mushroom body (MB) compartments. (A) During calcium imaging electric foot shock and odorants were applied to the fly. (B) Top: schematic view of the analyzed regions. FB, fan-shaped body; EB, ellipsoid body; IPCs, insulin-producing cells. Nine MB compartments (indicated by cyan) were analyzed in both KCs and DANs. Bottom: DsRed raw fluorescence image with the MB β'- and γ-lobe (magenta) indicated in the right brain hemisphere. Four exemplary MB compartments γ1, γ2, γ5, and β'2 (cyan) are indicated in the left hemisphere. Dorsal view; P, posterior; L, left; A, anterior; R, right. Scale bar: 40 μm. (C) Color-coded activity patterns obtained for stimulations with odorants and electric shock in DANs (TH>GCaMP3 fly) and KCs (OK107>GCaMP3 fly) in the unpaired group prior to training (trial 1–4). The four exemplary MB compartments are identical to those in (B). Scale bar: 80 μm. (D) Response traces obtained for stimulation with odorants and electric shock in DANs and KCs in γ1, γ2, γ5, and β'2. Traces are normalized to the strongest response amplitude induced by the first BUT (CS) presentation in any region of interest, and show the median and quartiles over all flies in the unpaired group [number of flies (n) is indicated in the figure]. (E) Maximum response obtained for stimulation with odorants and electric shock in DANs and KCs in nine compartments. All curves represent the mean and SEM, n = 2–23.
Figure 3
Figure 3
Dopaminergic neurons are more sensitive to the electric shock strength than KCs. (A) Electric circuit for monitoring the current flow through the fly during electric shock application. The voltage generator provided constant 90 V pulses. The current flow through the fly (Ifly) was determined by measuring with an oscilloscope (R = 150 kΩ) the voltage (Udef) over a defined resistor (Rdef = 29 MΩ). (B) Relationship between electric shock-induced responses in DANs and individual current flow. Responses correlated with current in all four compartments in DANs (red regression line). Results of a Spearman rank correlation test and the number of flies (n) are indicated in the figure. (C) Same analysis as in B, but for KCs. Responses in KCs were small as compared to DANs, nevertheless responses correlated with current in β'2. For all analyzed regions see Supplementary Table 2.
Figure 4
Figure 4
CS-induced responses change during training in a compartment-specific manner in DANs and KCs. (A) Normalized DAN and KC response traces obtained for stimulations with the CS for γ1, γ2, γ5, and β'2 in the paired (red) and the unpaired (black) group, before and after training. Top: during pre-training the responses to the CS did not differ between the paired and the unpaired group. Middle: Post-training, in DANs in all four compartments the response to the CS was stronger in the paired than in the unpaired group. In KCs, in β'2 the response to the CS was weaker in the paired than in the unpaired group. Bottom: difference in response traces between post- and pre-training. Positive values reflect an increase, negative values a decrease in response strength after training. Traces represent the median and quartiles [number of flies (n) is indicated in the figure]. The bar code above the traces indicates the p-value obtained for each frame from a Wilcoxon test between paired and unpaired group (black: p ≥ 0.05, dark gray: p < 0.05, light gray: p < 0.01, white: p < 0.001). All traces of the paired group are shown in Supplementary Figures 1, 2. (B) CS-induced response strength in DANs and KCs during the six training trials and the post-training. The pre-training response strength to the CS or the control odorant was subtracted from each value. DANs: During training the CS-induced response strength increased in the paired group relative to the unpaired group in all four compartments (p-values are indicated in the figure; mixed-effect model for repeated-measures ANOVA). Post-training the response strength induced by the CS was higher in the paired than in the unpaired group in all four compartments. The response strength induced by the control odorant (blue background) did not differ between the paired and unpaired group (Supplementary Figure 3A). KCs: During training the CS-induced response strength decreased in the paired group relative to the unpaired group in β'2, but not in the other three compartments. Post-training the CS-induced response strength was lower in the paired than in the unpaired group in β'2 only. The response strength induced by the control odorant (blue background) did not differ between the paired and unpaired group (Supplementary Figure 3B). (C) US-induced response strength in DANs and KCs during the six training trials and the post-training. The first US-induced response strength was subtracted from each value. In both, DANs and KCs, US-induced responses did not differ between the paired and the unpaired groups. All values represent the mean and SEM. For all analyzed regions see Supplementary Figures 3A,B. Note, that both the paired and unpaired protocol comprise six CS (and six US) presentations. However, in the unpaired group, we recorded DAN and KC activity only during three CS and three US, in order to keep the total imaging exposure times (and thus bleaching) for the paired and the unpaired groups equal. For statistics we used only those trials which have been recorded in both the paired and unpaired group.
Figure 5
Figure 5
Odor—shock conditioning affects CS-induced spatial activity patterns in DANs. (A) Single animal examples showing color-coded images of responses induced during conditioning in single TH>GCaMP3 flies of the paired and unpaired group. Gray squares indicate non-availability of data due to the experimental protocol. Scale bar: 80 μm. (B) Dissimilarity of spatial activity patterns in DANs was quantified as the angle between vectors that comprise the response strengths of all nine compartments. CS vs. 1st CS: during training the CS-induced spatial activity patterns became dissimilar to the pre-training spatial activity pattern. This effect was stronger in the unpaired (red) than in the paired group (black). US vs. 1st US: during training the US-induced spatial activity patterns became dissimilar to the first US-induced spatial activity pattern in the paired and unpaired group, however, there was no difference between the paired and the unpaired group. CS vs. mean US: during training the CS-induced spatial activity patterns became dissimilar to the mean US-induced activity pattern in the unpaired group, but not in the paired group. All traces represent the mean and SEM [p-values and number of flies (n) are indicated in the figure; mixed-effect model for repeated-measures ANOVA]. See Supplementary Figure 6 for KC data and for a pattern analysis with Euclidean distances.
Figure 6
Figure 6
Summary of associative effects of odor—shock conditioning in DANs and KCs. (A) Values and color code show the difference in response strength to the CS between the paired and unpaired group for the different MB compartments and other regions innervated by either DANs (top), or KCs and IPCs (bottom; differences were calculated on the post-training response strength plotted in Figure 4B and Supplementary Figures 3A,B). Associative effects were defined as significant difference between the paired and the unpaired group (statistical significances are indicated below each table). In DANs, odor—shock conditioning induced an associative increase in the response to the CS in most compartments. In KCs, odor—shock conditioning induced an associative decrease in the response to the CS in three compartments (n = 2–24; mixed-effect model for repeated-measures ANOVA). Non-availability of data is indicated by gray. (B) Hypothetic circuit model of associative plasticity induced by odor—shock trace conditioning in β'- and γ-compartments. KC axons (green) traverse a compartment (gray) of either the β'- or γ-lobe. Each compartment is innervated by compartment-specific DANs (red) and mushroom body output neurons (MBONs; black). During trace conditioning, odor—induced KC and shock-induced DAN activity induce postsynaptic potentiation at the KC-to-DAN synapse, and induce synaptic depression in β'-KCs, but not in γ-KCs.

References

    1. Adams M. D., Celniker S. E., Holt R. A., Evans C. A., Gocayne J. D., Amanatides P. G., et al. (2000). The genome sequence of Drosophila Melanogaster. Science 287, 2185–2195. 10.1126/science.287.5461.2185 - DOI - PubMed
    1. Akalal D. B. G., Yu D., Davis R. L. (2010). A late-phase, long-term memory trace forms in the γ neurons of Drosophila mushroom bodies after olfactory classical conditioning. J. Neurosci. 30, 16699–16708. 10.1523/JNEUROSCI.1882-10.2010 - DOI - PMC - PubMed
    1. Akalal D. B. G., Yu D., Davis R. L. (2011). The long-term memory trace formed in the Drosophila α/β mushroom body neurons is abolished in long-term memory mutants. J. Neurosci. 31, 5643–5647. 10.1523/JNEUROSCI.3190-10.2011 - DOI - PMC - PubMed
    1. Alekseyenko O. V., Chan Y. B., Li R., Kravitz E. A. (2013). Single dopaminergic neurons that modulate aggression in Drosophila. Proc. Natl. Acad. Sci. U.S.A. 110, 6151–6156. 10.1073/pnas.1303446110 - DOI - PMC - PubMed
    1. Aso Y., Rubin G. M. (2016). Dopaminergic neurons write and update memories with cell-type-specific rules. Elife 5, 1–15. 10.7554/eLife.16135 - DOI - PMC - PubMed

Publication types

LinkOut - more resources