. 2017 Jun 20:7:269.
doi: 10.3389/fcimb.2017.00269. eCollection 2017.

In-Cell Western Assays to Evaluate Hantaan Virus Replication as a Novel Approach to Screen Antiviral Molecules and Detect Neutralizing Antibody Titers

Affiliations

In-Cell Western Assays to Evaluate Hantaan Virus Replication as a Novel Approach to Screen Antiviral Molecules and Detect Neutralizing Antibody Titers

Hong-Wei Ma et al. Front Cell Infect Microbiol. .

Abstract

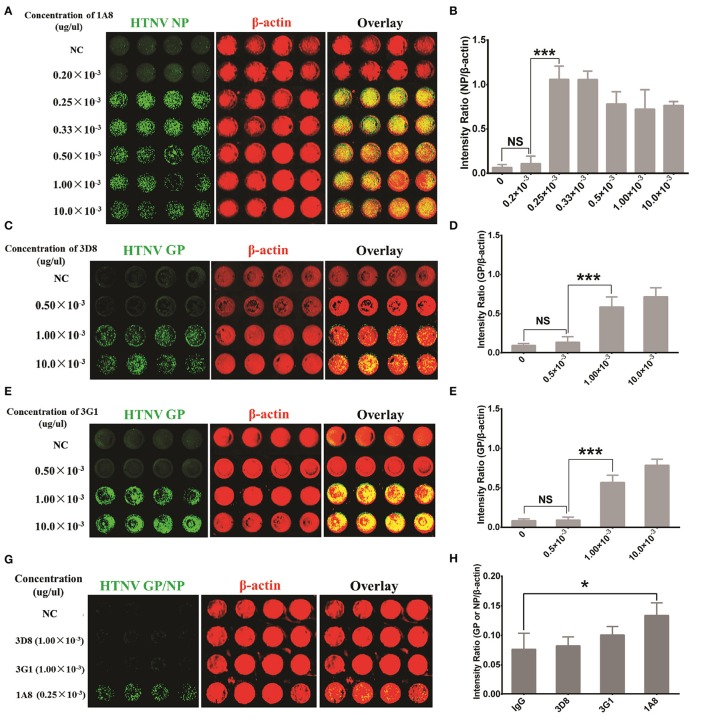
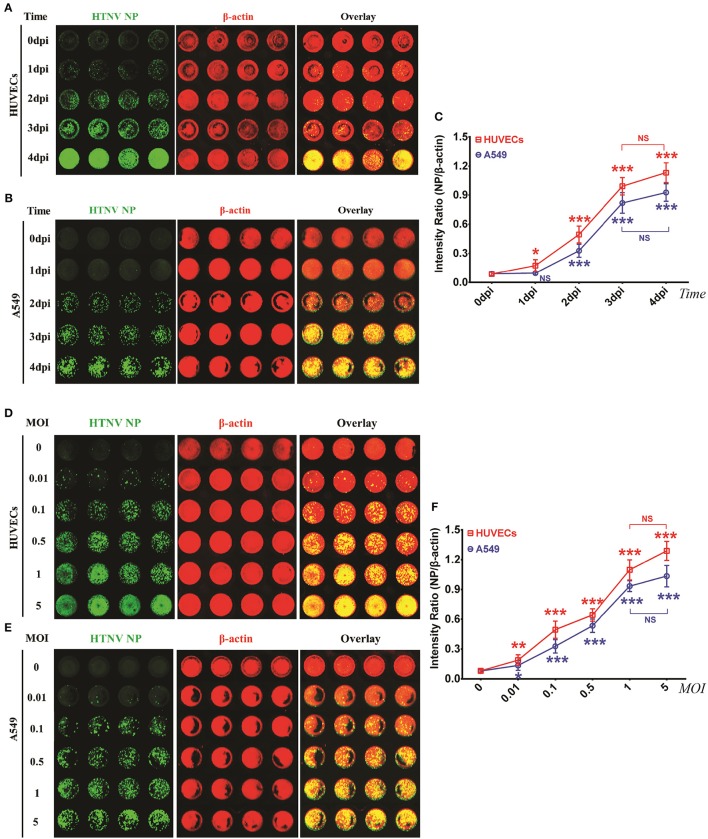
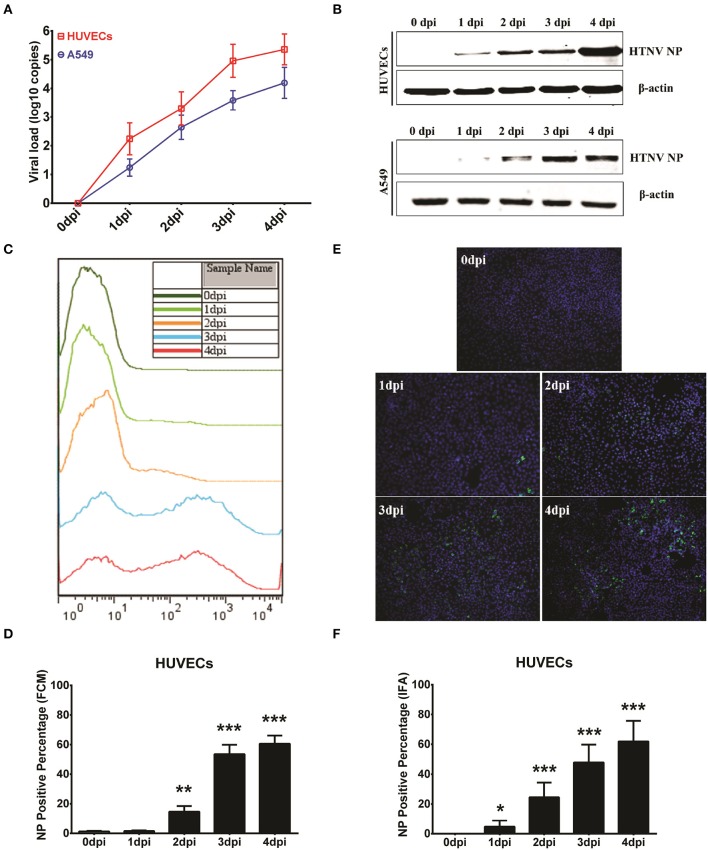
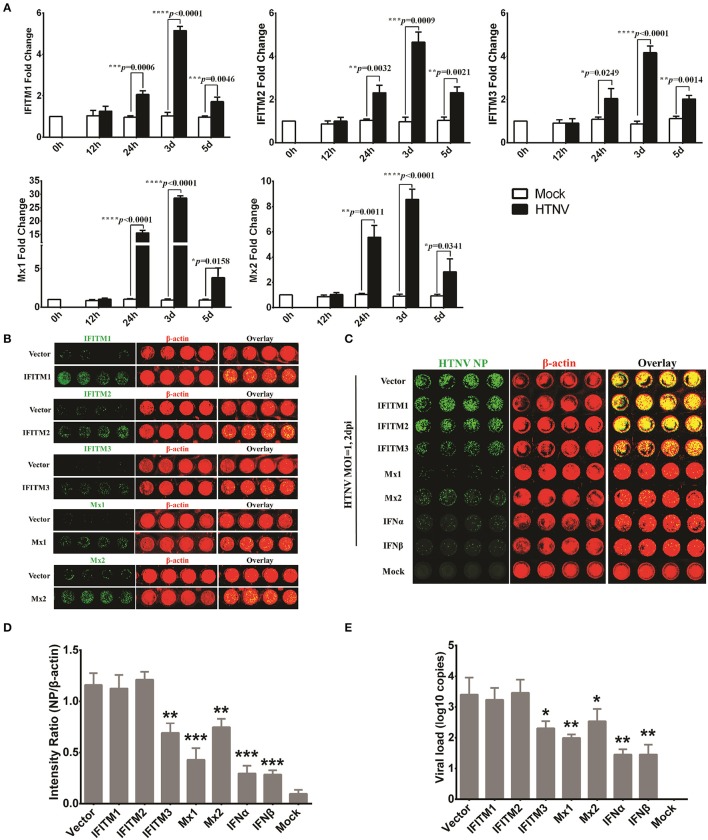
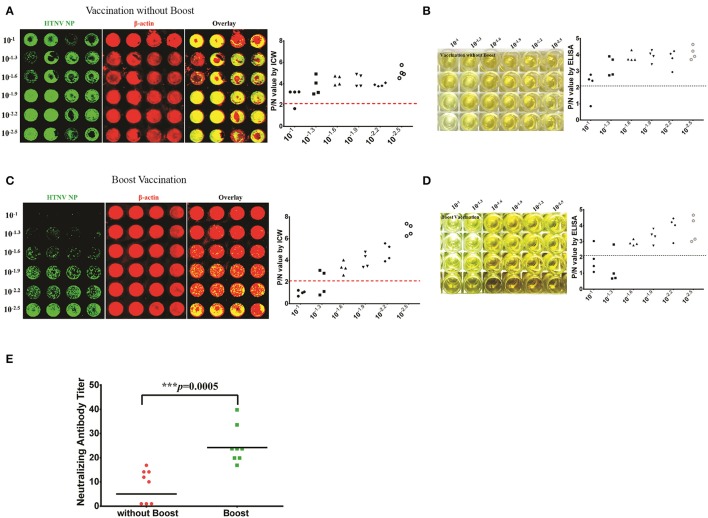
Hantaviruses encompass rodent-borne zoonotic pathogens that cause severe hemorrhagic fever disease with high mortality rates in humans. Detection of infectious virus titer lays a solid foundation for virology and immunology researches. Canonical methods to assess viral titers rely on visible cytopathic effects (CPE), but Hantaan virus (HTNV, the prototype hantavirus) maintains a relatively sluggish life cycle and does not produce CPE in cell culture. Here, an in-cell Western (ICW) assay was utilized to rapidly measure the expression of viral proteins in infected cells and to establish a novel approach to detect viral titers. Compared with classical approaches, the ICW assay is accurate and time- and cost-effective. Furthermore, the ICW assay provided a high-throughput platform to screen and identify antiviral molecules. Potential antiviral roles of several DExD/H box helicase family members were investigated using the ICW assay, and the results indicated that DDX21 and DDX60 reinforced IFN responses and exerted anti-hantaviral effects, whereas DDX50 probably promoted HTNV replication. Additionally, the ICW assay was also applied to assess NAb titers in patients and vaccine recipients. Patients with prompt production of NAbs tended to have favorable disease outcomes. Modest NAb titers were found in vaccinees, indicating that current vaccines still require improvements as they cannot prime host humoral immunity with high efficiency. Taken together, our results indicate that the use of the ICW assay to evaluate non-CPE Hantaan virus titer demonstrates a significant improvement over current infectivity approaches and a novel technique to screen antiviral molecules and detect NAb efficacies.

Keywords: DDX21; DDX60; disease severity; hantaan virus; in-cell western assays; interferon; neutralizing antibody.


Figures

Figure 1
Figure 1
Antibody selection for HTNV NP detection with sensitivity and rapidity. HUVECs grown in 96-well microplates until they reached 60–70% confluency were infected with HTNV at an MOI of 1. The cells were fixed and evaluated with the ICW assay at 3 days post-infection (A–F) or 1 day post-infection (G,H). (A,B) Mouse MAb 1A8 (1 μg/μl) were serially diluted to a final concentration of 10.0 × 10⁻³ (1:100 dilution), 1.00 × 10⁻³ (1:1,000 dilution), 0.50 × 10⁻³ (1:2,000 dilution), 0.33 × 10⁻³ (1:3,000 dilution), 0.25 × 10⁻³ (1:4,000 dilution) and 0.20 × 10⁻³ (1:5,000 dilution) (μg/μl). Sp2/0-derived mouse ascitic fluid was used as the negative control (NC). Different concentrations of 1A8 were applied in the ICW assay for HTNV NP detection. The scanned imaging results (A) and the intensity ratio (NP/β-actin) (B) are presented. (C,D) Serial dilutions of 3D8 targeting HTNV GP were applied in the ICW assay. The scanned imaging results (C) and the intensity ratio (GP/β-actin) (D) are presented. (E,F) Serial dilutions of 3G1 targeting HTNV GP were applied in the ICW assay. The scanned imaging results (C) and the intensity ratio (GP/β-actin) (D) are presented. (G,H) 3D8 (1.00 × 10⁻³ μg/μl), 3G1 (1.00 × 10⁻³ μg/μl) and 1A8 (0.25 × 10⁻³ μg/μl) were used in the ICW assay at 1 dpi, with Sp2/0-derived mouse ascitic fluid as the NC. The scanned imaging results (G) and the intensity ratio (GP or NP/β-actin) (H) are presented. Data are presented as the mean ± SD. *P < 0.05, ***P < 0.001 by Student's t-test. The experiments were performed independently at least three times with similar results.
Figure 2
Figure 2
HTNV NP expression was increased in a time- and dose- depended manner in HUVECs and A549 cells within limits (A–C) HUVECs (A) and A549 cells (B) grown in 96-well microplates until they reached 60–70% confluence were mock infected or infected with HTNV at an MOI of 0.1 and then fixed at 0 dpi, 1 dpi, 2 dpi, 3 dpi, and 4 dpi. The ICW assay was performed with 1A8 (0.25 × 10⁻³ μg/μl) to assess HTNV NP expression. The scanned imaging results (A for HUVECs and B for A549 cells) and the intensity ratio (NP/β-actin) (C) are presented. All of the following experiments were performed with 1A8 (0.25 × 10⁻³ μg/μl) in the ICW assay to assess the amount of HTNV NP. (D–F) HUVECs (D) and A549 cells (E) grown in 96-well microplates until they reached 60–70% confluency were mock infected or infected with HTNV at incremental MOIs from 0 to 5, followed by the ICW assay performed at 2 dpi. The scanned imaging results (E for HUVECs and F for A549 cells) and the intensity ratio (NP/β-actin) (G) are presented. Data are presented as the mean ± SD. Differences among groups were determined by one-way analysis of variance (ANOVA) with repeated measures, followed by Bonferroni's post-hoc test. *P < 0.05, **P < 0.01, ***P < 0.001 vs. 0 dpi (time) or 0.01 (MOI). The experiments were performed independently at least three times with similar results.
Figure 3
Figure 3
Performance comparison of the ICW assay with conventional assays. HUVECs and A549 cells grown in 6-well plate until they reached 60–70% confluence were mock infected or infected with HTNV at an MOI of 0.1 and then harvested at 0 dpi, 1 dpi, 2 dpi, 3 dpi, and 4 dpi for qRT-PCR to detect the HTNV S segment. These samples were used to calculate the viral loads (A) or for Western blotting to measure HTNV NP expression (B). HUVECs infected at an MOI of 0.1 also underwent flow cytometry analysis (C,D) or an immunofluorescence assay (E,F) at the indicated time points post-HTNV infection. Data are presented as the mean ± SD. *P < 0.05, **P < 0.01, ***P < 0.001 vs. 0 dpi by Student's t-test. The experiments were performed independently at least three times with similar results.
Figure 4
Figure 4
Application of the ICW assay to detect the HTNV titers HUVECs were seeded into ten 96-well microplates of different brands (Falcon™ for microplates numbered 1–5 and Nunc™ numbered 6–10) and were mock infected (negative control, NC) or infected with HTNV at an MOI of 0.1 (positive control, PC). The ICW assay was performed to observe and calculate the amount of HTNV NP production (A and C for the NC group and B and D for the PC group). The P/N value was determined by setting the intensity ratio from the number 1 microplate as the calibrator (E). HTNV propagated in Vero E6 cells was serially diluted from 1:10 to 1:106 and used to infect A549 cells (F) or E6 cells (H) in 96-well microplates. A549 cells were acquired for the ICW assay at 2 dpi (F), and E6 cells were collected for ELISA at 10 dpi (H). The P/N value was calculated by ICW (G) and ELISA (I), and the viral titer was determined by TCID50 with the Reed and Muench formula. HTNV was propagated in mouse brains in five independent experiments and propagated in Vero E6 cells. The ten batches of HTNV were used for titer assessment by both ICW and ELISA. The relationship between the ICW-derived and ELISA-derived titers was analyzed using the rank correlation test (J). Data are presented as the mean ± SD.
Figure 5
Figure 5
Application of the ICW assay to screen antiviral molecules or drugs. (A) HTNV-infected HUVECs (MOI of 1) were lysed with RNAiso at 0 h, 12 h, 24 h, 3 d, and 5 d post-infection, and the IFITM1, IFITM2, IFITM3, Mx1, and Mx2 expression levels were determined by qRT-PCR. (B) HUVECs transduced to express IFITM1, IFITM2, IFITM3, Mx1, and Mx2 were fixed at 3 d post-infection with the relevant lentiviruses, followed by the ICW assay to assess the overexpression of related genes. (C–E) HUVECs ectopically expressing IFITM1, IFITM2, IFITM3, Mx1, and Mx2 or pretreated with IFNα or IFNβ (2 ng/ml) were infected with HTNV at an MOI of 0.1. At 2 days post-infection, NP expression was measured by the ICW assay (C,D), and the viral load reflected by HTNV S segment transcription was determined by qRT-PCR (E). Data are presented as the mean ± SD. *P < 0.05, **P < 0.01, ***P < 0.001 vs. mock (A) or vector (D,E) by Student's t-test. The experiments were performed independently at least three times with similar results.
Figure 6
Figure 6
Significant gene ontology (GO) and pathway enrichment analyses of the HUVEC DGE results. Significant alterations of cellular components from the GO analysis. Significant alterations of biological processes from the GO analysis. Significant alterations of molecular functions from the GO analysis. Significant alterations of pathways based on the KEGG analysis. Enriched pathway genes from the DGE results.
Figure 7
Figure 7
DDX21 and DDX60 were identified as important anti-hantaviral molecules that could positively regulate IFN responses after HTNV infection. (A) Differentially expressed DExD/H box helicases after HTNV infection shown by heat map from DGE analysis. (B) The altered expression levels of DDX3, DDX5, DDX6, DDX21, DDX50, and DDX60 at the different time intervals post-HTNV infection in HUVECs as determined by qRT-PCR (n = 3). *P < 0.05, **P < 0.01, ***P < 0.001 vs. mock by Student's t-test. (C) The overexpression efficiency of DDX3, DDX5, DDX6, DDX21, DDX50, and DDX60 in HUVECs was detected by observing the inflorescence of ZsGreen at 2 days post-infection with the related lentivirus. (D,E) HUVECs ectopically expressing control plasmids, DDX3, DDX5, DDX6, DDX21, DDX50, and DDX60 were mock infected or infected with HTNV at an MOI of 0.1 and then fixed at 2 dpi for the ICW assay to screen antiviral molecules. Imaging results (D) and the intensity ratio analyzed by software (E) are presented. *P < 0.05, **P < 0.01, ***P < 0.001 vs. vector by Student's t-test. (F) The viral loads of HUVECs with the identical treatment described in (D) were assessed by qRT-PCR (n = 3). *P < 0.05, **P < 0.01, ***P < 0.001 vs. vector by Student's t-test. (G,H) Vero E6 cells ectopically expressing control plasmids, DDX3, DDX21, and DDX60 or pretreated with IFN-β (2 ng/ml) were mock infected or infected with HTNV at an MOI of 0.1 and then fixed at 2 dpi for the ICW assay to screen antiviral molecules. Imaging results (G) and the intensity ratio analyzed by software (H) are presented. (I) Viral loads in E6 cells with the identical treatment described in (G) were assessed by qRT-PCR (n = 3). (J and K) Dual-luciferase assays of IFN-β promoter activation following HTNV infection of HUVECs. HUVECs ectopically expressing control plasmids, DDX3, DDX21, and DDX60 were transfected with 100 ng of pGL3 basic or the reporter plasmid for the IFN-β promoter (pIFΔ (−116) lucter) together with 10 ng of the pRL-TK Renilla luciferase reporter. Twenty-four hours after transfection, the HUVECs were not challenged (J) or were challenged (K) with HTNV at an MOI of 0.1 for 1 h at 37°C. Luciferase assays were performed 24 h after infection, and the results were expressed as the comparative ratio of firefly luciferase to Renilla luciferase activity compared to the untreated group. *P < 0.05, **P < 0.01, ***P < 0.001 vs. vector by Student's t-test. The experiments were performed independently at least three times with similar results.
Figure 8
Figure 8
NAb titers detected by the ICW assay in patients indicated that NAbs were correlated with the HFRS disease course and severity (A,B) The NAb titers of 3D8 were determined in the ICW assay (A) and ELISA (B). (C,D) The NAb titers of 3G1 were determined in the ICW assay (C) and ELISA (D). (E) The relationship between ICW-derived and ELISA-derived NAb titers were analyzed by the rank correlation test. P < 0.05 were considered significant. (F) NAb titers of patients in different stages of HFRS were assessed using the ICW assay. Febrile (n = 8), hypotensive (n = 8), oliguric (n = 16), diuretic (n = 16), and convalescent (n = 16) patients were included. Data are presented as the geometric mean ± 95% CI. (G) The difference in NAb titers between the mild/severe and severe/critical groups at different disease stages is shown. Data are presented as the geometric mean ± 95% CI. *P < 0.05, **P < 0.01, ***P < 0.001 by Student's t-test. (H,J) Associations of the NAb titers in the oliguric stage (16 samples) with the viral load (H), peak creatinine level (I) and peak white blood cell count (J) were analyzed by the rank correlation test. P < 0.05 were considered significant.
Figure 9
Figure 9
Efficacy evaluation of inactive HTNV vaccines by detecting NAb titers with ICW (A,B) The NAb titers of vaccinees without boost (two primary doses, n = 8) were determined by the ICW assay (A) and ELISA (B). (C,D) The NAb titers of vaccinees in the boost group (two primary doses, n = 8) were determined by the ICW assay (C) and ELISA (D). (E) The NAb titers of vaccinees with different vaccination strategies were assessed using the ICW assay. Notably, three individuals exhibited no production of NAbs; the NAb titers of these patients were presented as 1 to calculate the geometric mean value. Data are presented as the geometric mean ± 95% CI. *P < 0.05, **P < 0.01, ***P < 0.001 by Student's t-test.

Similar articles

Cited by

References

    1. Ahmad S., Hur S. (2015). Helicases in antiviral immunity: dual properties as sensors and effectors. Trends Biochem. Sci. 40, 576–585. 10.1016/j.tibs.2015.08.001 - DOI - PMC - PubMed
    1. Barriga G. P., Martinez-Valdebenito C., Galeno H., Ferres M., Lozach P. Y., Tischler N. D. (2013). A rapid method for infectivity titration of Andes hantavirus using flow cytometry. J. Virol. Methods 193, 291–294. 10.1016/j.jviromet.2013.06.022 - DOI - PubMed
    1. Boveia V., Schutz-Geschwender A. (2015). Quantitative analysis of signal transduction with in-cell western immunofluorescence assays. Methods Mol. Biol. 1314, 115–130. 10.1007/978-1-4939-2718-0_13 - DOI - PubMed
    1. Brai A., Fazi R., Tintori C., Zamperini C., Bugli F., Sanguinetti M., et al. . (2016). Human DDX3 protein is a valuable target to develop broad spectrum antiviral agents. Proc. Natl. Acad. Sci. U.S.A. 113, 5388–5393. 10.1073/pnas.1522987113 - DOI - PMC - PubMed
    1. Chahar H. S., Chen S., Manjunath N. (2013). P-body components LSM1, GW182, DDX3, DDX6 and XRN1 are recruited to WNV replication sites and positively regulate viral replication. Virology 436, 1–7. 10.1016/j.virol.2012.09.041 - DOI - PMC - PubMed

MeSH terms