

Nerve growth factor regulation and production by macrophages in osteoarthritic synovium
- PMID: 28677145
- PMCID: PMC5629442
- DOI: 10.1111/cei.13007
Nerve growth factor regulation and production by macrophages in osteoarthritic synovium
Abstract
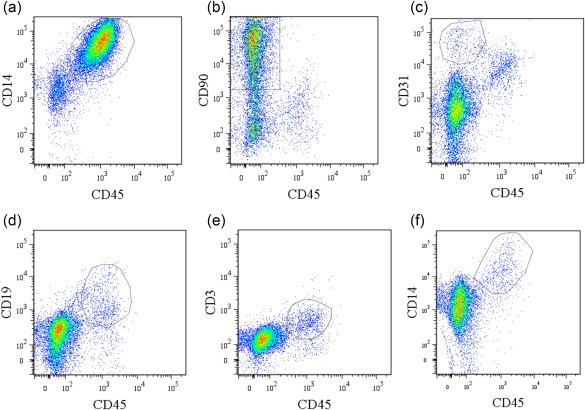
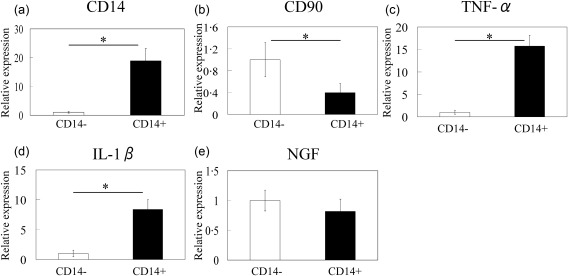
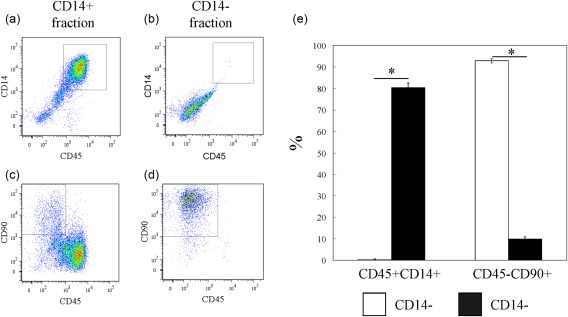
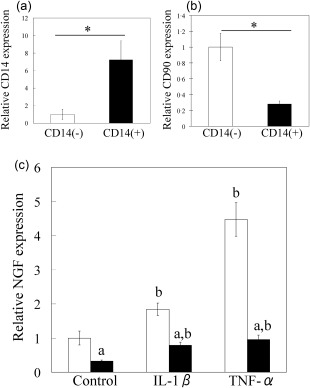
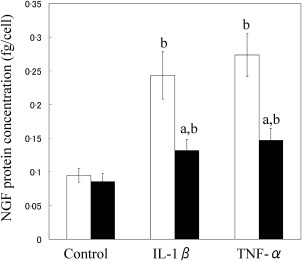
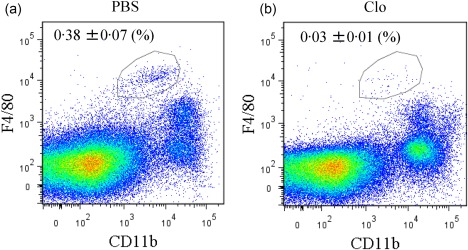
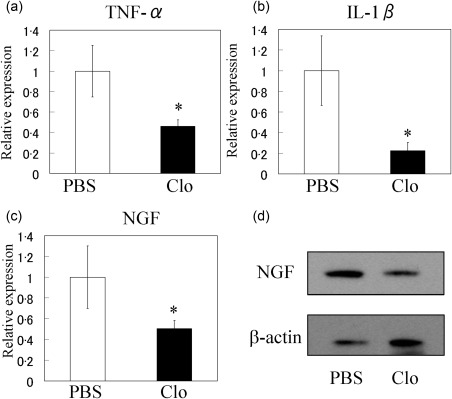
Nerve growth factor (NGF) functions to modulate osteoarthritis (OA)-associated pain. Although recent studies suggest that tumour necrosis factor (TNF)-α and interleukin (IL)-1β mediate NGF activity in human synovial fibroblasts, the regulation of NGF expression in human synovial macrophages remains unclear. Here, we examined the role of macrophages in the production and regulation of synovial (SYN) NGF in osteoarthritic knee joints by examining the mRNA expression of TNF-α and IL-1β in freshly isolated CD14-positive (macrophage-rich fraction) and CD14-negative cells (fibroblast-rich fraction) in synovial tissue from OA patients by quantitative polymerase chain reaction. We also examined the effects of IL-1β and TNF-α on NGF mRNA expression in cultured CD14-positive (macrophage-rich fraction) and CD14-negative cells (fibroblast-rich fraction). In addition, to examine the contribution of macrophages to NGF, TNF-α and IL-1β expression, we injected clodronate liposomes systemically into STR/Ort mice, an osteoarthritis animal model, to deplete macrophages. TNF-α and IL-1β mRNA levels in CD14-positive cells from the SYN of OA patients was significantly higher than that in CD14-negative cells, while NGF expression did not differ markedly between the two cell fractions. In addition, treatment of human cultured CD14-positive and -negative cells with IL-1β and TNF-α enhanced NGF mRNA and protein levels. Expression of NGF, IL-1β and TNF-α was also reduced significantly in STR/Ort mice upon macrophage depletion. These findings suggest that IL-1β and TNF-α regulate NGF expression and production in synovial macrophages and fibroblasts in osteoarthritic joints.
Keywords: macrophage; nerve growth factor; osteoarthritis; synovium.
© 2017 British Society for Immunology.
Figures
Similar articles
-
Nerve Growth Factor Regulation by TNF-α and IL-1β in Synovial Macrophages and Fibroblasts in Osteoarthritic Mice.J Immunol Res. 2016;2016:5706359. doi: 10.1155/2016/5706359. Epub 2016 Aug 18. J Immunol Res. 2016. PMID: 27635406 Free PMC article.
-
Synovial macrophage-derived IL-1β regulates the calcitonin receptor in osteoarthritic mice.Clin Exp Immunol. 2016 Jan;183(1):143-9. doi: 10.1111/cei.12712. Epub 2015 Oct 28. Clin Exp Immunol. 2016. PMID: 26400621 Free PMC article.
-
The role of synovial macrophages and macrophage-produced cytokines in driving aggrecanases, matrix metalloproteinases, and other destructive and inflammatory responses in osteoarthritis.Arthritis Res Ther. 2006;8(6):R187. doi: 10.1186/ar2099. Arthritis Res Ther. 2006. PMID: 17177994 Free PMC article.
-
The role of cytokines in osteoarthritis pathophysiology.Biorheology. 2002;39(1-2):237-46. Biorheology. 2002. PMID: 12082286 Review.
-
Neuroprotection effect of bovine umbilical mesenchymal stem cell-conditioned medium on the rat model of Alzheimer's disease mediated by upregulation of BDNF and NGF and downregulation of TNF-α and IL-1β.Open Vet J. 2025 Jan;15(1):151-161. doi: 10.5455/OVJ.2025.v15.i1.14. Epub 2025 Jan 31. Open Vet J. 2025. PMID: 40092207 Free PMC article. Review.
Cited by
-
Select Biomarkers on the Day of Anterior Cruciate Ligament Reconstruction Predict Poor Patient-Reported Outcomes at 2-Year Follow-Up: A Pilot Study.Biomed Res Int. 2018 Jul 19;2018:9387809. doi: 10.1155/2018/9387809. eCollection 2018. Biomed Res Int. 2018. PMID: 30105266 Free PMC article. Clinical Trial.
-
Nerve Growth Factor and Pathogenesis of Leprosy: Review and Update.Front Immunol. 2018 May 7;9:939. doi: 10.3389/fimmu.2018.00939. eCollection 2018. Front Immunol. 2018. PMID: 29867937 Free PMC article. Review.
-
Spatio-temporal expression profile of NGF and the two-receptor system, TrkA and p75NTR, in experimental autoimmune encephalomyelitis.J Neuroinflammation. 2020 Jan 29;17(1):41. doi: 10.1186/s12974-020-1708-9. J Neuroinflammation. 2020. PMID: 31996225 Free PMC article.
-
Innate Immunity and Synovitis: Key Players in Osteoarthritis Progression.Int J Mol Sci. 2024 Nov 11;25(22):12082. doi: 10.3390/ijms252212082. Int J Mol Sci. 2024. PMID: 39596150 Free PMC article. Review.
-
Macrophage polarization in osteoarthritis progression: a promising therapeutic target.Front Cell Dev Biol. 2023 Oct 26;11:1269724. doi: 10.3389/fcell.2023.1269724. eCollection 2023. Front Cell Dev Biol. 2023. PMID: 37954210 Free PMC article. Review.
References
-
- Dillon CF, Rasch EK, Gu Q, Hirsch R. Prevalence of knee osteoarthritis in the United States: arthritis data from the Third National Health and Nutrition Examination Survey 1991–94. J Rheumatol 2006; 33:2271–9. - PubMed
-
- Zhang W, Moskowitz RW, Nuki G et al OARSI recommendations for the management of hip and knee osteoarthritis, Part II: OARSI evidence‐based, expert consensus guidelines. Osteoarthritis Cartilage 2008; 16:137–62. - PubMed
-
- Johnsen SP, Larsson H, Tarone RE et al Risk of hospitalization for myocardial infarction among users of rofecoxib, celecoxib, and other NSAIDs: a population‐based case–control study. Arch Intern Med 2005; 165:978–84. - PubMed
-
- Whelton A. Renal and related cardiovascular effects of conventional and COX‐2‐specific NSAIDs and non‐NSAID analgesics. Am J Ther 2000; 7:63–74. - PubMed
Publication types
MeSH terms
Substances
LinkOut - more resources
Full Text Sources
Other Literature Sources
Medical
Molecular Biology Databases
Research Materials
Miscellaneous
