. 2017 Aug;28(8):1180-1188.
doi: 10.1177/0956797617705391. Epub 2017 Jul 5.

Illusory Increases in Font Size Improve Letter Recognition

Affiliations

Illusory Increases in Font Size Improve Letter Recognition

Martin Lages et al. Psychol Sci. 2017 Aug.

Abstract

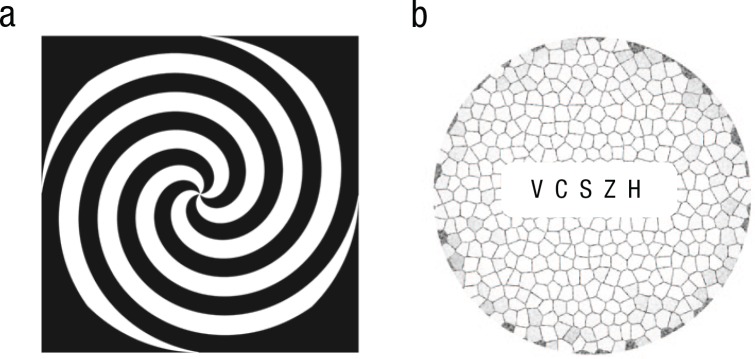
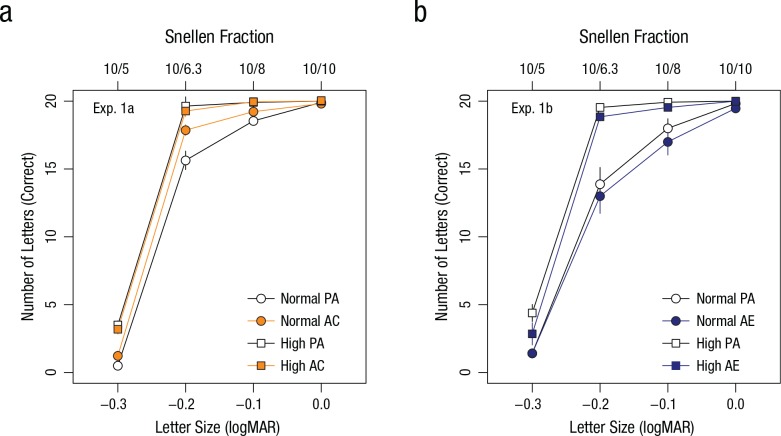
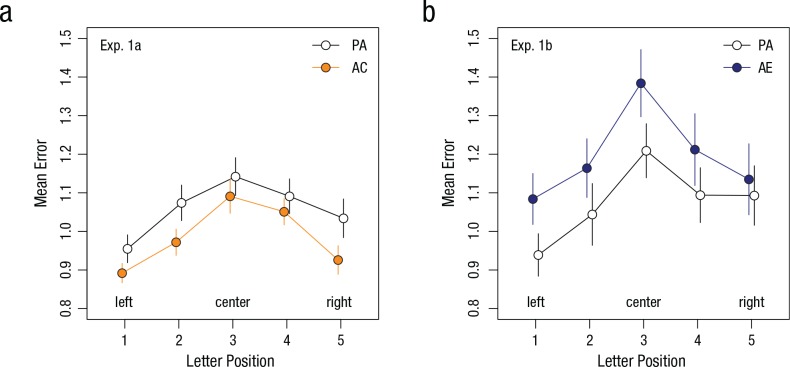
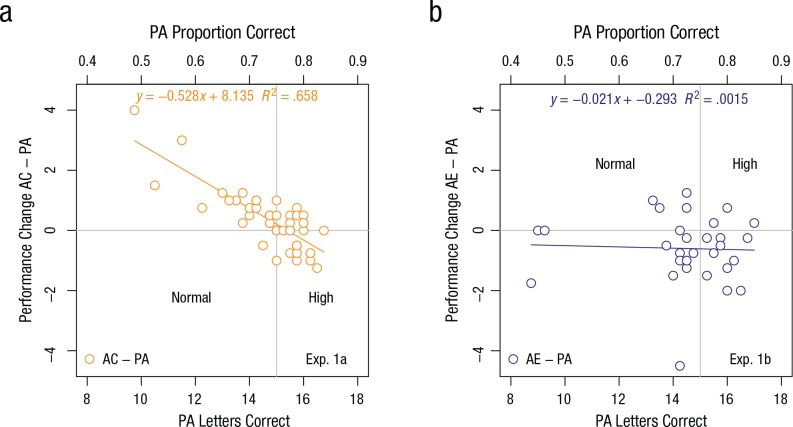
Visual performance of human observers depends not only on the optics of the eye and early sensory encoding but also on subsequent cortical processing and representations. In two experiments, we demonstrated that motion adaptation can enhance as well as impair visual acuity. Observers who experienced an expanding motion aftereffect exhibited improved letter recognition, whereas observers who experienced a contracting motion aftereffect showed impaired letter recognition. We conclude that illusory enlargement and shrinkage of a visual stimulus can modulate visual acuity.

Keywords: motion aftereffect; object recognition; open data; size illusion; visual acuity.


Conflict of interest statement

Declaration of Conflicting Interests: The authors declared that they had no conflicts of interest with respect to their authorship or the publication of this article.

Figures

Fig. 1.
Fig. 1.
Illustration of (a) a linear spiral with high-contrast segments, a moving version of which was presented in the adaptation phase, and (b) an example test stimulus consisting of five Sloan letters surrounded by a Voronoi pattern. In the adaptation phase, spirals rotated either clockwise (inducing adaptation to contracting motion) or counterclockwise (inducing adaptation to expanding motion). Sloan letters ranged in size from −0.3 to 0.0 on the logarithm-of-the-minimum-angle-of-resolution (logMAR) chart (Snellen fraction: 10/5–10/10) and were surrounded by a Voronoi pattern.
Fig. 2.
Fig. 2.
Results of (a) Experiment 1a and (b) Experiment 1b: mean number of correctly identified letters as a function of font size, separately for each combination of block and performance group (normal vs. high, based on a median split). Observers first completed a preadaptation (PA) block, followed by a block in which they either adapted to contracting motion (AC; Experiment 1a) or adapted to expanding motion (AE; Experiment 1b). Error bars denote ±1 SEM, and in some cases are smaller than the data points. logMAR = logarithm of the minimum angle of resolution.
Fig. 3.
Fig. 3.
Results of (a) Experiment 1a and (b) Experiment 1b: mean error as a function of letter position and block. Mean error was defined as the number of unrecognized letters averaged across font sizes and observers. Observers completed two blocks: preadaptation (PA) and either adaptation to contracting motion (AC; Experiment 1a) or adaptation to expanding motion (AE; Experiment 1b). Error bars denote ±1 SEM.
Fig. 4.
Fig. 4.
Results of (a) Experiment 1a and (b) Experiment 1b: scatterplots (with best-fitting regression lines) showing the relationship between preadaptation (PA) performance and change in performance between the PA block and the adaptation block. Observers adapted to either contracting motion (AC; Experiment 1a) or expanding motion (AE; Experiment 1b). In both plots, PA performance is expressed as both the mean number and the proportion of correctly identified letters. The vertical line splits observers into groups with normal and high PA visual acuity. The horizontal line separates observers with improved performance from observers with impaired performance.
Fig. 5.
Fig. 5.
Results of Experiment 2. The graph (a) shows the difference in letter-recognition thresholds between the preadaptation (PA) and adaptation blocks at each session, separately for observers who adapted to contracting motion (AC) first and observers who adapted to expanding motion (AE) first. Error bars denote ±1 SEM. The scatterplot (b; with best-fitting regression line) shows the relationship between the PA letter-recognition threshold and the threshold difference between the PA and adaptation blocks, separately for observers in the AC and AE groups. The vertical line splits observers into groups with normal and high PA visual acuity. The horizontal line separates observers with improved performance from observers with impaired performance.

Similar articles

Cited by

References

    1. Addams R. (1834). An account of a peculiar optical phenomenon seen after having looked at a moving body, etc. London and Edinburgh Philosophical Magazine and Journal of Science, 5, 373–374. doi:10.1080/14786443408648481 - DOI
    1. Anstis S., Verstraten F. A. J., Mather G. (1998). The motion aftereffect. Trends in Cognitive Sciences, 2, 111–117. doi:10.1016/S1364-6613(98)01142-5 - DOI - PubMed
    1. Anton-Erxleben K., Carrasco M. (2013). Attentional enhancement of spatial resolution: Linking behavior and neurophysiological evidence. Nature Reviews Neuroscience, 14, 188–200. doi:10.1038/nrn3443 - DOI - PMC - PubMed
    1. Anton-Erxleben K., Stephan V. M., Treue S. (2009). Attention reshapes center-surround receptive field structure in macaque cortical area MT. Cerebral Cortex, 19, 2466–2478. doi:10.1093/cercor/bhp002 - DOI - PMC - PubMed
    1. Arditi A., Cagenello R. (1993). On the statistical reliability of letter-chart visual acuity measurements. Investigative Ophthalmology & Visual Science, 34, 120–129. - PubMed