

Reduction of Asthmatic Parameters by Sea Hare Hydrolysates in a Mouse Model of Allergic Asthma
- PMID: 28678189
- PMCID: PMC5537814
- DOI: 10.3390/nu9070699
Reduction of Asthmatic Parameters by Sea Hare Hydrolysates in a Mouse Model of Allergic Asthma
Abstract
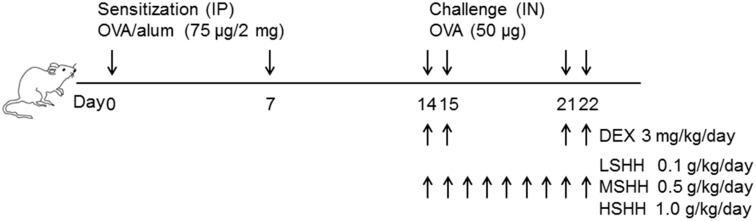
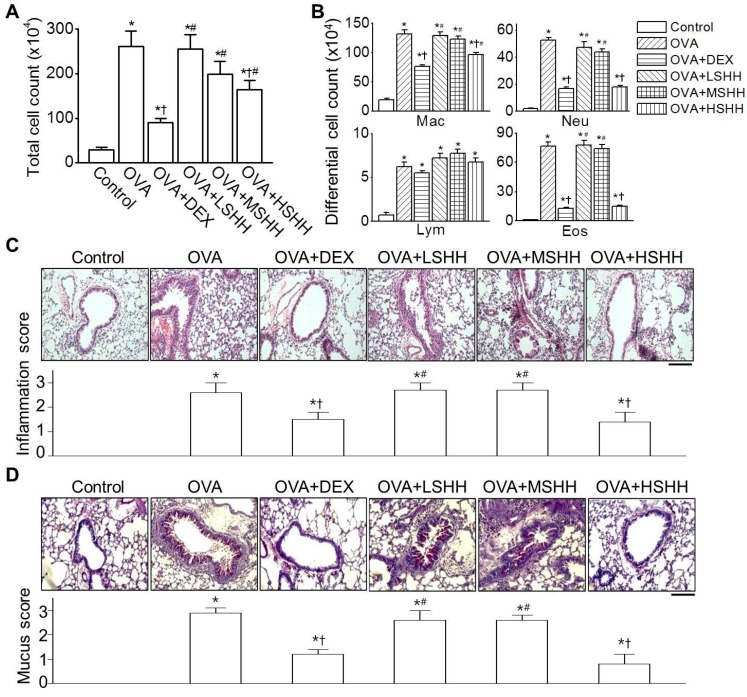
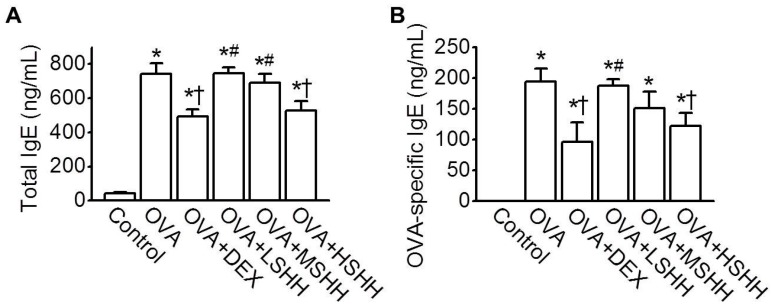
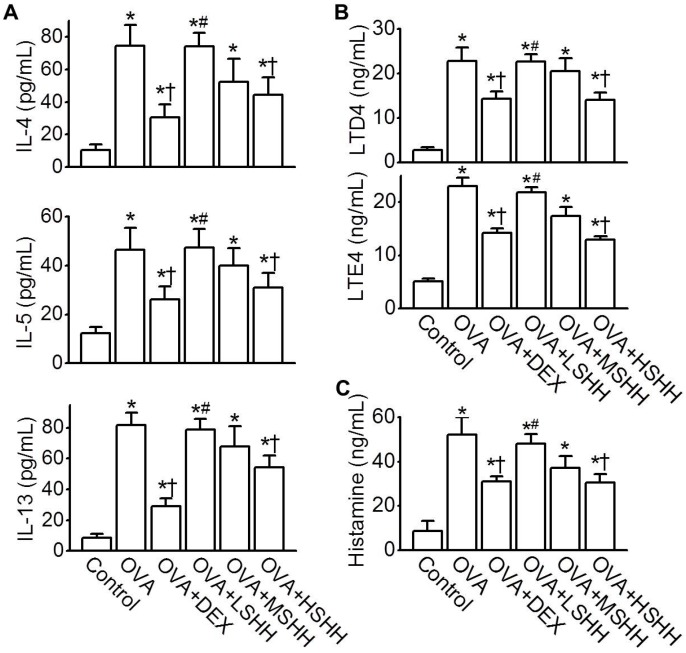
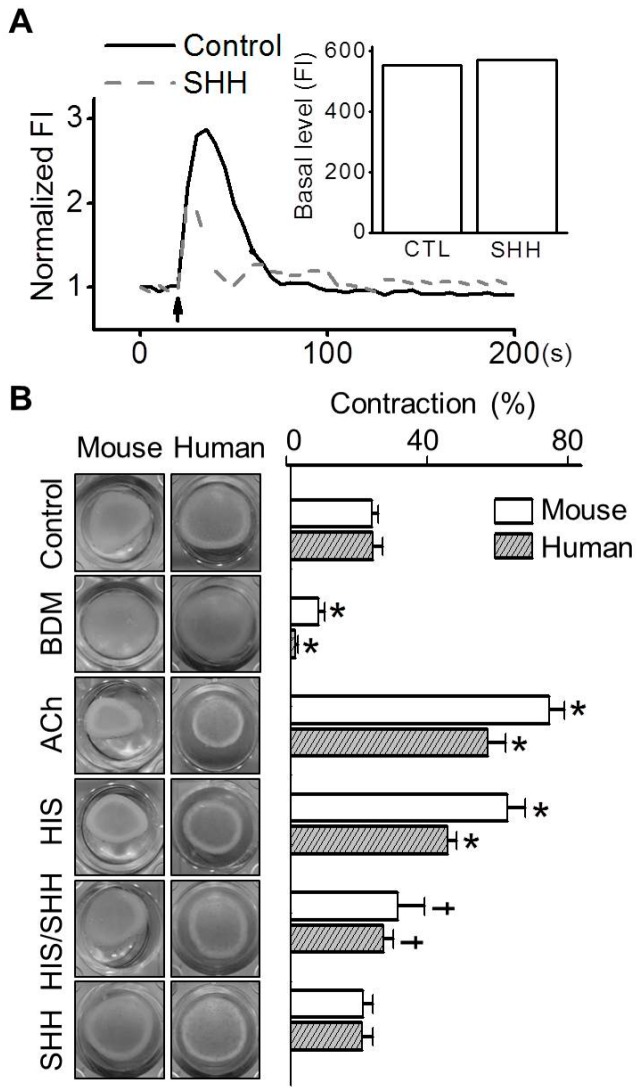
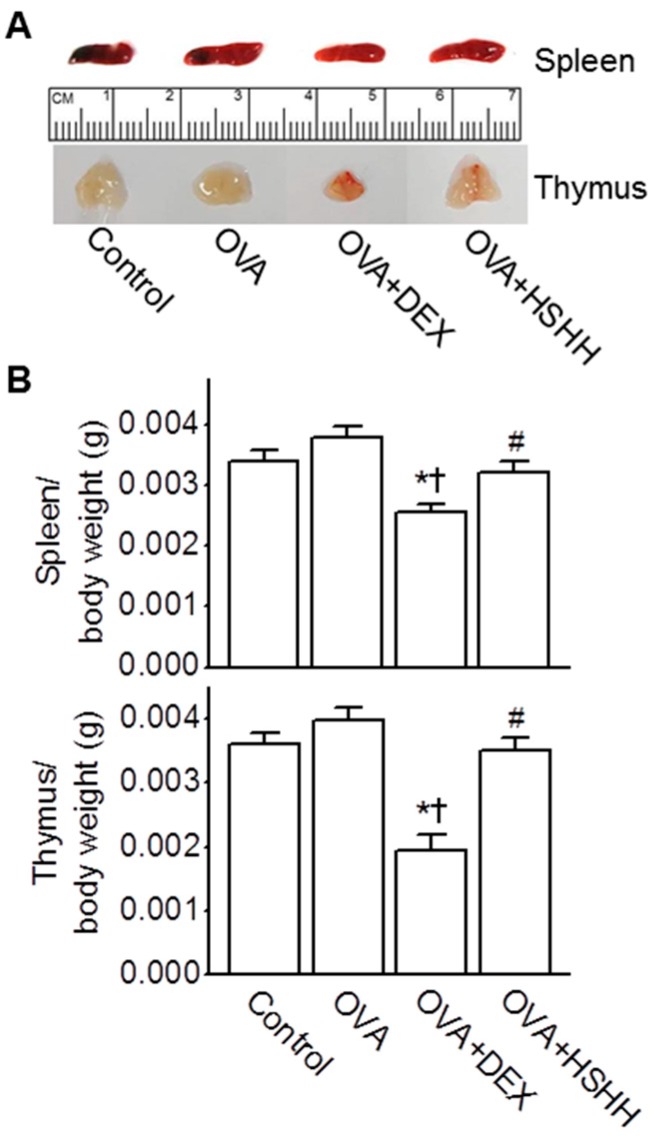
Sea hare has a variety of biological activities. However, little is known regarding the anti-asthmatic effects of sea hare. This study was performed to identify the effect of sea hare hydrolysates (SHH) on an ovalbumin (OVA)-induced allergic asthma model. The experimental asthma model was sensitized and challenged with OVA. We found that a high-dose of SHH (HSHH) significantly inhibited OVA-induced airway inflammation and mucus production around the airway in lung sections, while low- and medium-dose SHH showed an insignificant effect. In addition, HSHH highly reduced OVA-induced production of interleukin-4, -5, -13, leukotriene D4, E4, and histamine in bronchoalveolar lavage fluid. HSHH decreased the histamine-induced increase in the intracellular Ca2+ level and contractions in asthmatic smooth muscle cells. Furthermore, HSHH did not affect the weights of the spleen nor thymus, whereas dexamethasone (DEX), a steroidal anti-inflammatory drug, reduced them. Taken together, these results showed that HSHH reduced asthmatic parameters in a mouse model of allergic asthma, and suggest that SHH could be used as a potential therapeutic agent for asthma.
Keywords: airway smooth muscle cell; asthma; cytokines; sea hare hydrolysates.
Conflict of interest statement
We declare no conflict of interest. The founding sponsors had no role in the design of the study; in the collection, analyses, or interpretation of the data; in the writing of the manuscript; or in the decision to publish the results.
Figures
Similar articles
-
Geniposide inhibits airway inflammation and hyperresponsiveness in a mouse model of asthma.Int Immunopharmacol. 2013 Nov;17(3):561-7. doi: 10.1016/j.intimp.2013.06.028. Epub 2013 Jul 13. Int Immunopharmacol. 2013. PMID: 23859870
-
[Effects of budesonide on airway inflammation and airway remodeling in the ovalbumin sensitized and challenged mice].Zhonghua Jie He He Hu Xi Za Zhi. 2005 Mar;28(3):154-9. Zhonghua Jie He He Hu Xi Za Zhi. 2005. PMID: 15854408 Chinese.
-
The effects of low dose leukotriene receptor antagonist therapy on airway remodeling and cysteinyl leukotriene expression in a mouse asthma model.Exp Mol Med. 2006 Apr 30;38(2):109-18. doi: 10.1038/emm.2006.14. Exp Mol Med. 2006. PMID: 16672764
-
Anti-inflammatory and anti-asthmatic effects of resveratrol, a polyphenolic stilbene, in a mouse model of allergic asthma.Int Immunopharmacol. 2009 Apr;9(4):418-24. doi: 10.1016/j.intimp.2009.01.005. Epub 2009 Feb 8. Int Immunopharmacol. 2009. PMID: 19185061
-
Bu-Shen-Yi-Qi formulae suppress chronic airway inflammation and regulate Th17/Treg imbalance in the murine ovalbumin asthma model.J Ethnopharmacol. 2015 Apr 22;164:368-77. doi: 10.1016/j.jep.2015.01.016. Epub 2015 Jan 24. J Ethnopharmacol. 2015. PMID: 25625352
Cited by
-
Dipeptide YA is Responsible for the Positive Effect of Oyster Hydrolysates on Alcohol Metabolism in Single Ethanol Binge Rodent Models.Mar Drugs. 2020 Oct 11;18(10):512. doi: 10.3390/md18100512. Mar Drugs. 2020. PMID: 33050644 Free PMC article.
-
Sea Hare Hydrolysate Reduces PD-L1 Levels in Cancer Cells and Mitigates Rheumatoid Arthritis Ina Collagen-Induced Arthritis Mouse Model.Food Sci Nutr. 2024 Dec 2;13(1):e4644. doi: 10.1002/fsn3.4644. eCollection 2025 Jan. Food Sci Nutr. 2024. PMID: 39803276 Free PMC article.
-
Photobiomodulation Mitigates PM2.5-Exacerbated Pathologies in a Mouse Model of Allergic Asthma.Antioxidants (Basel). 2024 Aug 19;13(8):1003. doi: 10.3390/antiox13081003. Antioxidants (Basel). 2024. PMID: 39199248 Free PMC article.
-
Fermented and Aged Ginseng Sprouts (Panax ginseng) and Their Main Component, Compound K, Alleviate Asthma Parameters in a Mouse Model of Allergic Asthma through Suppression of Inflammation, Apoptosis, ER Stress, and Ferroptosis.Antioxidants (Basel). 2022 Oct 18;11(10):2052. doi: 10.3390/antiox11102052. Antioxidants (Basel). 2022. PMID: 36290772 Free PMC article.
-
Sea Hare Hydrolysate-Induced Reduction of Human Non-Small Cell Lung Cancer Cell Growth through Regulation of Macrophage Polarization and Non-Apoptotic Regulated Cell Death Pathways.Cancers (Basel). 2020 Mar 19;12(3):726. doi: 10.3390/cancers12030726. Cancers (Basel). 2020. PMID: 32204484 Free PMC article.
References
-
- Choe B. Illustrated Encyclopedia of Fauna and Flora of Korea, Mollusca (ii) Volume 33 Ministry of Education; Seoul, Korea: 1992.
-
- Nishiwaki S., Ueda H., Makioka T. Tagging studies on the growth of the sea hare aplysia kurodai on an intertidal rocky shore. Mar. Biol. 1975;32:389–395. doi: 10.1007/BF00388996. - DOI
-
- Kigoshi H., Kita M. Handbook of Anticancer Drugs from Marine Origin. Springer; Cham, Switzerland: 2015. Antitumor effects of sea hare-derived compounds in cancer; pp. 701–739.
-
- Shin M.-O. The antioxidative and antimicrobial effects of internal organs of aplysia kurodai fractions. J. Korean Soc. Food Sci. Nutr. 2010;39:1433–1438. doi: 10.3746/jkfn.2010.39.10.1433. - DOI
MeSH terms
Substances
LinkOut - more resources
Full Text Sources
Other Literature Sources
Medical
Miscellaneous
