

Global brain metabolic quantification with whole-head proton MRS at 3 T
- PMID: 28678429
- PMCID: PMC5609859
- DOI: 10.1002/nbm.3754
Global brain metabolic quantification with whole-head proton MRS at 3 T
Abstract
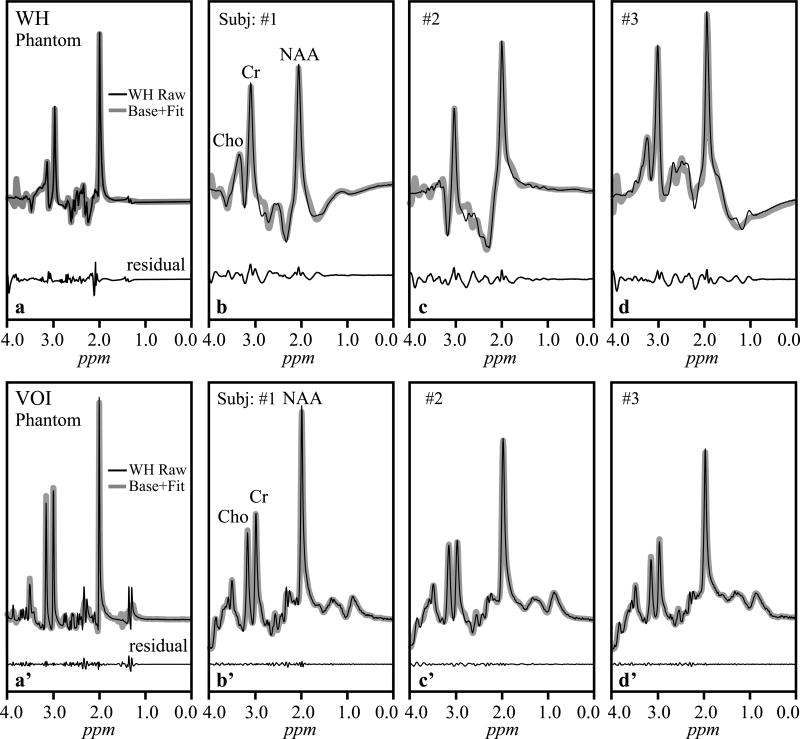
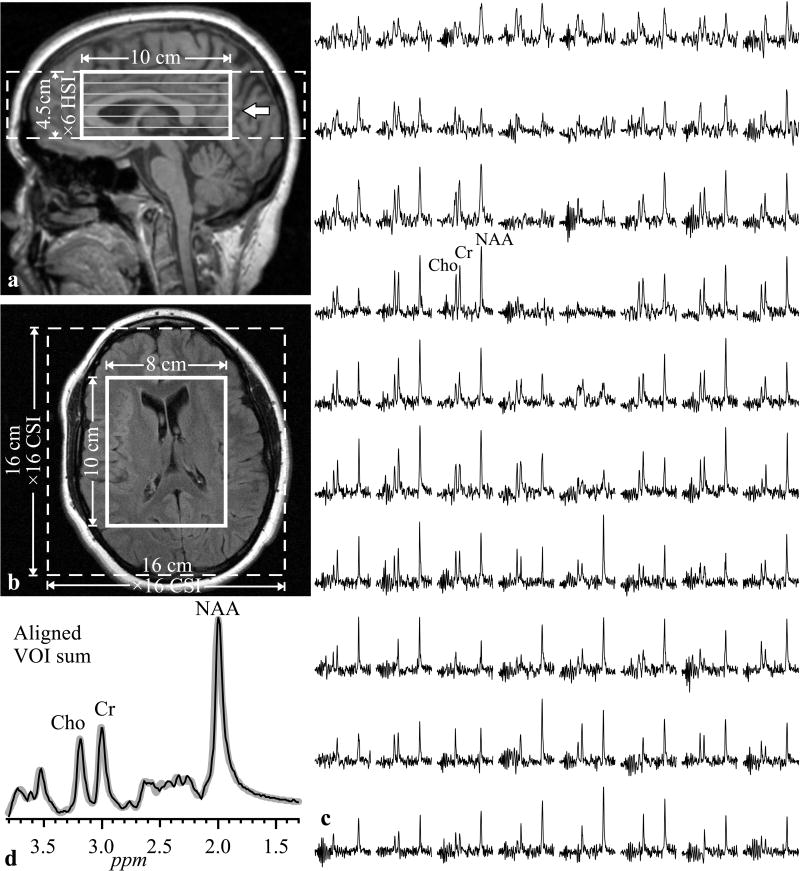
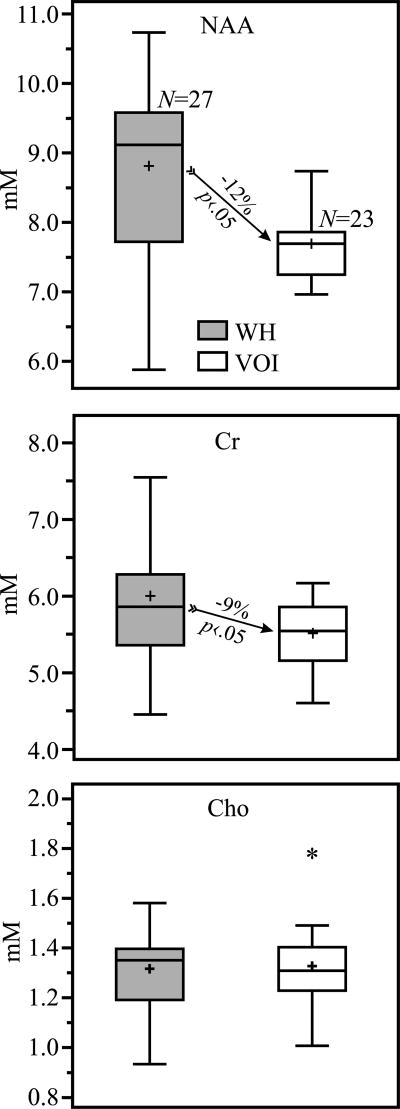
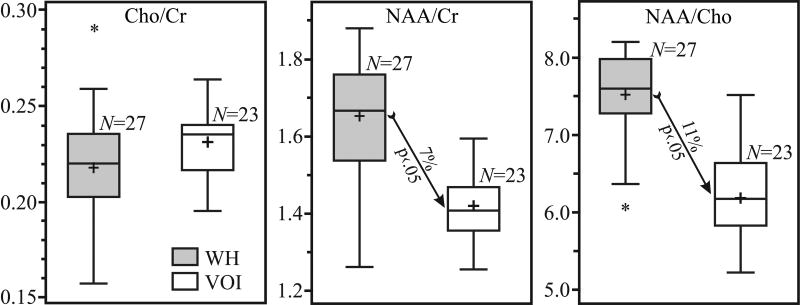
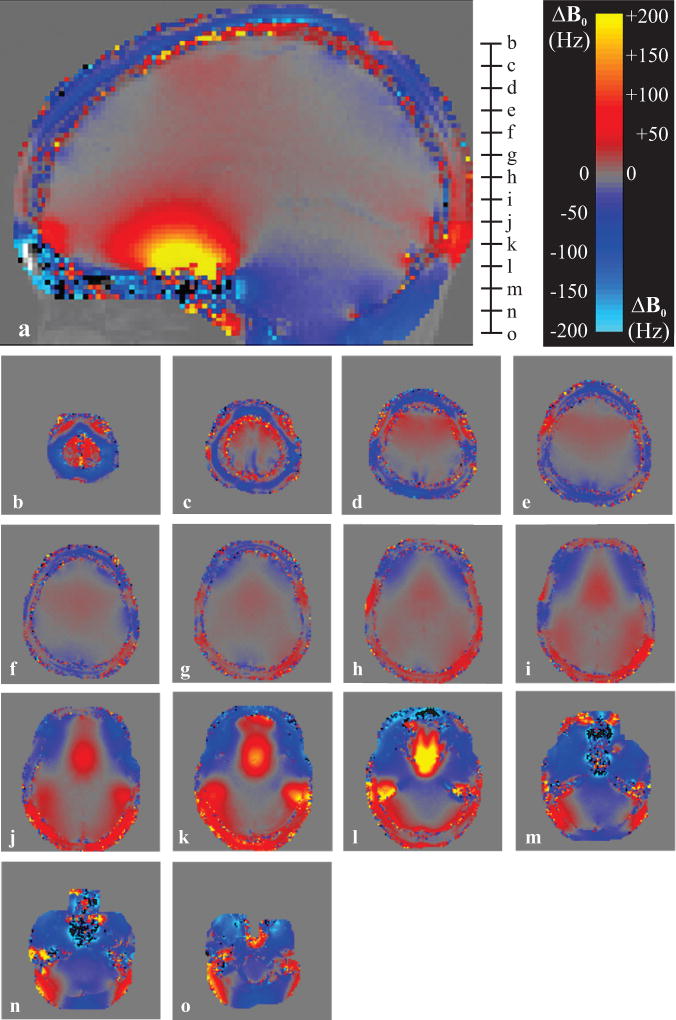
Total N-acetyl-aspartate + N-acetyl-aspartate-glutamate (NAA), total creatine (Cr) and total choline (Cho) proton MRS (1 H-MRS) signals are often used as surrogate markers in diffuse neurological pathologies, but spatial coverage of this methodology is limited to 1%-65% of the brain. Here we wish to demonstrate that non-localized, whole-head (WH) 1 H-MRS captures just the brain's contribution to the Cho and Cr signals, ignoring all other compartments. Towards this end, 27 young healthy adults (18 men, 9 women), 29.9 ± 8.5 years old, were recruited and underwent T1 -weighted MRI for tissue segmentation, non-localizing, approximately 3 min WH 1 H-MRS (TE /TR /TI = 5/10/940 ms) and 30 min 1 H-MR spectroscopic imaging (MRSI) (TE /TR = 35/2100 ms) in a 360 cm3 volume of interest (VOI) at the brain's center. The VOI absolute NAA, Cr and Cho concentrations, 7.7 ± 0.5, 5.5 ± 0.4 and 1.3 ± 0.2 mM, were all within 10% of the WH: 8.6 ± 1.1, 6.0 ± 1.0 and 1.3 ± 0.2 mM. The mean NAA/Cr and NAA/Cho ratios in the WH were only slightly higher than the "brain-only" VOI: 1.5 versus 1.4 (7%) and 6.6 versus 5.9 (11%); Cho/Cr were not different. The brain/WH volume ratio was 0.31 ± 0.03 (brain ≈ 30% of WH volume). Air-tissue susceptibility-driven local magnetic field changes going from the brain outwards showed sharp gradients of more than 100 Hz/cm (1 ppm/cm), explaining the skull's Cr and Cho signal losses through resonance shifts, line broadening and destructive interference. The similarity of non-localized WH and localized VOI NAA, Cr and Cho concentrations and their ratios suggests that their signals originate predominantly from the brain. Therefore, the fast, comprehensive WH-1 H-MRS method may facilitate quantification of these metabolites, which are common surrogate markers in neurological disorders.
Keywords: N-acetyl-aspartate; choline; creatine; diffuse brain disorders; normal brain; proton MRS; whole-head MRS.
Copyright © 2017 John Wiley & Sons, Ltd.
Figures

Similar articles
-
Replicability of proton MR spectroscopic imaging findings in mild traumatic brain injury: Implications for clinical applications.Neuroimage Clin. 2023;37:103325. doi: 10.1016/j.nicl.2023.103325. Epub 2023 Jan 19. Neuroimage Clin. 2023. PMID: 36724732 Free PMC article.
-
Temporal pole proton preoperative magnetic resonance spectroscopy in patients undergoing surgery for mesial temporal sclerosis.Neurosurg Focus. 2012 Mar;32(3):E3. doi: 10.3171/2012.1.FOCUS11327. Neurosurg Focus. 2012. PMID: 22380857
-
Quantifying global-brain metabolite level changes with whole-head proton MR spectroscopy at 3T.Magn Reson Imaging. 2017 Jan;35:15-19. doi: 10.1016/j.mri.2016.08.012. Epub 2016 Aug 28. Magn Reson Imaging. 2017. PMID: 27580518 Free PMC article.
-
(1)H-MR spectroscopy for analysis of cardiac lipid and creatine metabolism.Heart Fail Rev. 2013 Sep;18(5):657-68. doi: 10.1007/s10741-012-9341-z. Heart Fail Rev. 2013. PMID: 22945240 Free PMC article. Review.
-
MRS and MRSI guidance in molecular medicine: targeting and monitoring of choline and glucose metabolism in cancer.NMR Biomed. 2011 Jul;24(6):673-90. doi: 10.1002/nbm.1751. NMR Biomed. 2011. PMID: 21793073 Free PMC article. Review.
Cited by
-
Whole brain neuronal abnormalities in focal epilepsy quantified with proton MR spectroscopy.Epilepsy Res. 2018 Jan;139:85-91. doi: 10.1016/j.eplepsyres.2017.11.017. Epub 2017 Dec 2. Epilepsy Res. 2018. PMID: 29212047 Free PMC article.
-
Whole-brain MR spectroscopic imaging reveals regional metabolite abnormalities in perinatally HIV infected young adults.Front Neurosci. 2023 Mar 2;17:1134867. doi: 10.3389/fnins.2023.1134867. eCollection 2023. Front Neurosci. 2023. PMID: 36937663 Free PMC article.
-
Brain temperature mapping based on chemical exchange saturation transfer signal at 2 ppm.Quant Imaging Med Surg. 2025 Jan 2;15(1):676-688. doi: 10.21037/qims-24-1228. Epub 2024 Dec 18. Quant Imaging Med Surg. 2025. PMID: 39839057 Free PMC article.
References
-
- Mountford CE, Stanwell P, Lin A, Ramadan S, Ross B. Neurospectroscopy: the past, present and future. Chem Rev. 2010;110(5):3060–3086. - PubMed
-
- Benarroch EE. N-acetylaspartate and N-acetylaspartylglutamate: neurobiology and clinical significance. Neurology. 2008;70(16):1353–1357. - PubMed
-
- Delcker A, Turowski B, Mihm U, Raab P, Rusch O, Pilatus U, Zeuzem S, Zanella FE. Proton MR spectroscopy of neurometabolites in hepatic encephalopathy during L-ornithine-L-aspartate treatment--results of a pilot study. Metab Brain Dis. 2002;17(2):103–111. - PubMed
MeSH terms
Substances
Grants and funding
LinkOut - more resources
Full Text Sources
Other Literature Sources
