. 2017 Jul 27;547(7664):468-471.
doi: 10.1038/nature23272. Epub 2017 Jul 5.

Crystal structures of agonist-bound human cannabinoid receptor CB1

Affiliations

Crystal structures of agonist-bound human cannabinoid receptor CB1

Tian Hua et al. Nature. .

Retraction in

Abstract

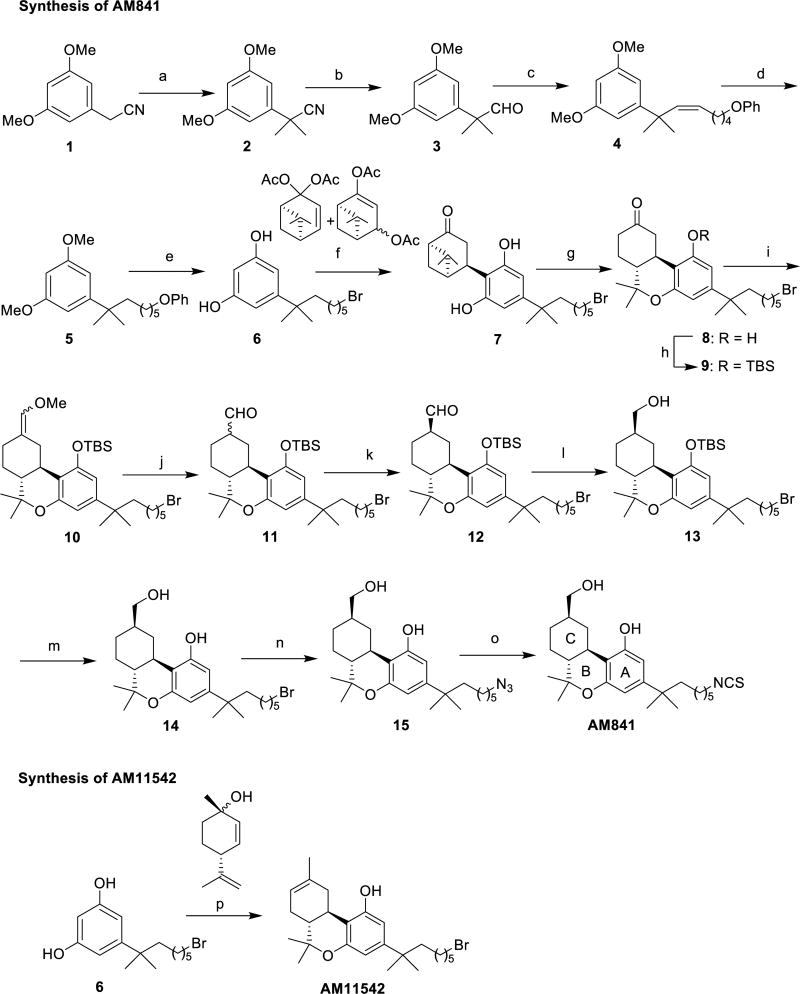
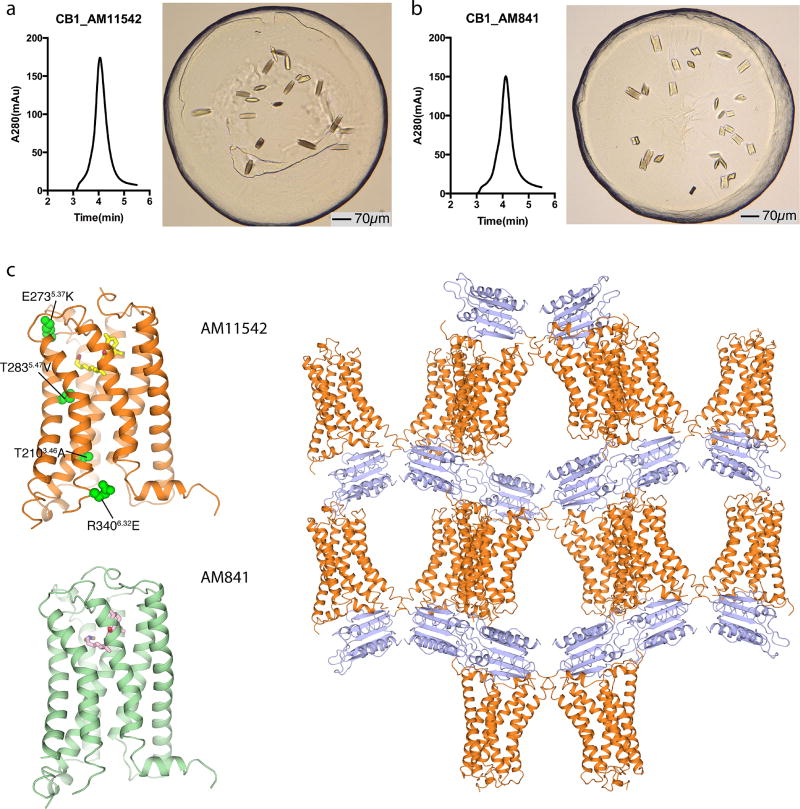
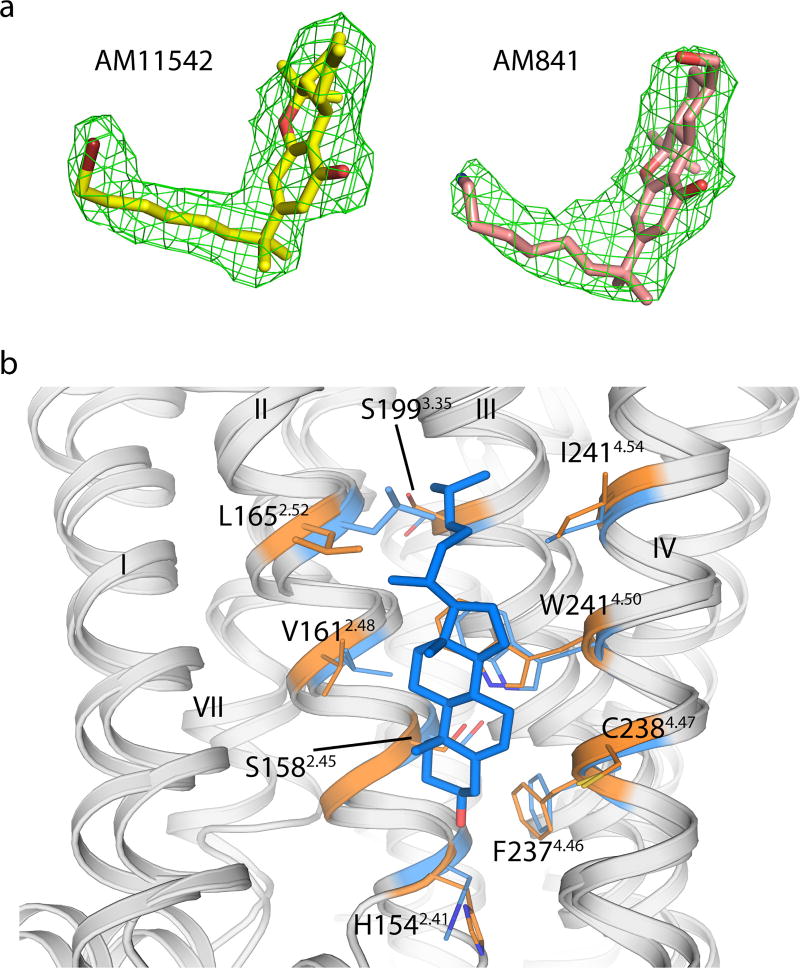
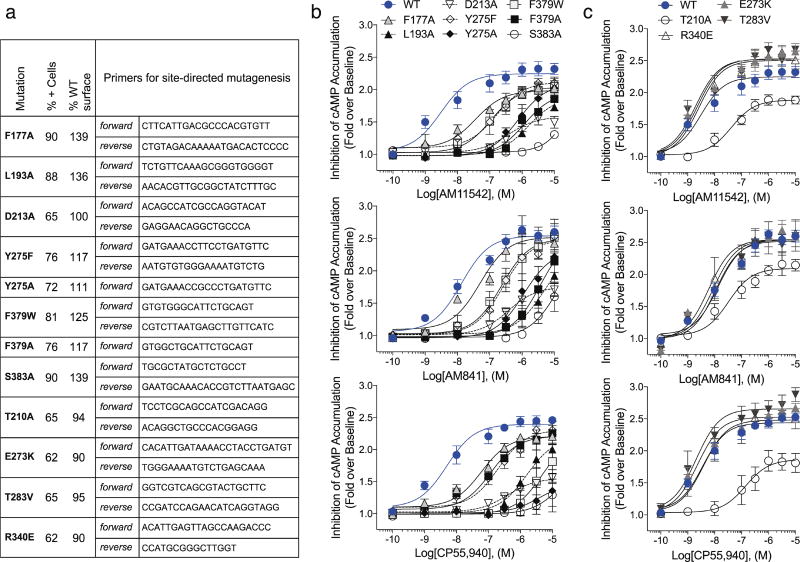
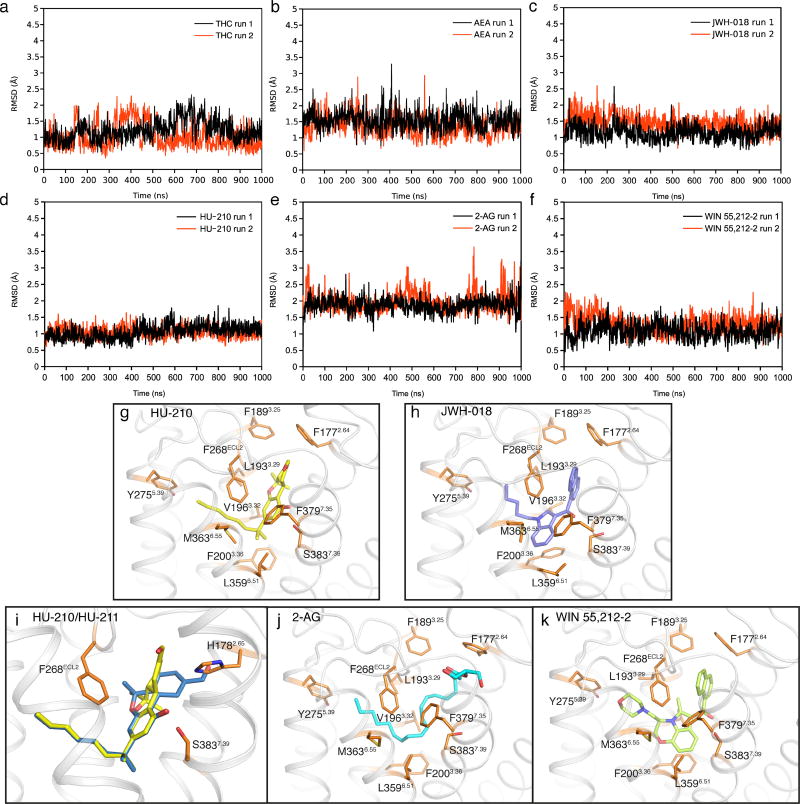
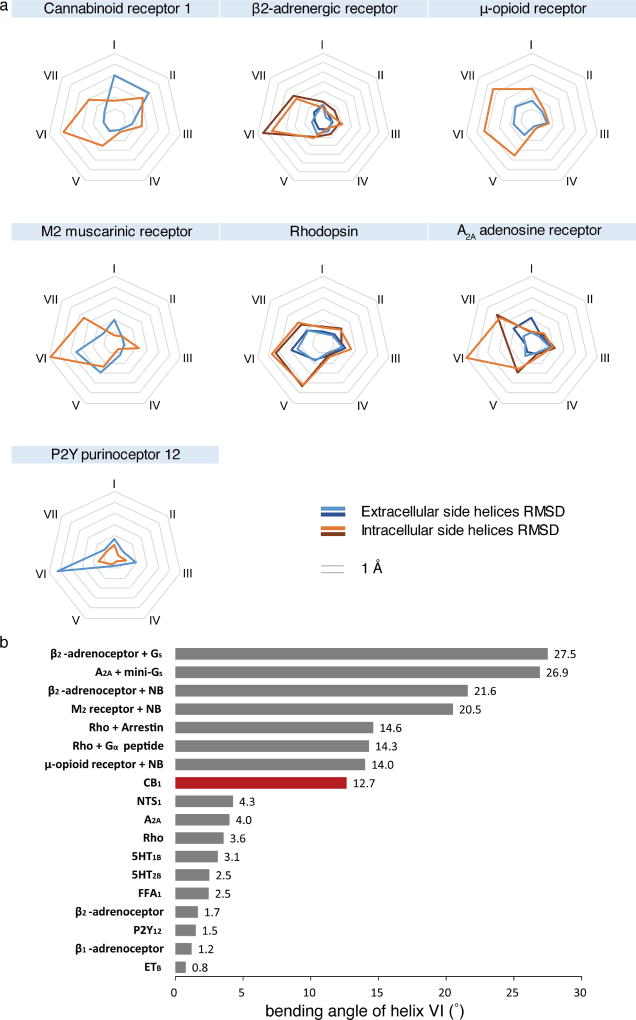
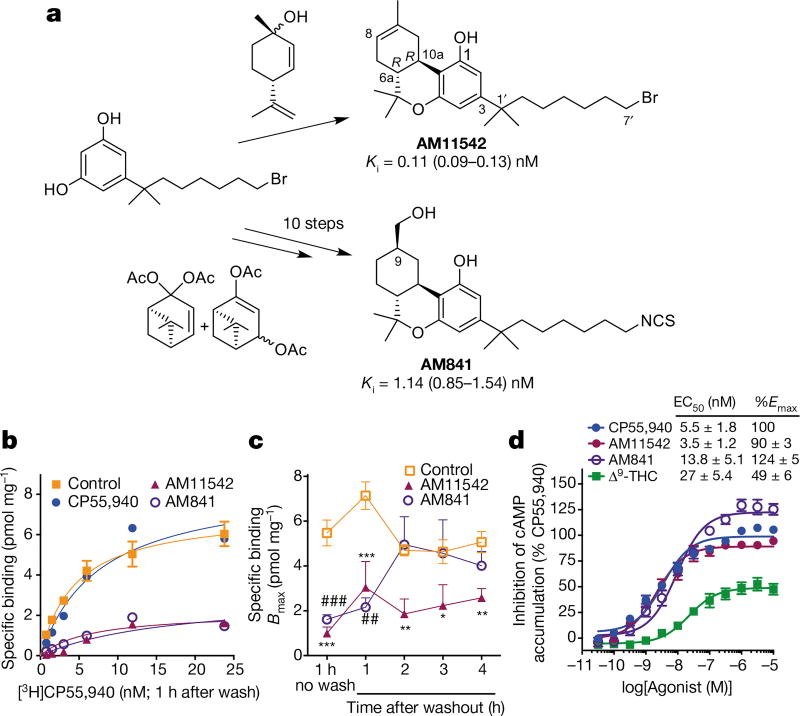
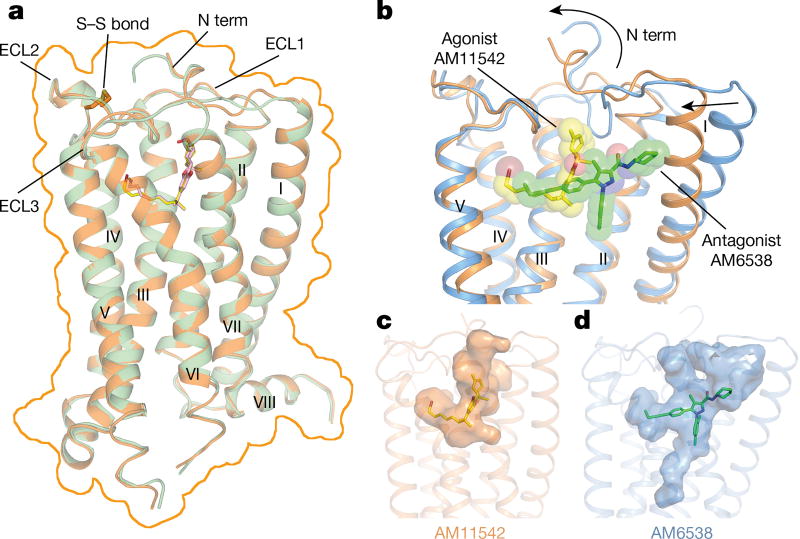
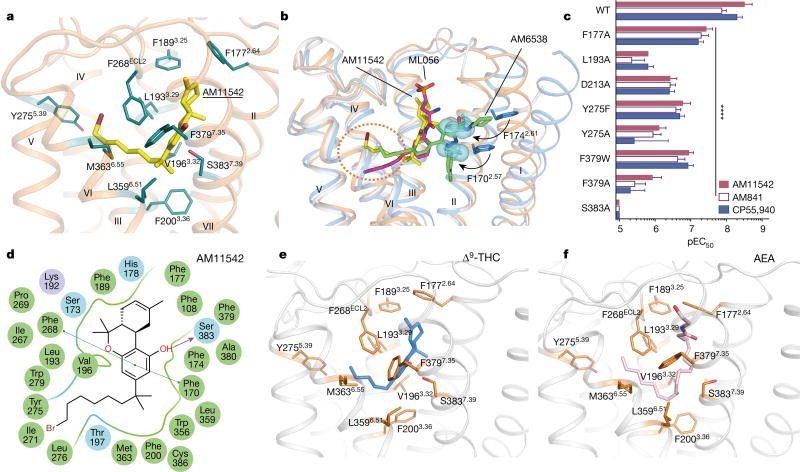
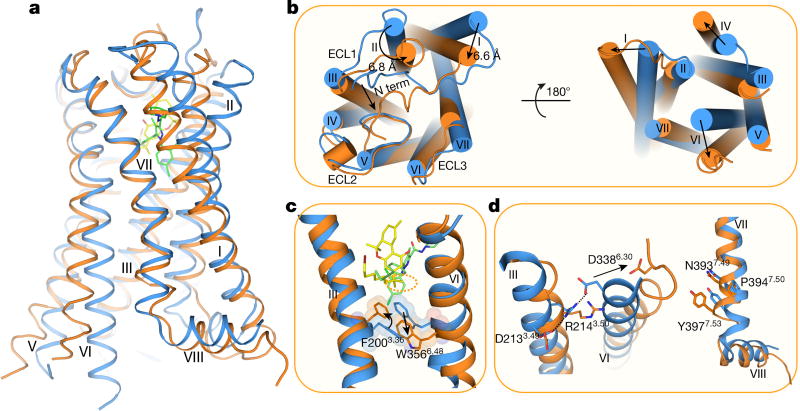
The cannabinoid receptor 1 (CB1) is the principal target of the psychoactive constituent of marijuana, the partial agonist Δ9-tetrahydrocannabinol (Δ9-THC). Here we report two agonist-bound crystal structures of human CB1 in complex with a tetrahydrocannabinol (AM11542) and a hexahydrocannabinol (AM841) at 2.80 Å and 2.95 Å resolution, respectively. The two CB1-agonist complexes reveal important conformational changes in the overall structure, relative to the antagonist-bound state, including a 53% reduction in the volume of the ligand-binding pocket and an increase in the surface area of the G-protein-binding region. In addition, a 'twin toggle switch' of Phe2003.36 and Trp3566.48 (superscripts denote Ballesteros-Weinstein numbering) is experimentally observed and appears to be essential for receptor activation. The structures reveal important insights into the activation mechanism of CB1 and provide a molecular basis for predicting the binding modes of Δ9-THC, and endogenous and synthetic cannabinoids. The plasticity of the binding pocket of CB1 seems to be a common feature among certain class A G-protein-coupled receptors. These findings should inspire the design of chemically diverse ligands with distinct pharmacological properties.


Conflict of interest statement

The authors declare competing financial interests: details are available in the online version of the paper.

Figures

Extended Data Figure 1
Extended Data Figure 1. Synthesis of AM841 and AM11542
Reagents and conditions: (a) CH3I, NaH, DMF, 0 °C to room temperature, 2 h, 95%; (b) DIBAL-H, CH2Cl2, − 78 °C, 0.5 h, 87%; (c) Br P+Ph3(CH2)5OPh, (Me3Si)2NK, THF, 0–10 °C, 30 min, then addition to 3, 0 °C to room temperature, 2 h, 96%; (d) H2, 10% Pd/C, AcOEt, room temperature, 2.5 h, 89%; (e) BBr3, CH2Cl2, −78 °C to room temperature, 6 h, 85%; (f) diacetates, p-TSA, CHCl3, 0 °C to room temperature, 4 days, 64%; (g) TMSOTf, CH2Cl2/MeNO2, 0 °C to room temperature, 3 h, 71%; (h) TBDMSCl, imidazole, DMAP, DMF, room temperature, 12 h, 85%; (i) Cl Ph3P+CH2OMe, (Me3Si)2NK, THF, 0 °C to room temperature, 1 h, then addition to 9, 0 °C to room temperature, 1.5 h, 73%; (j) Cl3CCOOH, CH2Cl2, room temperature, 50 min, 95%; (k) K2CO3, EtOH, room temperature, 3 h, 84%; (l) NaBH4, EtOH, 0 °C, 30 min, 98%; (m) TBAF, THF, −40 °C, 30 min, 96%; (n) TMG-N3, CHCl3/MeNO2, room temperature, 18 h, 84%; (o) PPh3, CS2, THF, room temperature, 10 h, 76%; (p) (+)-cis/trans-p-mentha-2,8-dien-1-ol, p-TSA, benzene, reflux 4 h, 65%.
Extended Data Figure 2
Extended Data Figure 2. Analytical size exclusion chromatography profile and crystals of CB1–AM11542/AM841 complex
a, Analytical size exclusion chromatography and crystal image of the CB1–AM11542 complex. Scale bar, 70 µm. b, Analytical size exclusion chromatography and crystal image of the CB1–AM841 complex. Scale bar, 70 µm. c, The overall structures of CB1–AM11542 and CB1–AM841 complexes and crystal packing of CB1–AM11542; receptor is in orange (AM11542)/green (AM841) colour and the flavodoxin fusion protein is in purple-blue colour. The agonists AM11542 (yellow) and AM841 (pink) are shown in sticks representation. The four single mutations T2103.46A, E2735.37K, T2835.47V and R3406.32E are shown as green spheres in the CB1–AM11542 structure.
Extended Data Figure 3
Extended Data Figure 3. Representative electron density of the CB1 agonists-bound structures and cholesterol binding sites
a, The |Fo| − |Fc| omit maps of AM11542 and AM841 contoured at 3.0σ at 2.80 Å and 2.95 Å, respectively. b, The cholesterol binding site in the CB1–AM11542 structure (orange) with CB1–AM6538 structure (blue) superposed.
Extended Data Figure 4
Extended Data Figure 4. Mutations of the CB1 receptor and the effects on agonist-induced activity as assessed by the forskolin-stimulated accumulation of cAMP
a, Primers used to generate mutations in 3×HA–CB1 and validation of cell-surface expression of wild-type and mutant CB1 in CHO-K1 cell lines quantitative flow cytometry. b, Dose response studies of agonist (AM11542, AM841 and CP55,940) activity for each mutant compared to wild type (in blue filled circles) from Fig. 3c. c, Assessment of the effect of the individual point mutations that were made to stabilize the receptor, in absence of the flavodoxin insert, on receptor activity. All experiments were repeated at least three times, and error bars denote s.e.m. of duplicate measurements (parameters are in Extended Data Table 2).
Extended Data Figure 5
Extended Data Figure 5. Docking poses of different cannabinoid receptor agonists and MD validation
a–f, The r.m.s.d. values of ligand heavy atoms show that the docked poses are stable during the 1 µs molecular dynamics simulations: Δ9-THC (a), AEA (b), JWH-018 (c), HU-210 (d), 2-AG (e), WIN 55,212-2 (f). g, h, j, k, The poses of HU-210 (g), JWH-018 (h), 2-AG (j) and WIN 55,212-2 (k) are shown. i, The superimposition of HU-210 (yellow sticks) and HU-211 (blue sticks) in the binding pocket. The binding pose of HU-210 explains why HU-211, the enantiomer of HU-210, failed to stimulate CB1 because superimposed HU-211 on HU-210 shows severe clashes with H1782.65 in CB1.
Extended Data Figure 6
Extended Data Figure 6. Structural conformation changes of solved agonist- and antagonist-bound class A GPCRs
a, The pattern of r.m.s.d. values of transmembrane helices between agonist- and antagonist-bound class A GPCR structures. The structures used for analysis are the same as described in Extended Data Table 3. b, Measurement of the degree of helix VI bending observed in class A GPCRs structures. All structures were superimposed onto inactive-state β2-adrenergic receptor by UCSF Chimera. The direction of helices VI were defined by vectors ηi which starts from the centre of Cα of residues 6.45–6.48 to the centre of Cα of residues 6.29–30–6.32–33. The two vectors η0 and η1 of helices VI in the inactive-state and active-state β2-adrenergic receptor were selected as reference to form a plane α. The vector ηi of helix VI of other structure was projected to the plane α as a new vector ηi. The bending angle of each helix VI was then defined by the angle between ηi and η0. The structures are: ETB (PDB code 5GLH), β1-adrenergic receptor (PDB code 2Y02), P2Y12 (PDB code 4PXZ), β2-adrenergic receptor (PDB code 3PDS), FFA1 (PDB code 4PHU), 5HT2B (PDB code 4IB4), 5HT1B (PDB code 4IAR), Rho (PDB code 2HPY), A2A (PDB code 3QAK), NTS1 (PDB code 4BUO), CB1 (bound to AM11542; PDB code 5XRA), µ-opioid receptor + nanobody (NB) (PDB code 5C1M), Rho + NB (PDB code 2X72), Rho + arrestin (PDB code 4ZWJ), M2R + NB (PDB code 4MQS), β2-adrenergic receptor + NB (PDB code 4LDL), A2A + mini-Gs (PDB code 5G53), β2-adrenergic receptor + Gs (PDB code 3SN6).
Figure 1
Figure 1. Synthesis and pharmacological characterization of AM11542 and AM841
a, Synthesis of AM11542 and AM841 (Extended Data Fig. 1) with radioligand binding affinity against [3H]CP55,940. Ki, inhibition constant. b, Cell membranes were pretreated with CP55,940 (4 nM), AM11542 (1 nM), AM841 (10 nM) or buffer (control) for 1 h, washed, and then subjected to [3H]CP55,940 binding for 1 h. c, Bmax values (maximal binding capacity) were calculated from b and in experiments where the incubation time of radioligand was increased following the washing. Pretreatment with either AM11542 or AM841 prevents radioligand binding after 1 h incubation (control: versus AM841: ##P < 0.01; versus AM11542 * * * P < 0.001), while AM11542 prevents radioligand binding at all later time points tested (control versus AM11542: * P < 0.05, * * P < 0.01). Displacement of [3H]CP55,940 binding in the presence of AM11542 (versus control: * * * P < 0.001) and AM841 (versus control: ###P < 0.001) are shown for comparison. (Student’s t-test versus control at each time point; data are mean ± s.e.m.; n = 3–6.) d, Agonist activity measured as the inhibition of forskolin-stimulated cAMP accumulation. Data are mean ± s.e.m. of n ≥ 6 independent experiments. %Emax, percentage of maximum response; EC50, half-maximum effective concentration.
Figure 2
Figure 2. Overall structures of CB1–AM11542 and CB1–AM841 complexes
a, Superposition of CB1–AM11542 and CB1–AM841 structures with the surface outlined by an orange line. CB1 is shown in orange and green cartoon with ligands AM11542 (yellow sticks) and AM841 (pink sticks). b, Comparison of agonist-bound (orange cartoon) and antagonist-bound (blue cartoon) CB1 ligand-binding pockets. AM11542 (yellow) and AM6538 (green) are shown in sticks and sphere representations. c, d, The shape of AM11542 (c) and AM6538 (d) binding pockets are shown in surface representation.
Figure 3
Figure 3. AM11542 binding pocket analysis and molecular docking of Δ9-THC and AEA
a, Key residues (deepteal sticks) involved in AM11542 (yellow sticks) binding. b, Binding pose comparison of AM11542 (yellow), AM6538 (green) and ML056 (magenta) in their receptors, which are shown in orange, blue and grey cartoon, respectively. Phe1702.57 and Phe1742.61 in AM11542 and AM6538 complexes are shown in blue sphere and blue sticks, respectively. c, Certain mutations on CB1 significantly decreased potency in the cAMP assay compared to agonist-response at the wild-type (WT) receptor as determined by comparison of negative logarithm of the EC50 (pEC50) values by two-way analysis of variance (ANOVA) without repeated measures followed by Dunnett’s post hoc test (comparing each drug to its effect in the wild type: * * * * P < 0.0001, data are mean ± s.e.m., n ≥ 3) (Extended Data Table 2). d, Summary of receptor interactions of AM11542. Purple ball (positive charged interaction); cyan ball (polar interaction); green ball (hydrophobic interaction); purple arrow (H-bond); green line (π–π stacking) e, f, The docking pose of Δ9-THC (e, blue sticks) and AEA (f, pink sticks).
Figure 4
Figure 4. Structural comparison of agonist-and antagonist-bound CB1
a, Side view of the CB1–AM11542 complex (receptor as orange and ligand as yellow) and CB1–AM6538 complex (receptor in blue and ligand as green). b, The extracellular (left) and intracellular (right) views of the compared receptors. c, The ‘twin toggle switch’, Phe2003.36/Trp3566.48, is shown in sticks and spheres. Colour scheme as in a. d, Rearrangement of DRY (left) and NPXXY motifs (right) in agonist- and antagonist-bound CB1 structures.

References

    1. Mechoulam R, Hanuš LO, Pertwee R, Howlett AC. Early phytocannabinoid chemistry to endocannabinoids and beyond. Nat. Rev. Neurosci. 2014;15:757–764. - PubMed
    1. Hua T, et al. Crystal structure of the human cannabinoid receptor CB1. Cell. 2016;167:750–762. e714. - PMC - PubMed
    1. Ballesteros JA, Weinstein H. In: Methods in Neurosciences. Sealfon Stuart C, editor. Vol. 25. Academic; 1995. pp. 366–428.
    1. Lemberger L. Potential therapeutic usefulness of marijuana. Annu. Rev. Pharmacol. Toxicol. 1980;20:151–172. - PubMed
    1. Li H-L. An archaeological and historical account of cannabis in China. Econ. Bot. 1973;28:437–448.

Publication types

MeSH terms