. 2017 Jul 13;547(7662):213-216.
doi: 10.1038/nature23009. Epub 2017 Jul 5.

Nutrient sensing modulates malaria parasite virulence

Affiliations

Nutrient sensing modulates malaria parasite virulence

Liliana Mancio-Silva et al. Nature. .

Abstract

The lifestyle of intracellular pathogens, such as malaria parasites, is intimately connected to that of their host, primarily for nutrient supply. Nutrients act not only as primary sources of energy but also as regulators of gene expression, metabolism and growth, through various signalling networks that enable cells to sense and adapt to varying environmental conditions. Canonical nutrient-sensing pathways are presumed to be absent from the causative agent of malaria, Plasmodium, thus raising the question of whether these parasites can sense and cope with fluctuations in host nutrient levels. Here we show that Plasmodium blood-stage parasites actively respond to host dietary calorie alterations through rearrangement of their transcriptome accompanied by substantial adjustment of their multiplication rate. A kinome analysis combined with chemical and genetic approaches identified KIN as a critical regulator that mediates sensing of nutrients and controls a transcriptional response to the host nutritional status. KIN shares homology with SNF1/AMPKα, and yeast complementation studies suggest that it is part of a functionally conserved cellular energy-sensing pathway. Overall, these findings reveal a key parasite nutrient-sensing mechanism that is critical for modulating parasite replication and virulence.


Conflict of interest statement

Conflict of interest

The authors declare no conflict of interest.

Figures

Extended Data Figure 1
Extended Data Figure 1. Impact of calorie restricted diet in rodent malaria models.
a-b. Body weight change (a) and blood glucose levels (b) of C57BL/6 male mice under long-term calorie restriction (CR) or ad libitum (AL). Body weight data (mean±sd; n=4/group) was normalized to the initial weight for each animal. The average daily food consumption for AL and CR mice was 2.93±0.48g and 1.76±0.11g, respectively (mean±sd). c. Number of RBCs/ml in infected C57BL/6 male mice in AL and CR diet regimens. Cell density was determined in 1μl of blood collected from the tail and counted on a hemocytometer chamber (mean±sd; n=4/group). d-f. Full course of parasitemia from infected mice infected by mosquito bite (d) or by intraperitoneal (i.p.) injection of 1×10⁶ infected RBCs (iRBC) (e-f). Values (mean±sem) represent one of 2 independent experiments. Parasitemia of GFP-expressing P. berghei ANKA (mosquito bite, n=5/group; iRBC, n=4/group) determined by flow cytometry analysis. Parasitemia of P. berghei K173 (n=4/group) obtained by microscopy analysis of blood smears. g-h. Parasitemia of a representative experiment of male BALB/c mice infected i.p. with 1×10⁵ P. yoelii 17XNL iRBC (n=4/group) or 1×10⁵ P. chabaudi AS iRBC (n=3/group). Parasitemia obtained by microscopy analysis represents 1 of 2 independent experiments. i-j. Parasitemia of P. berghei ANKA infection in BALB/c (i) and BALB/c scid (severe combined immune deficiency) mice (j). Mice were infected by i.p. injection of 1×10⁵ GFP-expressing parasites and parasitemia assessed by flow cytometry (mean±sem; BALB/c, n=8/group; BALB/c scid, AL n=7, CR n=8; 2 independent experiments pooled). k. BALB/c mice i.p. injected with 1×10⁵ P. berghei ANKA expressing luciferase under a constitutive promotor30 and imaged on day 4 after infection (AL n=10, CR n=5; 2 independent experiments pooled). l. BALB/c mice infected with P. berghei ANKA expressing luciferase under the ama1 schizont-specific promoter, to allow imaging of the sequestering parasite stage. Mice were imaged 25h after i.v. infection with purified mature schizonts. AL, top animals; CR, bottom animals. Spleen weight and parasite load measured 72h after infection with mature schizonts. Parasite load was determined by qPCR analysis of P. berghei 18S rRNA. Spleen weight was normalized to body weight for each mouse (AL n=3, CR n=4). m. Relative abundance of circulating young and mature parasites in AL and CR C57BL/6 mice infected with 1x10⁶ GFP-expressing P. berghei ANKA iRBCs. Tail blood from infected mice was analyzed by flow cytometry. After excluding false GFP-positive events, the total GFP population was separated in low (GFP+) and high (GFP++) GFP-expressing cells, corresponding to young and mature parasites, respectively. The same gates were applied to AL and CR blood samples on days 4, 5, and 6 after infection. The observed marked reduction in the percentage of mature parasites overtime in both diet conditions is indicative of sequestration of infected RBCs. Bars are mean±sem (7 mice/group; 2 independent experiments pooled).
Extended Data Figure 2
Extended Data Figure 2. Effect of CR in vitro.
a. Workflow representation of the in vitro parasite maturation assay. Experiments were conducted in a glucose-free RPMI medium supplemented with HEPES, antibiotic, 10-25% rodent sera and glucose at the concentration indicated in the corresponding figure and/or legend. b-c. Boxplots showing microscopic quantification of the number of P. berghei ANKA (b) or P. yoelii 17XNL (c) merozoites per segmented schizont after in vitro culturing in the presence of 25% AL or CR mouse sera (glucose, 4mM). Culture for 30 hr showed similarly reduced merozoite numbers in the CR condition, suggesting that parasite development is not delayed in CR. Only mature schizonts with clear separated merozoites and a single pigmented digestive vacuole were imaged and scored (Mann-Whitney test). Total numbers of schizonts analyzed in 2 independent experiments are as follows: P. berghei AL 22h, 111; CR 22h, 78; AL 30h, 74; CR 30h, 94; P. yoelii AL, 58; CR, 107. d. Flow cytometry analysis of P. berghei ANKA schizonts prepared as in (b) and stained with SYBR Green to quantify the DNA content (2 independent experiments). e. Representative flow cytometry plots and gating strategy for analysis of GFP-expressing P. berghei ANKA parasites after 24 hr in vitro culture with 25% AL or CR rat sera (glucose, 4mM). Cells were selected on FSC and SSC and then on FITC (green) and PE (red) channels. As shown in left and middle panels, mature schizonts express strong GFP signal detected in the FITC channel. Histogram plot show fluorescent intensity comparison between AL and CR. Data represents 1 of 3 independent experiments. f. Comparing parasitemia levels (left axis, black) and the estimated parasite numbers (right axis, blue) using a geometric progression (y=mx) in which the basis is the mean merozoite number for AL and CR (9 and 6, respectively) for the first days of parasite linear growth. Parasitemia data was obtained from Fig. 2c (mean±sem; n=11/group; AL, closed circles, CR open circles). Matematical modeling of parasitemia taking into account only the number of merozoites appears to be sufficient to predict the observed growth difference of P. berghei during early infection. g-h. Boxplot of merozoite numbers and parasitemia of P. berghei ANKA wild-type (wt) and Δpk7 parasites. Number of schizonts analyzed after in vitro maturation in AL conditions in 2 independent experiments are as follows: wt, 36; Δpk7, 85. h. Parasitemia determined by microscopic examination of blood smears from C57BL/6 mice infected with 1x10⁶ iRBCs of P. berghei ANKA Δpk7 (n=4) and the parental wt (AL n=3; CR n=4). The data show that parasites producing fewer merozoites lead to similar low parasitemia to that of parasites under CR.
Extended Data Figure 3
Extended Data Figure 3. Microarray analysis of P. berghei parasites under CR.
a. Schematic representation of parasite sample preparation for microarray time-course analysis. P. berghei ANKA parasites collected with 4 hr intervals 30 hr after intravenous injection of purified schizonts into AL and CR mice. b. Microscopy analysis of parasite size (as proxy for parasite age) in the samples used in the microarrays show no apparent morphological differences in parasite development under AL and CR across the different time-points. The parasite area (a.u., arbitrary units) is defined by the Giemsa staining on thin blood smears following Lemieux et al., 2009 and was scored using ImageJ. Histograms of parasite size distribution (3 mice/group/time-point). The total number of parasites analyzed are as follows: 6 hr, AL n=150, CR n=143; 10 hr, AL n=158, CR n=159; 14 hr, AL n=158, CR n=157; 18 hr, AL n=180, CR n=121). The indicated time-points correspond to the parasite developing time after RBC re-invasion, in the second cycle. c. Scatter plots of log2 fold change (FC) (y-axis) and mean expression levels (x-axis) of parasites in CR vs AL (CR/AL) of 3 mice/group at the indicated time-points. Genes differentially induced or repressed in CR (with log2 FC of 1 and adjusted p<0.01) are highlighted in red and blue, respectively. The number (and relative percentage) of genes altered for each time-point is given in the graphs in red (induced) and blue (repressed). d. Correlation plot between microarray and qPCR analysis for the 14-hour samples. 20 genes were selected based on the highest fold-changes, analyzed by qPCR and compared to the values obtained in the microarray analysis. Validation rate was 80%. Values are mean of 3 mice/group. The list of genes analyzed and their fold-changes in qPCR and microarray is given in the Source Data file. e. qPCR analysis of repressed genes in independent biological samples collected at 14 hr (AL n=4, CR n=3). Each circle represents 1 mouse. Gene IDs are shown without their PBANKA_ prefix. Microarray hybridization was performed one time and confirmed by qPCR for a subset of genes in the same RNA samples (d), as well as independently collected samples (e). f. Gene ontology enrichment analysis (Molecular Function) of the genes showing significant alterations for each time point using PlasmoDB (www.plasmodb.org) tools and considering Benjamini-Hochberg <0.05. The graph highlights the top 4 of terms with highest significance for each time point and/or terms that appear more than once. Red, induced; blue, repressed. The full list of terms (including Biological Process analysis) for each time point is given in the Source Data file.
Extended Data Figure 4
Extended Data Figure 4. Screen of P. berghei kinase mutants and characterization of Δkin and complemented parasite lines.
a. Screening of kinase mutants using the CR in vitro assay. Screen performed in media supplemented with 25% of AL or CR sera (glucose, 4mM). The graph shows the relative reduction of merozoite formation in CR (unfilled bars) in comparison to AL (filled bars). Values are mean±sd of 3 independent experiments for wt, Δnek4, Δpk7, Δkin, Δcdkl, Δcdpk3, Δgak, Δtkl5 and 2 independent experiments for other knockout lines. The total number of schizonts analyzed is as follows: wt, AL n=150, CR n=167; Δkin, AL n=80, CR n=86; Δpk1, AL n=108, CR n=89; Δpk7, AL n=134, CR n=154; Δnek2, AL n=99, CR n=86; Δnek4, AL n=117, CR n=79; Δcdpk3, AL n=46, CR n=81; Δcdpk4, AL n=55, CR n=63; Δgak, AL n=46, CR n=54; Δcdkl, AL n=79, CR n=62; Δtkl5, AL n=99, CR n=93; Δsrpk, AL n=59, CR n=86; Δeik1, AL n=110, CR n=71; Δeik2, AL n=116, CR n=84; Δmap1, AL n=90, CR n=59; Δmap2, AL n=50, CR n=42. b. Boxplot of microscopic analysis of merozoite numbers for P. berghei ANKA wild-type (wt, AL n=49, CR n=77) and a second independent clone of Δkin (AL n=54, CR n=73) in the same conditions as in (a) (Mann-Whitney test). c. Schematic of Δkin complementation strategy. Double crossover recombination at Pbkin 5’ and 3’ UTR was used to genetically delete the previously introduced tgdhfr and complement with codon-altered Pbkin gene and hdhfr. Transgenic parasites were selected by WR99210 treatment of mice (4 subcutaneous daily injections, 16mg/Kg/day). Annealing sites for genotyping primers are illustrated (left) and primer sequences are given in Supplementary Table 1. Agarose gel image (representative of 3) showing diagnostic PCR products from Δkin and Δkin+kin extracted genomic DNA, after dilution cloning of the complemented parasite line (right). d. Flow cytometry analysis of GFP-expressing P. berghei ANKA wild-type, Δkin and complemented Δkin parasites after in vitro maturation to schizonts with medium supplemented with AL and CR sera as in (a) and analyzed as in Extended Data Fig. 2e. Histograms represent 2 independent experiments. e. Full course parasitemia (mean±sem) and survival of C57BL/6 mice AL and CR infected by i.p. injection of 1×10⁶ iRBCs of P. berghei wild-type (wt; AL n=7, CR n=7), Δkin (AL n=9, CR n=8) and Δkin+kin (AL n=10, CR n=6). AL, closed circles; CR, open circles. f. Analysis of parasite area (arbitrary units, a.u.) on Giemsa-stained smears of the samples used for RNA sequencing, as in Extended Data Fig. 3b. Histograms of parasite size distribution (3 mice/group). The total number of parasites analyzed as follows: wt, AL n=172, CR n=148; Δkin, AL n=112, CR n=129. g. Correlation plot between microarray and RNA sequencing (RNAseq) analysis for the wild-type samples at 10 hr. Analysis of top 500 genes with p<0.01 in CR vs AL and expression levels higher than the first quartile in both platforms are shown in the graph. Despite the use of different platforms to analyze gene expression, there is 0.45 correlation between microarray and RNAseq data from the two independently obtained wild-type samples (p < 0.001). h. Comparison of GO term enrichment analysis of CR-altered genes between RNAseq and microarray platforms for the 10 hr time-point. The GO “Molecular Function” graph highlights the location and relation of significantly enriched terms. As indicated in the key, node size refers to the level of significance of each GO term, while the color of the node represents if a particular term was detected in one or both platforms. The graph is split into two halves; where the top half represents the enrichment of terms from upregulated genes and the bottom half that of downregulated genes. Although the overlap between different transcriptomic methods was, as expected incomplete, this GO term enrichment analysis of the datasets revealed consistency in the functions of the genes that responded to CR. i. qPCR analysis of P. berghei wt and Δkin in independent biological samples. Data presented are mean±sem (wt, n=3/group; Δkin, n=5/group), normalized to AL of the correspondent genotype. Each circle represents 1 mouse. Gene IDs are given without their PBANKA_ prefix. The genes analyzed were experimentally validated in Extended Data Fig. 3d-e and encode proteins related to lipid metabolism, members of transcriptional regulators (ApiAP2), and several transporters.
Extended Data Figure 5
Extended Data Figure 5. PbKIN and PbKIN T616D phosphomimetic mutation.
a. Schematic diagram of yeast SNF1 and human AMPKα showing the conservation of P. falciparum and P. berghei KIN kinase catalytic domain (red). This kinase domain is flanked by an unusually long N-terminal region and a poorly conserved C-terminus, both with no obvious domains. Amino acid sequence alignment of the activation loop reveals a high degree of similarity and the conservation of the T-loop threonine (red line) whose phosphorylation is essential for kinase activity. AID, autoinhibitory domain; KA1, Kinase Associated domain1. b. Model of PbKIN on AMPKα (top) and PbKIN catalytic domain (bottom). The predicted amino acid sequence of PbKIN kinase domain (455-712) was used to generate a model by Phyre using the human AMPK structure (PDB: 4RER). The model is shown in cartoon representation and depicts the small lobe (455-539) in green, the large lobe (540-712) in blue and the T-loop (601-626) in red with the T616 in sticks. An ATP molecule (stick representation) was docked to illustrate the catalytic site with Lysine 489 (stick representation). Both the AID and the KA1 domain were also modeled but it appeared not to be conserved. c. Schematic for the generation of P. berghei KINT616 and KINT616D mutant. Double cross-over recombination at 5’ and 3’ UTR was used to genetically delete endogenous kin and complement with codon-altered kin gene encoding wild-type (KINT616) or phosphomimetic mutation (KINT616D). Codon-altered sequence of Pbkin was obtained from GenScript, which was then used in the site-directed mutagenesis reaction to introduce the T616D mutation. Presence of codon-altered kinT616 and kinT616D was confirmed by sequencing of the locus of the transgenic parasites. Annealing sites for genotyping primers are illustrated and primer sequences are given in Supplementary Table 1. d. Agarose gel image (representative of 2) showing diagnostic PCR products from P. berghei KINT616, KINT616D and parental wild-type. e. Survival of C57BL/6 mice infected by i.p. injection (1×10⁶ iRBC/mouse) of P. berghei KINT616 (n=9) and KINT616D (n=9). f. Complementation of the Δsnf1 yeast mutant with GFP-fused yeast-optimized sequences of N-terminal truncated P. berghei kinT616, kinT616D or yeast snf1 without GFP tag. Truncation is indicated with a t. Growth of transformed Δsnf1 cells in culture, inoculated at a density of 0.05 OD600 in SD medium supplemented with glucose or raffinose as a carbon source and grown for 42h. Shown are OD values obtained in the raffinose condition, normalized to those obtained in glucose condition for each cell line (snf1 n=6, t.kinT616 n=6, t.kinT616D n=6; mean±sem; Mann-Whitney test). g. Western blot analysis of Δsnf1 expressing full length (left) or N-terminal truncated (right) PbKINT616-GFP or PbKINT616D-GFP. Predicted size of full length PbKIN-GFP is 147 kDa and of N-terminal truncated version is 93 kDa. Membranes were probed with anti-GFP antibody. Truncations are indicated with a t. A representative blot from 2 independent lysates is shown.
Extended Data Figure 6
Extended Data Figure 6. Effect of AMPK agonists.
a. Dose-dependent effect of AMPK activators (salicylate and A769662) on P. berghei ANKA that express luciferase (under ama1 schizont-specific promoter). Parasites were cultured for 24 hr with increasing concentrations of the compounds (media supplemented with 20% FBS and 5mM glucose). Analysis of schizont development was performed by measuring luminescence. Values are mean±sem (salicylate, n=5; A769662, n=6). EC50 values determined by using GraphPad Prism non-linear regression variable slope (normalized) analysis. The calculated EC50 values are as follows: salicylate, 2.4±0.9 mM; A769662, 256.5±60.6 µM. b. Dose-dependent effect of A769662 on P. falciparum, P. berghei ANKA wild-type, Δkin and complemented parasites analyzed by microscopy after Giemsa staining (Mann-Whitney test). Boxplots show the data for the following number of schizonts (vehicle, A769662 62.5 and 125 µM): P. falciparum, 59, 18, 48; P. berghei wt, 28, 68, 61; Δkin, 44, 47, 40; Δkin+kin, 34, 57, 37. c. Dose-dependent effect of A769662 and salicylate treatments on P. falciparum for 2 developmental cycles. Synchronized cultures were set at 0.1% initial parasitemia (rings) and analyzed at 48 hr and 96 hr by flow cytometry after SYBR Green labeling of parasite DNA. A new generation of rings was observed at 48 and 96 hr in the treated conditions, suggesting no growth delay. Data (mean±sem) was normalized to the untreated control on each experiment at 48hr or 96hr. The EC50 values (determined as in a) are as follows: 133.1±3.4μM at 48 hr (n=6) and 70.1±18.9μM at 96 hr (n=5) for A769662; 2.2±0.2mM at 48 hr (n=6) and 1.25±0.2mM at 96 hr (n=6) for salicylate. d. qPCR analysis of P. falciparum parasites treated with salicylate for 72 hr (n=2/condition). Data normalized to the untreated control. The genes analyzed correspond to the P. berghei homologues experimentally validated in Extended Data Fig. 3. Gene IDs are shown in the figure without their PF3D7_ prefix. e. Dose-dependent effect of salicylate on other P. berghei ANKA kinase mutants. Boxplot of parasites treated and analyzed as in (a) (Mann-Whitney test). The number of schizonts analyzed for vehicle, 0.6 mM and 1.25mM are as follows: Δnek2, 43, 33, 37; Δcdpk3, 35, 44, 30. f-g. Salicylate effect in vivo. Mice were treated daily with 250mg/kg salicylate (sal) or 0.9% NaCl (vehicle, veh) starting at day 1 after infection. Parasitemia (mean±sem; 2-way ANOVA test) and survival (log-rank Matel-Cox test) of C57BL/6 mice infected by i.p. injection of 1×10⁶ wt (veh n=15; sal n=16), Δkin (veh n=8; sal n=8) and complemented Δkin+kin iRBCs (veh n=10; sal n=10).
Extended Data Figure 7
Extended Data Figure 7. Supplementation studies in vitro and in vivo.
a. Effect of glucose supplementation on salicylate-treated P. falciparum parasites. Ring-stage synchronized cultures were set at 0.1% initial parasitemia in a glucose free medium supplemented with 5 and 25mM glucose. Values in the graph are parasitemia (mean±sem; n=5/condition) determined by flow cytometry after staining with SYBR Green at 48 hr. Salicylate EC50 values were 2.0±0.1 mM and 2.7±0.2 mM for 5 and 25mM glucose, respectively. P value in the figure calculated with 2-way ANOVA test. b. Effect of supplementation with extra glucose, vitamins, essential amino acids (EAA), non-essential (NEAA), leptin and iron (FeSO4) on salicylate- or A769662-treated parasites. P. berghei expressing luciferase at schizont stage were cultured in 20% FBS supplemented medium (5mM glucose, n=5) with increasing concentrations of salicylate and extra glucose (50mM, n=5), vitamins (1x, n=3; 5x, n=2), EAA (100μM, n=3; 500μM, n=2), NEAA (100μM, n=3; 500μM, n=2), and leptin (50ng/ml, n=2; 150ng/ml n=2). FeSO4 was added in the presence of equal amount of ascorbic acid (AA), an iron absorption enhancer. A769662 treatments were conducted in 20% FBS supplemented medium (5mM glucose) and leptin (50ng/ml, n=2; 150ng/ml n=2). Analysis of schizont development was performed by measuring luciferase activity as in Fig. 1f. Values normalized to the vehicle control. Replicates are shown as individual data points for all supplementations except 50mM glucose, AA and salicylate alone, which are shown as mean±sem. Salicylate EC50 values in these experiments were 3.4±0.3 mM and 5.7±1.3 mM for 5 and 50mM glucose, respectively (p=0.0081, 2-way ANOVA test). c. Dose-dependent effect of salicylate and A769662 on P. berghei parasites in the presence of AL or CR sera. Parasites were incubated for 24 hr with increasing concentrations of the compounds in media supplemented with 10% of AL or CR sera (glucose 5mM). Analysis of schizont development was performed by measuring luminescence (A769662, n=3; salicylate, n=5). These compounds appear to have additive effects, suggesting that under CR conditions, A769662/salicylate might activate KIN through distinct and/or complementary mechanisms. This could be related to different binding sites on the kinase, as previously demonstrated for other AMPKs,. d. Boxplot of microscopic analysis of P. berghei ANKA wild-type segmented schizonts obtained in vitro after 24hr maturation in the presence of AL or CR sera. Recombinant leptin was added to the culture medium at the indicated concentration. Total number of schizonts analyzed in 2 independent experiments as follows: AL, 87; CR, 85; AL+Leptin, 69; CR, 86 (Mann-Whitney test). e-g. Effect of glucose supplementation on C57BL/6 male mice in CR or AL. 0.2g/mL of glucose was provided in the drinking water starting on the day of infection. e. Average daily food consumption and water intake for the same group of mice. Blood glucose levels after 20 hr of glucose supplementation. Representative of 2 independent experiments (AL n=5, CR n=4, AL+glucose n=5, CR+glucose n=5). f. Parasitemia of C57BL/6 mice AL or CR and glucose supplemented groups, infected by i.p. injection of 1×10⁶ iRBCs of GFP-expressing P. berghei wild-type parasites. Data represent 1 of 2 independent experiments (n=3/group). Each mouse is plotted as an individual data point. g. qPCR analysis of P. berghei wild-type parasites in AL or CR fed C57BL/6 mice supplemented (diamonds; n=5) or not (circles; n=4) with glucose in drinking water. Shown is parasite relative gene expression in CR normalized to the mean of the correspondent AL condition at day 5 after i.p. infection. Each mouse is plotted as an individual data point. Representative of 2 experiments performed independently. Gene IDs are given without their PBANKA_ prefix as in Extended Data Fig. 3e.
Extended Data Figure 8
Schematic representation of the observed effect of dietary nutrients or AMPK agonists on Plasmodium intraerythrocytic replication. The data supports the idea that parasites can replicate in higher or fewer numbers depending on host nutrient availability. This active parasite response mediated by an AMPKα-related kinase, KIN, which is expected to become active by an increase of the AMP:ATP ratio in parasites facing nutrient deficiency. KIN upstream regulators and downstream targets remain to be determined, as well as other potential molecular factors that might also contribute to this nutrient sensing mechanism.
Figure 1
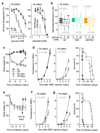
Figure 1. Host diet impacts survival and parasite replication.
a. Body weight change (mean±sd; n=8 mice/group) of C57BL/6 mice under long-term CR, normalized to initial weight. b. Parasitemia (mean±sem; 2-way ANOVA) and c. survival of C57BL/6 mice infected by mosquito bite (squares, AL n=9, CR n=9) or injection of iRBC obtained from AL mice (ANKA, circles, AL n=10, CR n=10; K173, triangles, AL n=8, CR n=9). d. Boxplot of merozoites numbers/schizont (Mann-Whitney) of P. berghei ANKA (AL n=105, CR n=137) and K173 (AL n=70, CR n=50, representative images shown) in mice (d) and P. berghei ANKA (AL n=110, CR n=106) and P. falciparum (AL n=71, CR n=74) after in vitro culture with AL or CR sera (e). f. Luminescence analysis of schizont-specific luciferase-expressing parasites after in vitro maturation (mean±sem; n=5; Mann-Whitney).
Figure 2
Figure 2. PbKIN mediates parasite response to CR.
a. Merozoite numbers (mean±sd) in AL and CR of 15 kinase knockout lines. Parasites in green (Δkin; PBANKA_131800), red (Δpk7; PBANKA_031030) and yellow (Δnek4; PBANKA_061670) do not reduce replication in CR. b. Boxplot of wild-type (AL n=79, CR n=105), Δkin (AL n=62, CR n=85) and Δkin+kin (AL n=108, CR n=124) cultured as in (a) (Mann-Whitney). c. Parasitemia (mean±sem; 2-way ANOVA) of C57BL/6 mice infected with wild-type (AL n=10, CR n=11), Δkin (AL n=13, CR n=12) and Δkin+kin (AL n=10, CR n=6). d. RNA-sequencing analysis of wild-type and Δkin (n=3 mice/group). e. Boxplot of KINT616 (n=204) and KINT616D (n=136) cultured in FBS supplemented medium (Mann-Whitney). f. Parasitemia (mean±sem; 2-way ANOVA) of AL C57BL/6 mice infected with KINT616 (n=9) and KINT616D (n=9). g-h. Complementation of Δsnf1 yeast with kinT616, kinT616D and snf1 shown on agar spots (1 of 2 representative images) and liquid growth in raffinose normalized to glucose (n=6/condition; mean±sem; Mann-Whitney). i. Boxplot of salicylate treatments. Number of schizonts analyzed for vehicle (veh), 0.6 and 1.25mM as follows: P. berghei wt, 74, 87, 56; Δkin, 87, 92, 82; Δkin+kin, 93, 75, 86; P. falciparum, 75, 69, 61 (Mann-Whitney).
Figure 3
Figure 3. Glucose supplementation and re-feeding abolish CR effects.
a. Schizont maturation in glucose-free media supplemented with glucose and AL/CR sera (n=6), or FBS and salicylate (n=5). Data normalized to 5mM glucose (mean±sem; 2-way ANOVA). b. Boxplot of parasites cultured as in (a). Number of schizonts analyzed for AL 5mM, CR 5mM and CR 50mM as follows: wt, 50, 93, 87; Δkin, 84, 71, 41; Δkin+kin, 105, 86, 71 (Mann-Whitney). c-d. Body weight change (mean±sd), parasitemia (mean±sem; 2-way ANOVA) and survival of C57BL/6 mice with and without glucose supplementation (0.2g/mL drinking water) starting on the day of infection (AL n=8, CR n=7, AL+glucose n=8, CR+glucose n=8). e-f. Body weight change (mean±sd; n=9/group) and parasitemia (mean±sem; n=13/group; 2-way ANOVA) of BALB/c mice in CR and after change to AL on day 3 after infection. g. Parasitemia (mean±sem; 2-way ANOVA) and survival of C57BL/6 mice infected with parasites derived from a CR mouse (AL n=14, CR n=12).

Comment in

References

    1. Efeyan A, Comb WC, Sabatini DM. Nutrient-sensing mechanisms and pathways. Nature. 2015;517:302–310. doi: 10.1038/nature14190. - DOI - PMC - PubMed
    1. Chantranupong L, Wolfson RL, Sabatini DM. Nutrient-sensing mechanisms across evolution. Cell. 2015;161:67–83. doi: 10.1016/j.cell.2015.02.041. - DOI - PMC - PubMed
    1. Babbitt SE, et al. Plasmodium falciparum responds to amino acid starvation by entering into a hibernatory state. Proc Natl Acad Sci U S A. 2012;109:E3278–3287. doi: 10.1073/pnas.1209823109. - DOI - PMC - PubMed
    1. Miranda-Saavedra D, Gabaldon T, Barton GJ, Langsley G, Doerig C. The kinomes of apicomplexan parasites. Microbes Infect. 2012;14:796–810. doi: 10.1016/j.micinf.2012.04.007. - DOI - PubMed
    1. Serfontein J, Nisbet RE, Howe CJ, de Vries PJ. Evolution of the TSC1/TSC2-TOR signaling pathway. Sci Signal. 2010;3:ra49. doi: 10.1126/scisignal.2000803. - DOI - PubMed

Publication types

MeSH terms