. 2017 Jul 20;547(7663):355-359.
doi: 10.1038/nature23000. Epub 2017 Jul 5.

Transcription elongation factors represent in vivo cancer dependencies in glioblastoma

Affiliations

Transcription elongation factors represent in vivo cancer dependencies in glioblastoma

Tyler E Miller et al. Nature. .

Abstract

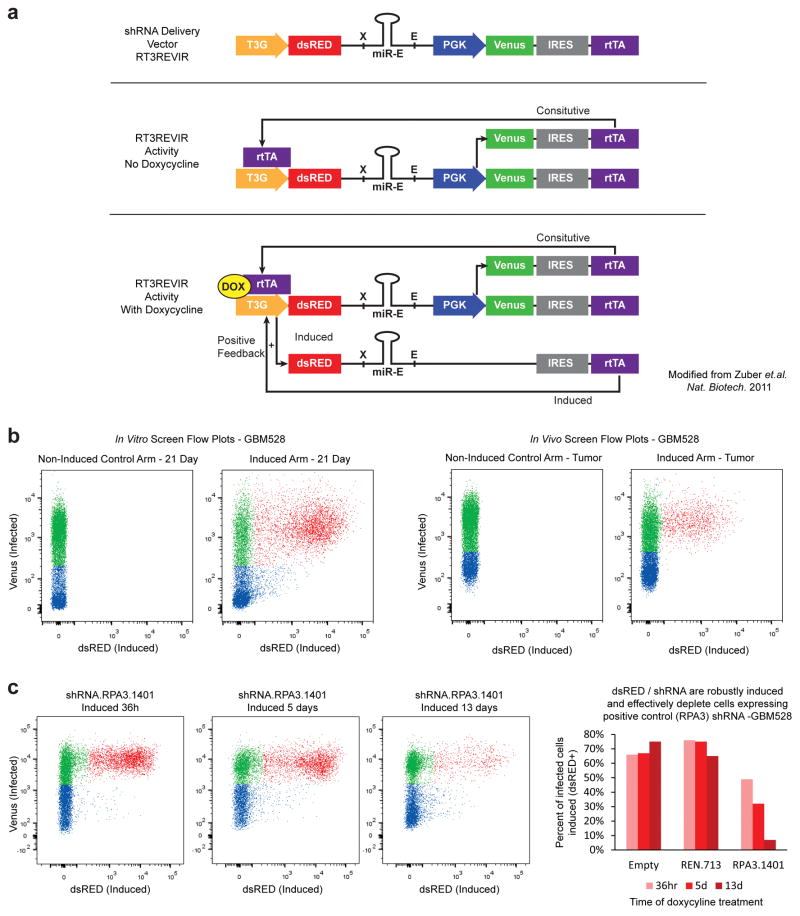
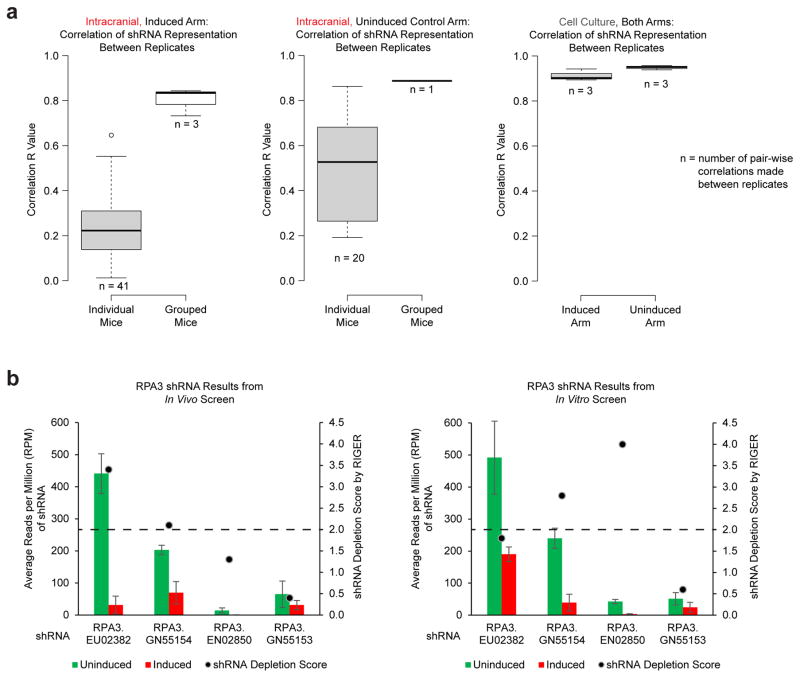
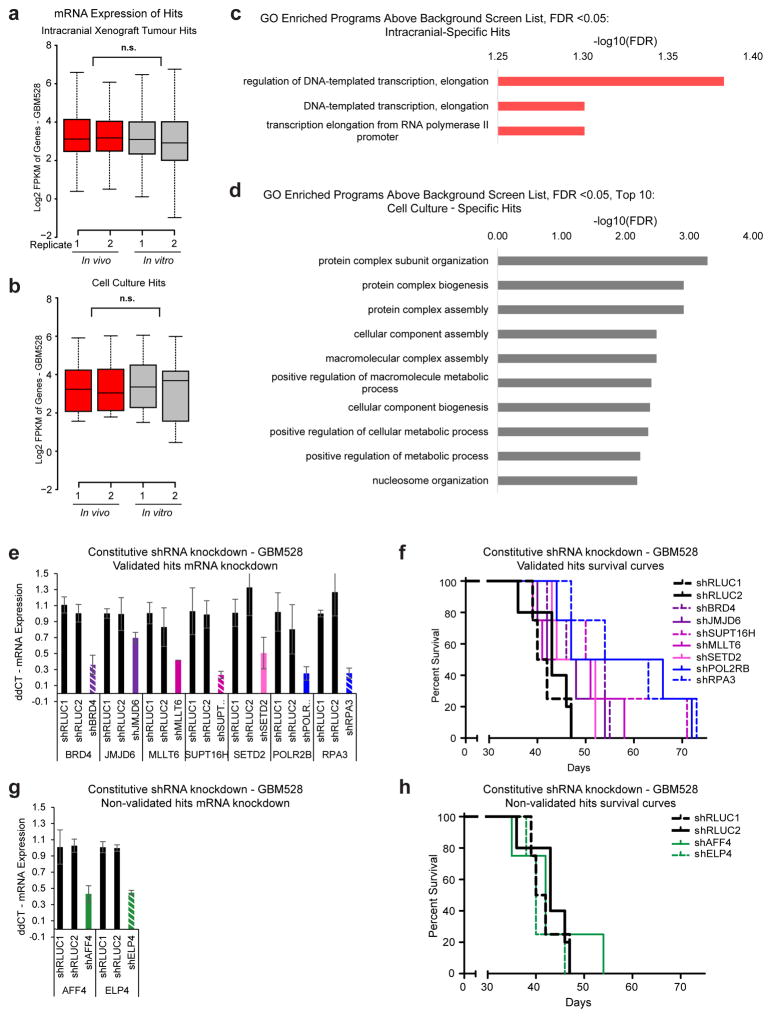
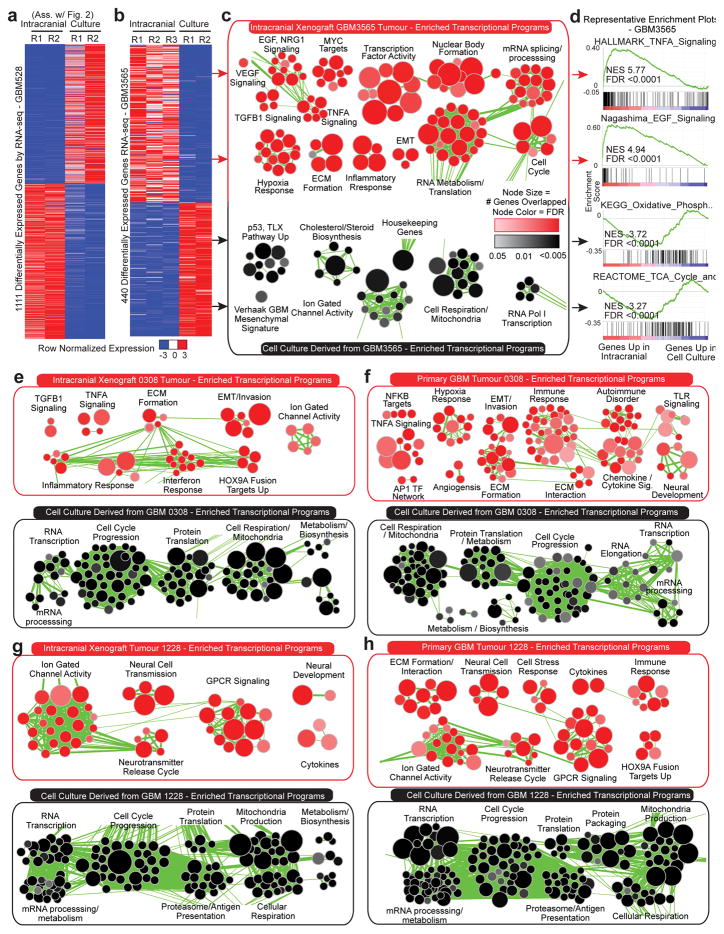
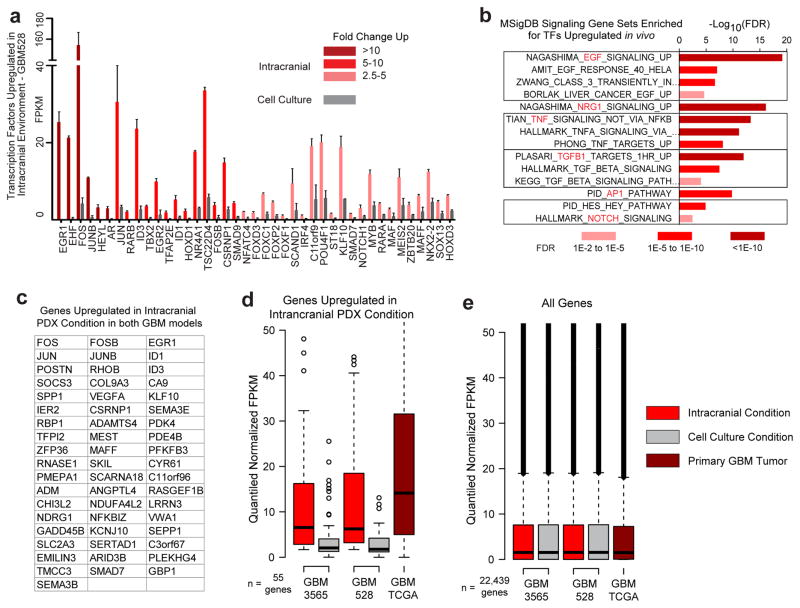
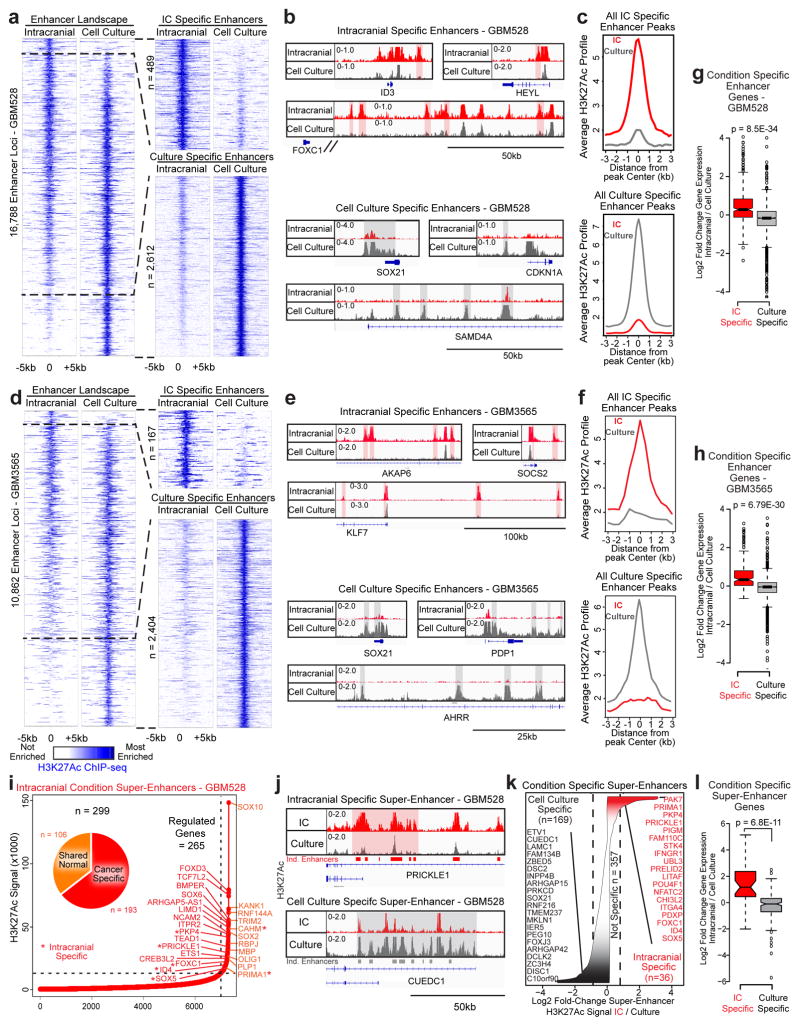
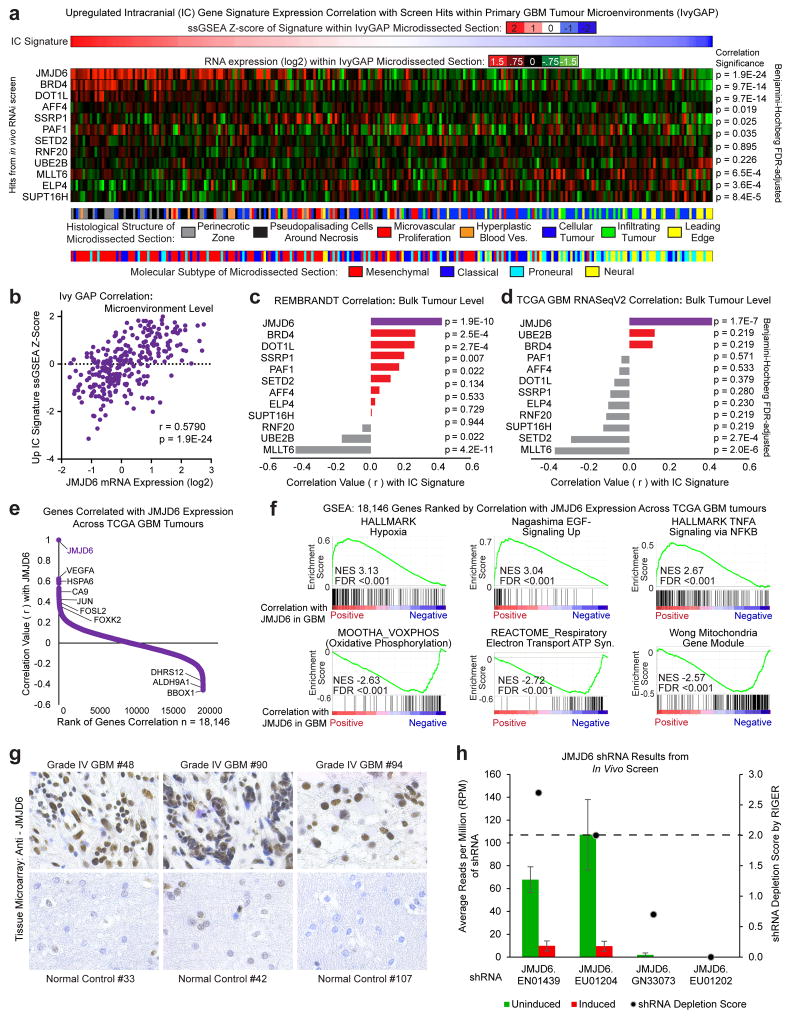
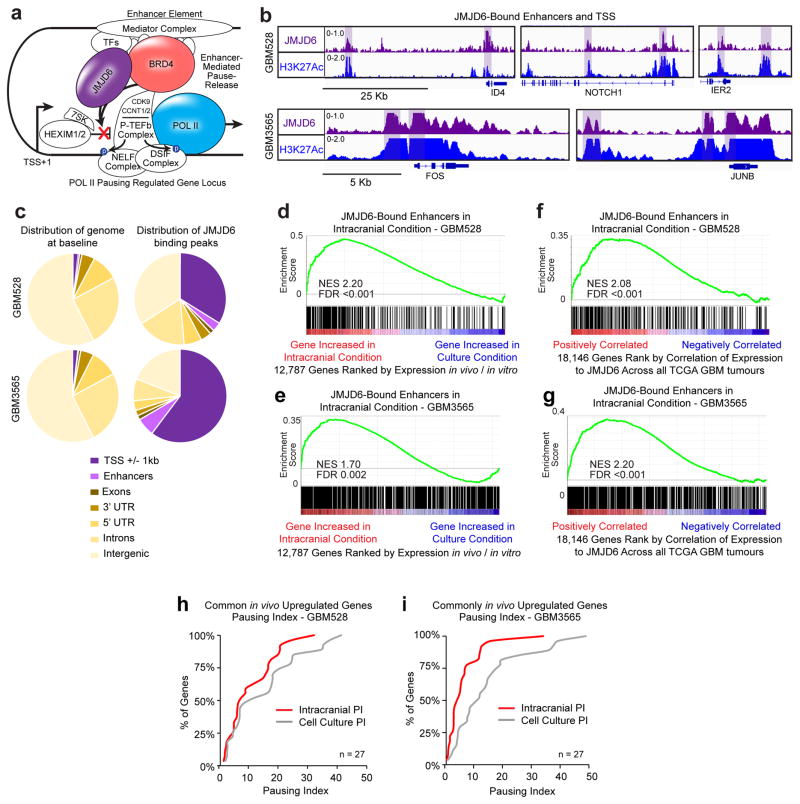
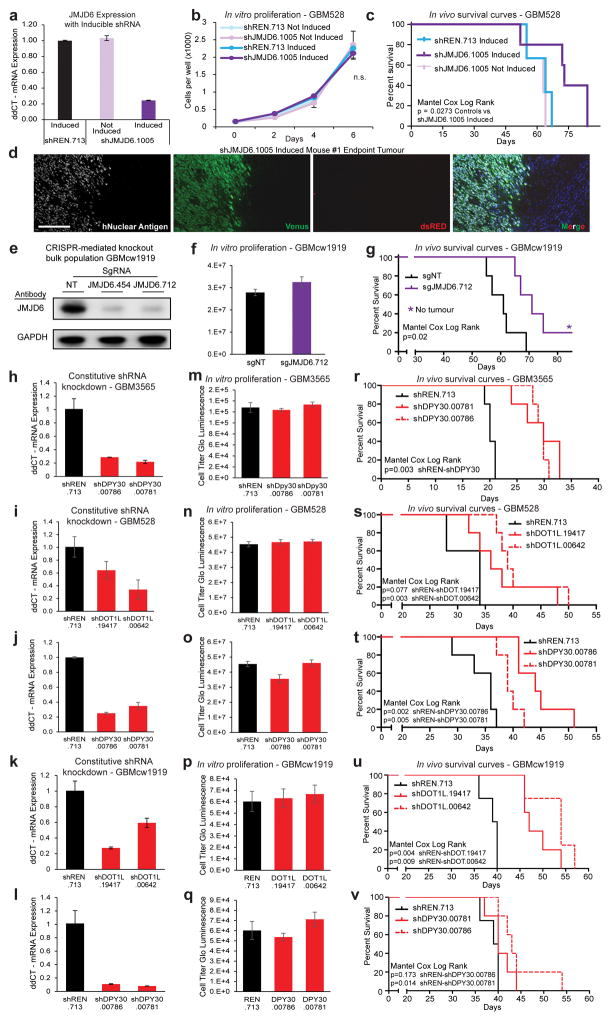
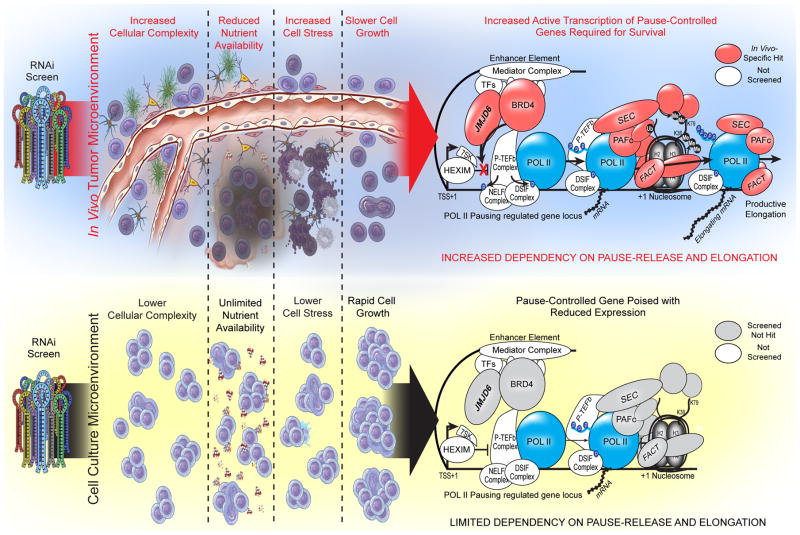
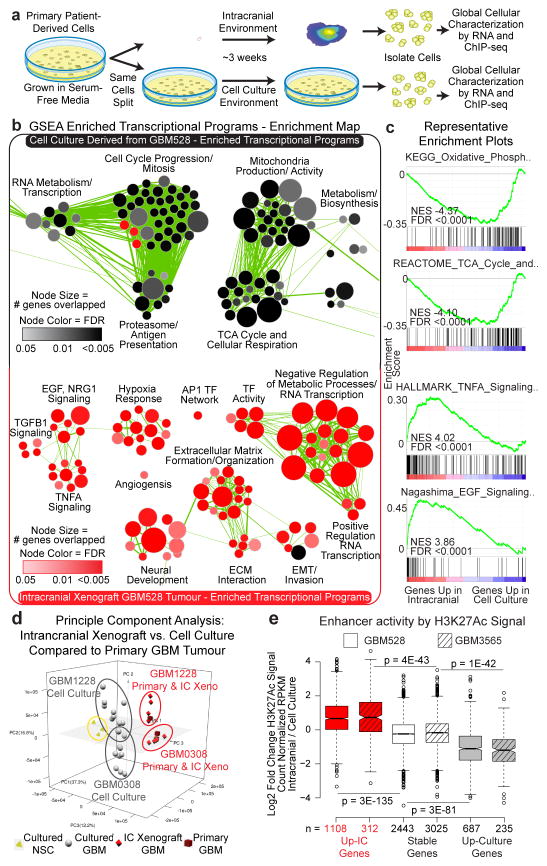
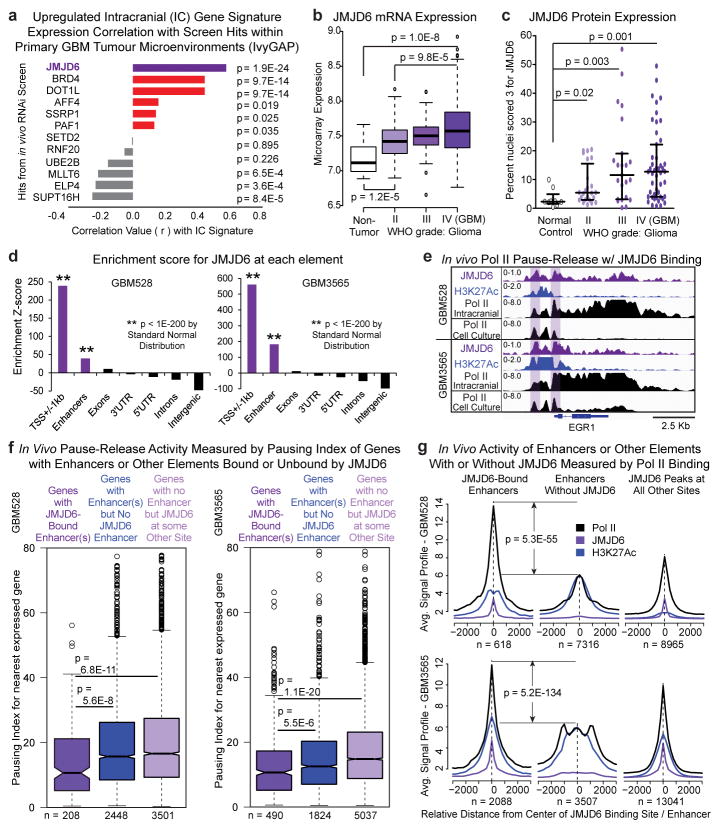
Glioblastoma is a universally lethal cancer with a median survival time of approximately 15 months. Despite substantial efforts to define druggable targets, there are no therapeutic options that notably extend the lifespan of patients with glioblastoma. While previous work has largely focused on in vitro cellular models, here we demonstrate a more physiologically relevant approach to target discovery in glioblastoma. We adapted pooled RNA interference (RNAi) screening technology for use in orthotopic patient-derived xenograft models, creating a high-throughput negative-selection screening platform in a functional in vivo tumour microenvironment. Using this approach, we performed parallel in vivo and in vitro screens and discovered that the chromatin and transcriptional regulators needed for cell survival in vivo are non-overlapping with those required in vitro. We identified transcription pause-release and elongation factors as one set of in vivo-specific cancer dependencies, and determined that these factors are necessary for enhancer-mediated transcriptional adaptations that enable cells to survive the tumour microenvironment. Our lead hit, JMJD6, mediates the upregulation of in vivo stress and stimulus response pathways through enhancer-mediated transcriptional pause-release, promoting cell survival specifically in vivo. Targeting JMJD6 or other identified elongation factors extends survival in orthotopic xenograft mouse models, suggesting that targeting transcription elongation machinery may be an effective therapeutic strategy for glioblastoma. More broadly, this study demonstrates the power of in vivo phenotypic screening to identify new classes of 'cancer dependencies' not identified by previous in vitro approaches, and could supply new opportunities for therapeutic intervention.


Conflict of interest statement

The authors declare no competing financial interests.

Figures

Extended Data Figure 1
Extended Data Figure 1. shRNA delivery vector performance
a, Schematic of the RT3REVIR shRNA delivery vector (Top). Once integrated into cells, a constitutive PGK promoter drives Venus-fluorescent reporter and rtTA through an IRES element, creating an All-in-One inducible vector (Middle). When doxycycline is introduced to cells, it binds to rtTA and drives activity of the 3rd generation TET-inducible promoter. This drives dsRED-fluorescent reporter and shRNA expression. In addition, it drives higher rtTA transcription through the IRES element, creating a positive-feedback loop that increases rtTA expression in the cell resulting in higher expression of inducible elements (Bottom). b, The inducible shRNA delivery vector displays almost no unintended induction. Representative FACS plots from the parallel screen of cells infected with RT3REVIR with and without doxycycline treatment in vitro (Left) and in vivo (Right). c, RT3REVIR robustly expresses shRNAs and depletes cells expressing cell-lethal shRNAs in a competitive proliferation assay. Representative FACS plots over time of cells infected with a positive control shRNA against RPA3 and induced (Left). Quantification of fluorescent cells in the representative competitive proliferation assay. Empty = cells with vector that had no shRNA. REN.713 = cells with vector containing a negative control shRNA targeting the Renilla protein (not expressed in human cells). Bars represent percent of cells actively expressing the shRNA within the total infected population from a single dish (Right).
Extended Data Figure 2
Extended Data Figure 2. Importance of combining multiple mice to achieve increased reproducibility
a, Correlation (r) values between individual mice (41 pair-wise comparisons for induced mice and 20 pair-wise comparisons for control uninduced mice) or of grouped replicates containing multiple mice (3 pair-wise comparisons for triplicate induced arm replicates and 1 pair-wise comparison for the duplicate control uninduced replicates). b, Positive control gene RPA3 was effectively depleted from cell populations in both in vivo and in vitro screens using grouped replicates for the in vivo screen. Four shRNAs targeting RPA3 were included in the shRNA screening library. At least 2 of 4 shRNAs achieved a RIGER depletion score of 2.0 or greater.
Extended Data Figure 3
Extended Data Figure 3. Validation of in vivo screen results
a, b, Average mRNA expression of intracranial-specific (a) or cell culture-specific hits (b) in vivo and in vitro. P-values calculated by 2-sided Mann-Whitney U Test and were >0.05. c, d, Screen hits were analysed for enrichment of GO gene sets, using the screened library gene list as background to control for bias toward chromatin modifiers. All results with an FDR of 0.05 or lower for in vivo-specific hits are presented (c). Top 10 results with an FDR of 0.05 or lower for in vitro-specific hits are presented (d). Significance calculated by Benjamini-Hochberg FDR. e–h, Validation of elongation factor hits by in vivo survival assays. shRNAs from the primary screen were used to transduce GBM528 cells using a constitutive expression vector. Primary screen hits that led to an increase survival with knockdown, with at least 2/4 mice surviving longer than all 9 negative control mice, were considered validated. e, f, Target mRNA knockdown by qRT-PCR (e) and Kaplan-Meier survival curve (f) of validated hits. Black lines and bars represent two independent negative control shRNAs. Purple/pink lines/bars represent validated in vivo-specific hits and blue lines/bars represent validated common hits found in both in vivo and in vitro screen. g, h, Target mRNA knockdown by qRT-PCR (g) and Kaplan-Meier survival curve (h) of primary screen hits that did not validate (green lines/bars).
Extended Data Figure 4
Extended Data Figure 4. Independent models confirm stimulus-controlled and stress response programs upregulated in vivo and in primary tumours
a, b, Genes with average of >2.5 fold expression change between conditions in GBM528 (a) GBM3565 (b) cells, as determined by RNA-seq. GBM528 heatmap associated with Main Figure 2b, c. c, d, Cellular programs enriched by GSEA in cells grown in each condition. Representation of all enriched programs in vitro and in vivo using Enrichment Map (c). Example GSEA plots for cells grown in vitro and in vivo (d). FDR calculated by GSEA software. d–g, In the same manner as in (b–d), GSEA was performed using data generated from 2 independent models by Lee and colleagues on cells grown in vitro vs. in vivo intracranial xenograft tumours (e, g or in vitro vs. the primary glioblastoma from which the cells were derived (f, h). Cellular programs enriched in cells grown in each condition are presented using Enrichment Map. FDR calculated by GSEA software.
Extended Data Figure 5
Extended Data Figure 5. Transcription factors and signalling molecules that drive stimulus-controlled programs consistently upregulated in vivo
a, Transcription factors upregulated in GBM528 cells upon growth in vivo. Values are mean FPKM +/− s.d from biological duplicates. b, Cell signalling programs regulated by pause-control that are enriched for upregulated transcription factors in (a). FDR calculated by MSigDB for enrichment against all genes. c, 55 genes upregulated more than 2.5-fold in both GBM528 and GBM3565 upon growth in vivo. d, Expression of those 55 genes in vivo and in vitro in GBM528 and GBM3565 compared to expression in primary glioblastoma tumours from the TCGA RNAseqV2 database. Data was FPKM quantile normalized across all datasets before plotting. e, All genes in datasets shown to confirm normalization.
Extended Data Figure 6
Extended Data Figure 6. Epigenomic regulation of glioblastoma cells is microenvironment-specific
a–h, Global enhancer landscape of GBM528 (a) and GBM3565 (d) cells in both conditions and microenvironment-specific enhancers. b–h, Browser track examples (b, e), aggregate plots (c, f), and gene expression fold change of target genes (nearest expressed gene) (g, h) of microenvironment-specific enhancer loci from (a, d). i, Super-enhancers identified in vivo in GBM528. j, Browser track examples of condition-specific SEs. k, Super-enhancers specific to each condition were identified. l, Expression of condition-specific super-enhancer target genes. Boxplot P-values calculated by 2-sided Mann-Whitney U Test.
Extended Data Figure 7
Extended Data Figure 7. Prioritization of JMJD6 as lead target
a, Expression across all Ivy GAP samples of gene signature of 55 genes upregulated in vivo in both PDX models (top), and of elongation factor hits (middle). Corresponding histological tumour structure and TCGA molecular subtype of each sample represented below (bottom). The signature and JMJD6 expression is highest in hypoxic regions, which also corresponds to more Mesenchymal-like regions of the tumour. b, Expression correlation dotplot for JMJD6 data represented in (a). c–d, Expression correlation of each elongation factor hit with gene signature of 55 genes upregulated in vivo in both PDX models across all REMBRANDT (c) and TCGA (d) Glioblastoma tumours (bulk tumour expression. Ivy Gap data in (a) and (Main Figure 3a) is microenvironment-specific expression). P-value (a–d) by FDR-adj. B–H procedure. e, JMJD6 mRNA-seq correlation with each gene across TCGA GBM tumours. f, Example plots from GSEA of using the gene correlations in (b) and a pre-rank list. e, Representative images from tissue microarray analysis of JMJD6 protein expression in (Main Fig. 3c). h, Primary screen results for the 4 shRNAs targeting JMJD6. Only 2 of the 4 shRNAs were represented in the library at appreciable levels, and both led to a RIGER depletion score of greater than 2. Values are median RPM +/− s.d. of 3 biological replicates for induced populations and 2 biological replicates for the uninduced population.
Extended Data Figure 8
Extended Data Figure 8. JMJD6 regulates enhancer mediated pause-release in GBM
a, Known role of JMJD6 in transcription pause-release. In HEK293T and HeLa cells, JMJD6 acts with bromodomain containing 4 (BRD4) as a key activator of enhancer-mediated pause-release at genes controlled by Pol II pausing. Upon enhancer activation, JMJD6 demethylates 7SK RNA releasing positive transcription elongation factor (P-TEFb) inhibition from the 7SK/HEXIM complex b, Browser tracks of JMJD6 at enhancers and TSS’s. c, Global distribution of genomic elements as determined by Hg19 reference genome and H3K27Ac ChIP-seq (left) and global distribution of JMJD6 binding peaks per genomic element as determined by JMJD6 ChIP-seq (right). Enrichments shown in (Main Fig. 3d). d–g, GSEA enrichment plots of genes with JMJD6-bound enhancers in the GBM528 (d) or GBM3565 (e) PDX model against differential expression of genes between in vivo and in vitro conditions (expression from Main Fig. 2b for GBM528 and Ext. Data Fig. 4a for GBM3565). GSEA enrichment plots of genes with JMJD6-bound enhancers in the GBM528 (f) or GBM3565 (g) PDX model against gene correlations with JMJD6 in TCGA tumours (correlations from Ext. Data Fig. 7e). h, i, Distribution of pausing-index of the common in vivo upregulated genes from Extended Data Fig. 5c for which pausing index could be determined in GBM528 (h) and GBM3565 (i). All P-values calculated by 2-sided Mann-Whitney U Test.
Extended Data Figure 9
Extended Data Figure 9. Validation of JMJD6 and other hits in multiple PDX models of glioblastoma
a, JMJD6 mRNA expression by qRT-PCR after inducible shRNA knockdown of JMJD6. b, In vitro proliferation and c, in vivo survival compared to uninduced and induced non-targeting controls. Values are mean +/− s.d. of 3 technical replicates. d, Endpoint tumours harvested from the induced arm of (c) stained to show human tumour cells (human nuclear antigen) that harbour a JMJD6 shRNA (Venus+) or harbour and express a JMJD6 shRNA (Venus+dsRED+). The vast majority of tumour cells at endpoint had silenced the shRNA (Venus+dsRED−). Scale bar: 200 μM. e, CRISPR mediated knockout of JMJD6 in a bulk population of GBMcw1919 cells in vitro. f–g, Parallel in vitro proliferation assay (f) and in vivo survival assay (g) of cells from (e). h–l, Constitutive shRNA knockdown of DOT1L and DPY30 in vitro. m–v, Parallel in vitro proliferation assays (m–q) and in vivo survival assays (r–v) of cells from (h–l), respectively. Error bars of bar graphs +/− s.d. of at least triplicates.
Extended Data Figure 10
Extended Data Figure 10. Summary Figure
Overview summary of results. The in vivo tumour microenvironment, both in primary glioblastoma tumours and intracranial xenograft tumours, is complex and stressful for cells. Tumour cells must appropriately interact with and respond to a large number of other cells, both cancerous and non-cancerous, in order to survive. They also must activate response pathways to survive in the face of reduced nutrient availability, including hypoxic and low glucose conditions, and in the face of increased cell stress due to immune regulators, and debris and signalling from apoptotic cells. Thus, slower growth is seen as the cells expend energy on responding to these microenvironmental stimuli in order to survive. Due to the large number of pause-controlled genes needed to appropriately respond to the cell stresses in vivo, cells are dependent on transcriptional pause-release and elongation. In contrast, cell culture conditions are optimized to reduce cell stress and drive growth by providing a surplus of all required nutrients for cell growth. Cells are largely homogenous and cancerous. Together, these in vitro conditions lead to rapid cell growth and little need for pause-controlled pathways that respond to environmental stimuli and stress. Therefore, in vitro cells are not as dependent on transcriptional pause-release and elongation for growth and survival.
Figure 1
Figure 1. Parallel in vivo and in vitro screen identifies environment-specific cancer dependencies and reveals transcriptional pause-release and elongation as an in vivo-specific target
a, Schematic diagram depicting screen. b, Plot of score of 2nd best shRNA targeting each gene in each screen as calculated by RIGER. Boxes indicate target gene ‘hits’ that caused depletion of the cell population when inhibited. c, Venn diagram of hits from each screen. d, Enrichment of hits in GO gene sets, using the screened library gene list as background to control for bias toward chromatin modifiers. Significance calculated by Benjamini-Hochberg FDR. e, Schematic of transcription elongation machinery, highlighting in vivo-specific hits.
Figure 2
Figure 2. Transcription of pause-controlled programs is upregulated in the in vivo tumour microenvironment
a, Workflow for global analysis of glioblastoma cells. b, Cellular programs enriched by GSEA in cells grown in each condition represented using Enrichment Map. c, Example GSEA plots. FDR calculated by GSEA software. d, Principle component analysis of matched glioblastoma cells in primary tumours, intracranial tumours and cell culture. e, Fold change of H3K27Ac signal at enhancers of genes with >2.5 fold mRNA expression change between conditions, or 0.9–1.1 fold change (stable). P-values by 2-sided Mann-Whitney (M-W) U Test.
Figure 3
Figure 3. JMJD6 is top hit and regulates enhancer mediated pause-release in GBM
a, Correlation across all Ivy GAP samples of elongation factor hits with gene signature of genes upregulated in vivo in both PDX models. P-value by FDR-adj. B-H procedure. b, JMJD6 mRNA expression across all gliomas in REMBRANDT database. c, Tissue microarray analysis of JMJD6 protein expression in over 100 gliomas. d, Global enrichment Z-scores of JMJD6 binding by JMJD6 ChIP-seq. e, Browser track example for (f). Pausing index of target genes (nearest expressed gene) (f) or aggregate plots of ChIP-seq signal (g) of JMJD6-bound and unbound enhancers, and of JMJD6-bound sites outside of enhancers. P-values (b–c, f–g) by 2-sided M-W U Test.
Figure 4
Figure 4. JMJD6 and other hits are potential therapeutic targets in GBM
a, CRISPR mediated knockout of JMJD6 in GBM528 cells. b–c, Parallel in vitro proliferation assay (b) and in vivo survival assay (c) of cells from (a). d, Constitutive shRNA knockdown of DOT1L. e–f, Parallel in vitro proliferation assay (e) and in vivo survival assay (f) of cells from (d). Error bars of bar graphs +/− s.d. of at least triplicates.

Comment in

References

    1. Stupp R, et al. Effects of radiotherapy with concomitant and adjuvant temozolomide versus radiotherapy alone on survival in glioblastoma in a randomised phase III study: 5-year analysis of the EORTC-NCIC trial. The lancet oncology. 2009;10:459–466. doi: 10.1016/S1470-2045(09)70025-7. - DOI - PubMed
    1. Zuber J, et al. Toolkit for evaluating genes required for proliferation and survival using tetracycline-regulated RNAi. Nature biotechnology. 2011;29:79–83. doi: 10.1038/nbt.1720. - DOI - PMC - PubMed
    1. Zuber J, et al. RNAi screen identifies Brd4 as a therapeutic target in acute myeloid leukaemia. Nature. 2011;478:524–528. doi: 10.1038/nature10334. - DOI - PMC - PubMed
    1. Fellmann C, et al. An optimized microRNA backbone for effective single-copy RNAi. Cell reports. 2013;5:1704–1713. doi: 10.1016/j.celrep.2013.11.020. - DOI - PubMed
    1. Dawson MA, Kouzarides T. Cancer epigenetics: from mechanism to therapy. Cell. 2012;150:12–27. doi: 10.1016/j.cell.2012.06.013. - DOI - PubMed

Publication types

MeSH terms

Substances