. 2017 Jul 5;12(7):e0179741.
doi: 10.1371/journal.pone.0179741. eCollection 2017.

HMGB3 promotes growth and migration in colorectal cancer by regulating WNT/β-catenin pathway

Affiliations

HMGB3 promotes growth and migration in colorectal cancer by regulating WNT/β-catenin pathway

Zheying Zhang et al. PLoS One. .

Abstract

Colorectal cancer (CRC) is the third leading cause of cancer-related deaths and a major health problem. High mobility group box 3 (HMGB3), a member of the high-mobility group box (HMGB) family, was reported to be over-expressed in gastric carcinoma and bladder cancer. However, the function of HMGB3 in CRC remains unclear. Here, we found that HMGB3 was up-regulated in CRC at both mRNA and protein levels. qRT-PCR results showed that high expression of HMGB3 had positive correlation with serosal invasion, lymph metastasis, and tumor-node-metastasis (TNM) stage in CRC patient. Functional experiments showed that HMGB3 can promote CRC cells proliferation and migration in vitro. Moreover, we found HMGB3 can active WNT/β-catenin pathway to increase the expression level of c-Myc and MMP7. These results may be the reason for HMGB3 oncogene role in CRC. In summary, our data indicated that HMGB3 may serve as an oncoprotein and could be used as a potential prognostic marker in CRC.


Conflict of interest statement

Competing Interests: The authors have declared that no competing interests exist.

Figures

Fig 1
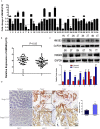
Fig 1. Expression levels of HMGB3 mRNA and protein are increased in CRC tissues.
(A) qRT-PCR analysis of HMGB3 expression in 34 paired CRC tissues and adjacent normal tissues. HMGB3 expression level was normalized to GAPDH and the results were presented as the fold-change in tumor tissues relative to the matched adjacent normal tissues. Error bars indicate mean ± standard deviation of 3 independent experiments. (B) The value of ΔCt was used to show the expression level of HMGB3 (ΔCt = CtHMGB3 –CtGAPDH) in the 34 paired human CRC tissues (T) and adjacent normal tissues (N) (p < 0.05). The differences between tumor group and normal group were tested by using a Paired-samples t-test. (C) Western blot analysis of HMGB3 protein expression in seven pair CRC tissues compared with the normal tissues. The differences between tumor group and normal group were tested by using a Independent-Samples t-test. (D) Representative HMGB3 staining in CRC specimens. Left, normal tissue, Scale bars = 50 μm. Middle, CRC tissues, Scale bars = 50μm. Right, CRC tissues, Scale bars = 20 μm. The HMGB3 index was calculated as that the number of HMGB3 positive cells divided by the number of total cells ×100% (magnification, ×200). The differences between tumor group and normal group were tested by using a Independent-Samples t-test. Error bars represent the mean ± SD of 5 different fields. ***, p < 0.001.
Fig 2
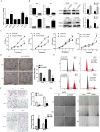
Fig 2. HMGB3 promote CRC cells proliferation and migration in vitro.
(A) qRT-PCR analysis of HMGB3 expression in six CRC cell lines. The differences between independent experimental groups were tested by using Independent-Samples t-test. Error bars indicate mean ± SD of 3 independent experiments. ***, p < 0.001. (B) qRT-PCR and western blot analyses of HMGB3 mRNA and protein levels after the transfection of the sh-HMGB3 or HMGB3 plasmid. The differences between independent experimental groups were tested by using Independent-Samples t-test. ***, p < 0.001. (C) Effects of sh-HMGB3 and oe-HMGB3 on cell proliferation were determined by CCK8 cell proliferation assay. Error bars represent the mean ± SD of 5 independent experiments. The differences between independent experimental groups were tested by using Independent-Samples t-test. ***, p < 0.001. (D) The proliferation ability was determined by colony formation assay of the cell SW620 and HT29 after inhibiting the expression of HMGB3. The bar chart represents the colony number. Error bars represent the mean ± SD of 3 independent experiments. The differences between independent experimental groups were tested by using Independent-Samples t-test. **, p < 0.01; ***, p < 0.001. (E) Cell cycle G1 arrest after knocking down HMGB3 measured by flow cytometry. (F) The migration capacity was determind by transwell assays. The bar chart represents the migration cell numbers. Error bars represent the mean ± SD of 5 different field. The differences between independent experimental groups were tested by using Independent-Samples t-test. ***, p < 0.001. (G) Effects of sh-HMGB3 or oe-HMGB3 on cell migration ability were determined by Wound healing assay.
Fig 3
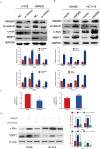
Fig 3. HMGB3 promotes CRC cell growth and migration through WNT/β-catenin pathway.
Western blot was performed to detect HMGB3, β-catenin, c-Myc, and MMP7 expression after hmgb3 knocking down (A) or up-regulating (B). Data are mean ± SD for triplicate samples. GAPDH served as the loading control. The differences between independent experimental groups were tested by using Independent-Samples t-test. (C) Cells were transfected with TOP-Flash or control FOP-Flash reporter to determine reporter activities 48h later. The values of TOP-Flash and FOP-Flash were normalized to the value of pRL-SV40, the bar chart represented the ratios of TOP/FOP. Values are mean ± SD for triplicate samples. The differences between independent experimental groups were tested by using Independent-Samples t-test. *, p < 0.05; **, p < 0.01. (D) The expression of c-Myc, MMP7 and β-actin in SW480 and HCT116 cells were detected by western blot after increasing the expression of HMGB3 or increasing the expression of HMGB3 but inhibited β-catenin expression. β-actin served as the loading control. Error bars represent the mean ± SD of 3 independent experiments. The differences between independent experimental groups were tested by using Independent-Samples t-test. **, p < 0.01; ***, p < 0.001.

Similar articles

Cited by

References

    1. Herszenyi L, Tulassay Z. Epidemiology of gastrointestinal and liver tumors. Eur Rev Med Pharmacol Sci. 2010; 14: 249–258. - PubMed
    1. Emmons KM, Burns White K, Benz EJ. Development of an integrated approach to cancer disparities: one cancer center's experience. Cancer Epidemiol Biomarkers Prev. 2007; 16: 2186–2192. doi: 10.1158/1055-9965.EPI-07-0211 - DOI - PubMed
    1. Center MM, Jemal A, Smith RA, Ward E. Worldwide variations in colorectal cancer. CA Cancer J Clin. 2009; 59: 366–378. doi: 10.3322/caac.20038 - DOI - PubMed
    1. Bray F, Ren JS, Masuyer E, Ferlay J. Global estimates of cancer prevalence for 27 sites in the adult population in 2008. Int J Cancer. 2013; 132: 1133–1145. doi: 10.1002/ijc.27711 - DOI - PubMed
    1. Calon A, Espinet E, Palomo-Ponce S, Tauriello DV, Iglesias M, Cespedes MV, et al. Dependency of colorectal cancer on a TGF-beta-driven program in stromal cells for metastasis initiation. Cancer Cell. 2012; 22: 571–584. doi: 10.1016/j.ccr.2012.08.013 - DOI - PMC - PubMed