

Treatment with integrase inhibitor suggests a new interpretation of HIV RNA decay curves that reveals a subset of cells with slow integration
- PMID: 28678879
- PMCID: PMC5513547
- DOI: 10.1371/journal.ppat.1006478
Treatment with integrase inhibitor suggests a new interpretation of HIV RNA decay curves that reveals a subset of cells with slow integration
Abstract
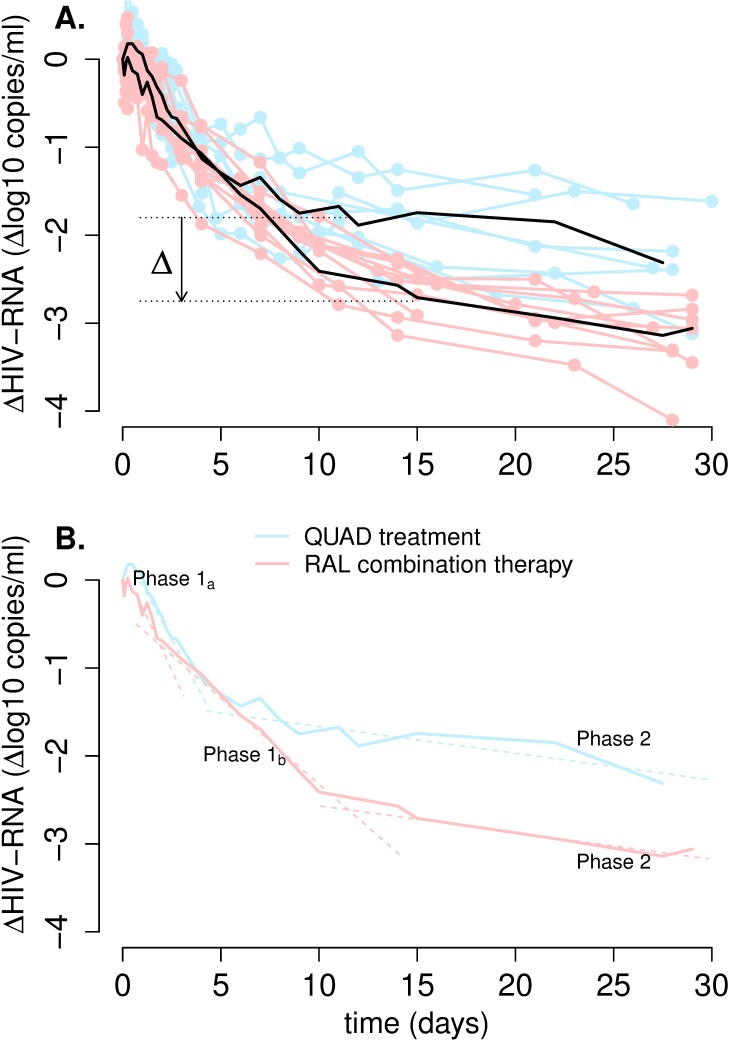
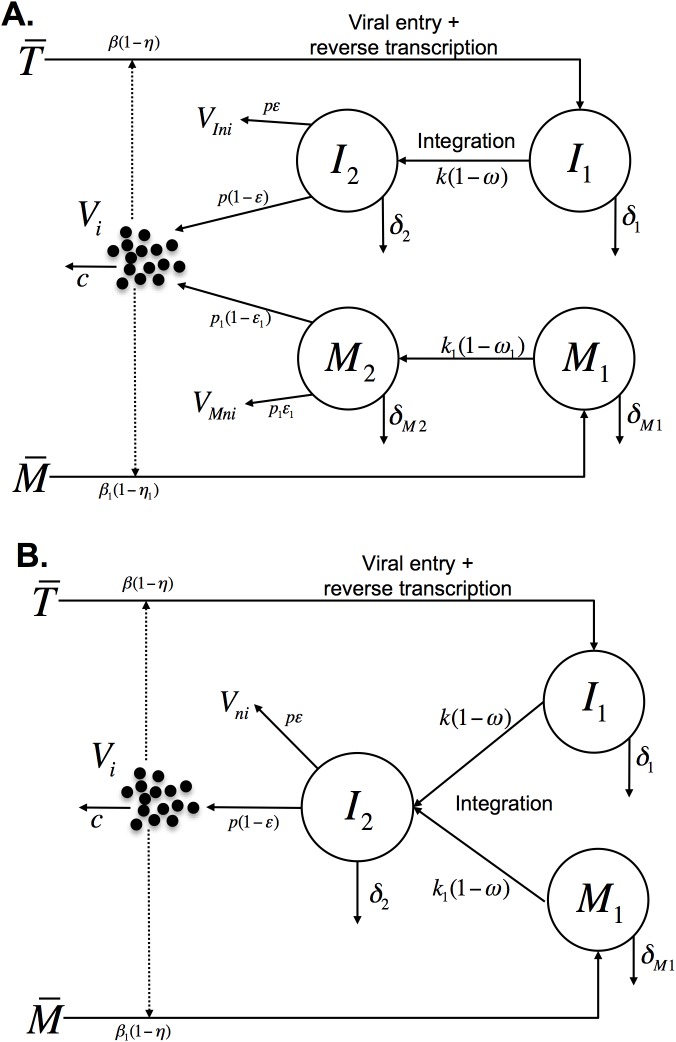
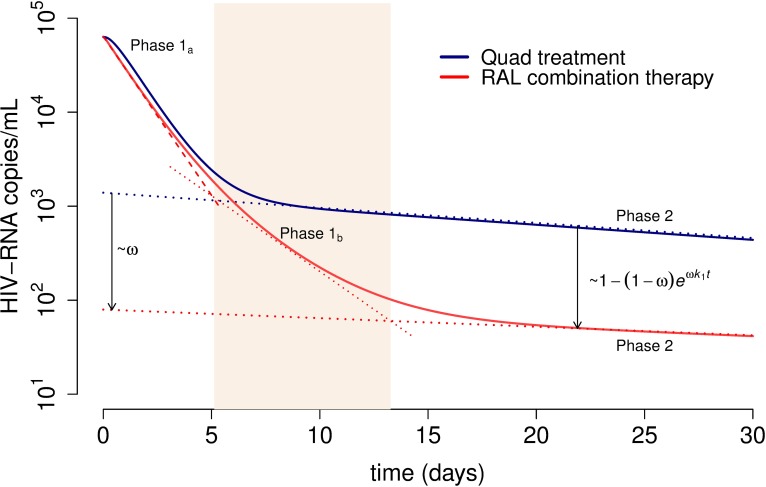
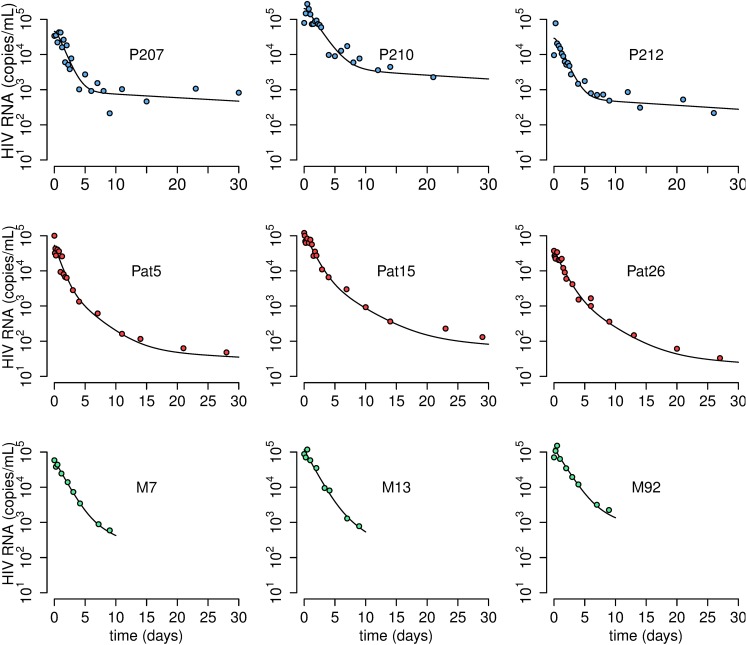
The kinetics of HIV-1 decay under treatment depends on the class of antiretrovirals used. Mathematical models are useful to interpret the different profiles, providing quantitative information about the kinetics of virus replication and the cell populations contributing to viral decay. We modeled proviral integration in short- and long-lived infected cells to compare viral kinetics under treatment with and without the integrase inhibitor raltegravir (RAL). We fitted the model to data obtained from participants treated with RAL-containing regimes or with a four-drug regimen of protease and reverse transcriptase inhibitors. Our model explains the existence and quantifies the three phases of HIV-1 RNA decay in RAL-based regimens vs. the two phases observed in therapies without RAL. Our findings indicate that HIV-1 infection is mostly sustained by short-lived infected cells with fast integration and a short viral production period, and by long-lived infected cells with slow integration but an equally short viral production period. We propose that these cells represent activated and resting infected CD4+ T-cells, respectively, and estimate that infection of resting cells represent ~4% of productive reverse transcription events in chronic infection. RAL reveals the kinetics of proviral integration, showing that in short-lived cells the pre-integration population has a half-life of ~7 hours, whereas in long-lived cells this half-life is ~6 weeks. We also show that the efficacy of RAL can be estimated by the difference in viral load at the start of the second phase in protocols with and without RAL. Overall, we provide a mechanistic model of viral infection that parsimoniously explains the kinetics of viral load decline under multiple classes of antiretrovirals.
Conflict of interest statement
EFC has nothing to declare. AA has received funding from Gilead Sciences for an investigator initiated study. JWM is a consultant for Gilead Sciences and owns shares in Co-Crystal, Inc. DRK is a consultant for Merck Sharp & Dohme. ASP has been a consultant for Merck Sharp & Dohme. RMR has nothing to declare. None of these have any direct bearing on the current manuscript.
Figures
Similar articles
-
[Potential of integrase inhibitors to deplete HIV reservoirs or prevent their replenishment].Enferm Infecc Microbiol Clin. 2008 Nov;26 Suppl 12:17-22. doi: 10.1016/s0213-005x(08)76568-6. Enferm Infecc Microbiol Clin. 2008. PMID: 19572421 Review. Spanish.
-
Early HIV RNA decay during raltegravir-containing regimens exhibits two distinct subphases (1a and 1b).AIDS. 2015 Nov 28;29(18):2419-26. doi: 10.1097/QAD.0000000000000843. AIDS. 2015. PMID: 26558541 Free PMC article.
-
Dynamics of an HIV Model with Multiple Infection Stages and Treatment with Different Drug Classes.Bull Math Biol. 2016 Feb;78(2):322-49. doi: 10.1007/s11538-016-0145-5. Epub 2016 Feb 2. Bull Math Biol. 2016. PMID: 26842389
-
Exploring an alternative explanation for the second phase of viral decay: Infection of short-lived cells in a drug-limited compartment during HAART.PLoS One. 2018 Jul 17;13(7):e0198090. doi: 10.1371/journal.pone.0198090. eCollection 2018. PLoS One. 2018. PMID: 30016329 Free PMC article.
-
Efficacy and Tolerability of Integrase Inhibitors in Antiretroviral-Naive Patients.AIDS Rev. 2015 Jul-Sep;17(3):171-85. AIDS Rev. 2015. PMID: 26450805 Review.
Cited by
-
Integrase inhibitor-based regimens result in more rapid virologic suppression rates among treatment-naïve human immunodeficiency virus-infected patients compared to non-nucleoside and protease inhibitor-based regimens in a real-world clinical setting: A retrospective cohort study.Medicine (Baltimore). 2018 Oct;97(43):e13016. doi: 10.1097/MD.0000000000013016. Medicine (Baltimore). 2018. PMID: 30412140 Free PMC article.
-
Longitudinal HIV sequencing reveals reservoir expression leading to decay which is obscured by clonal expansion.Nat Commun. 2019 Feb 13;10(1):728. doi: 10.1038/s41467-019-08431-7. Nat Commun. 2019. PMID: 30760706 Free PMC article.
-
Why the HIV Reservoir Never Runs Dry: Clonal Expansion and the Characteristics of HIV-Infected Cells Challenge Strategies to Cure and Control HIV Infection.Viruses. 2021 Dec 14;13(12):2512. doi: 10.3390/v13122512. Viruses. 2021. PMID: 34960781 Free PMC article. Review.
-
Pre-existing resistance in the latent reservoir can compromise VRC01 therapy during chronic HIV-1 infection.PLoS Comput Biol. 2020 Nov 30;16(11):e1008434. doi: 10.1371/journal.pcbi.1008434. eCollection 2020 Nov. PLoS Comput Biol. 2020. PMID: 33253162 Free PMC article.
-
Dolutegravir/Abacavir/Lamivudine in Acute HIV-1 Results in Rapid Suppression and Restoration of CD4 T-cell Subsets Without Accelerated Decay of Latent HIV-1.Open Forum Infect Dis. 2025 Apr 24;12(5):ofaf247. doi: 10.1093/ofid/ofaf247. eCollection 2025 May. Open Forum Infect Dis. 2025. PMID: 40390705 Free PMC article. Clinical Trial.
References
-
- Perelson AS. Modelling viral and immune system dynamics. Nat Rev Immunol. 2002;2: 28–36. doi: 10.1038/nri700 - DOI - PubMed
-
- Murray JM, Kelleher AD, Cooper DA. Timing of the components of the HIV life cycle in productively infected CD4+ T cells in a population of HIV-infected individuals. J Virol. 2011;85: 10798–10805. doi: 10.1128/JVI.05095-11 - DOI - PMC - PubMed
-
- Perelson AS, Ribeiro RM. Modeling the within-host dynamics of HIV infection. BMC Biol. 2013;11: 96 doi: 10.1186/1741-7007-11-96 - DOI - PMC - PubMed
-
- Perelson AS, Essunger P, Cao Y, Vesanen M, Hurley A, Saksela K, et al. Decay characteristics of HIV-1-infected compartments during combination therapy. Nature. 1997;387: 188–191. doi: 10.1038/387188a0 - DOI - PubMed
-
- Perelson AS, Neumann AU, Markowitz M, Leonard JM, Ho DD. HIV-1 dynamics in vivo: virion clearance rate, infected cell life-span, and viral generation time. Science. 1996;271: 1582–1586. doi: 10.1126/science.271.5255.1582 - DOI - PubMed
Publication types
MeSH terms
Substances
Grants and funding
LinkOut - more resources
Full Text Sources
Other Literature Sources
Medical
Research Materials
