. 2017 Nov;57(5):615-625.
doi: 10.1165/rcmb.2016-0364OC.

Pharmacological Inhibition of mTOR Kinase Reverses Right Ventricle Remodeling and Improves Right Ventricle Structure and Function in Rats

Affiliations

Pharmacological Inhibition of mTOR Kinase Reverses Right Ventricle Remodeling and Improves Right Ventricle Structure and Function in Rats

Andressa Pena et al. Am J Respir Cell Mol Biol. 2017 Nov.

Abstract

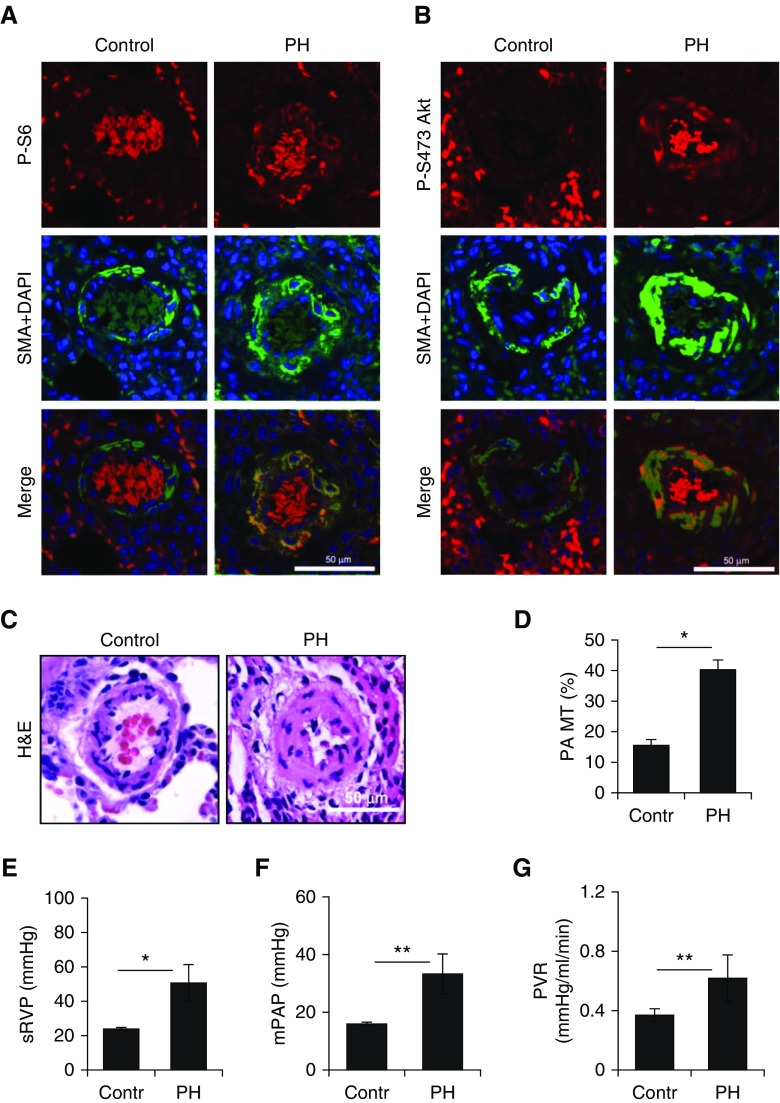
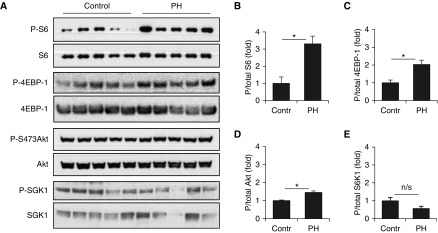
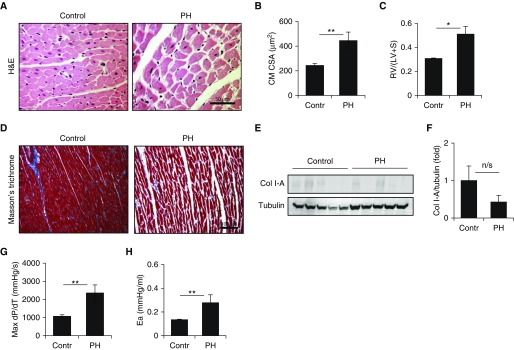
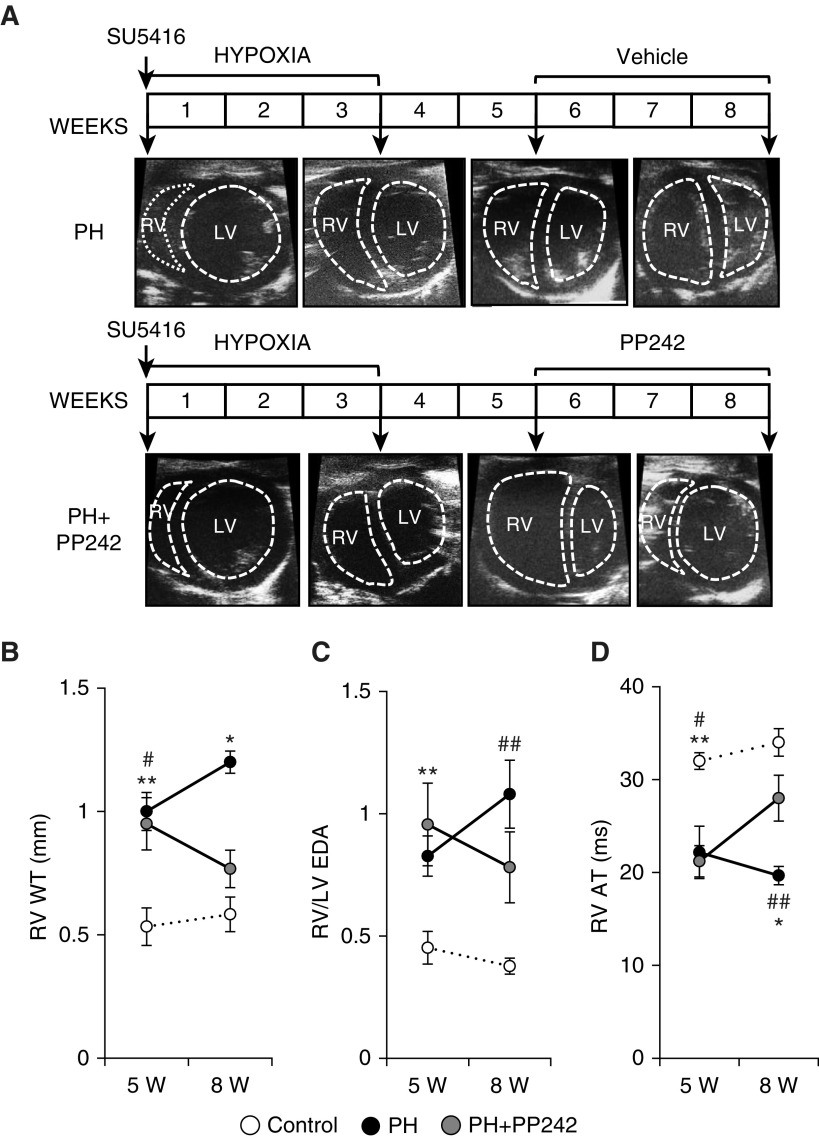
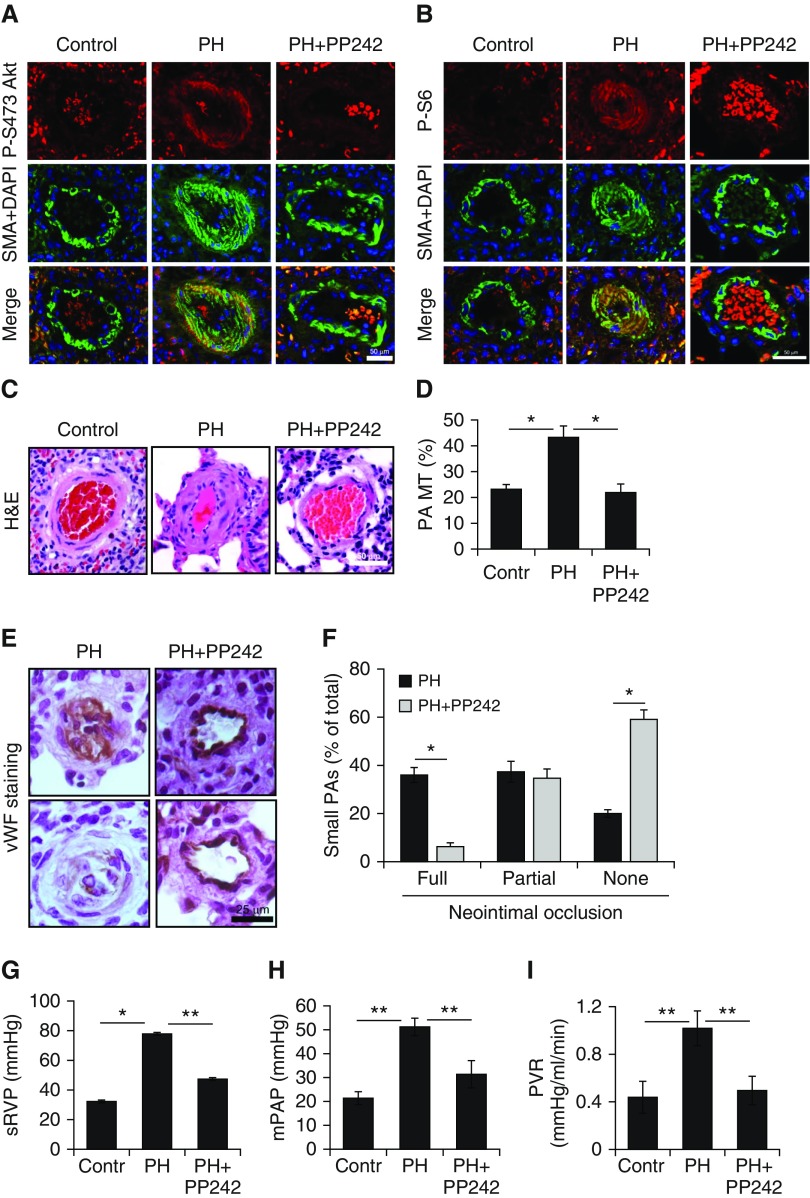
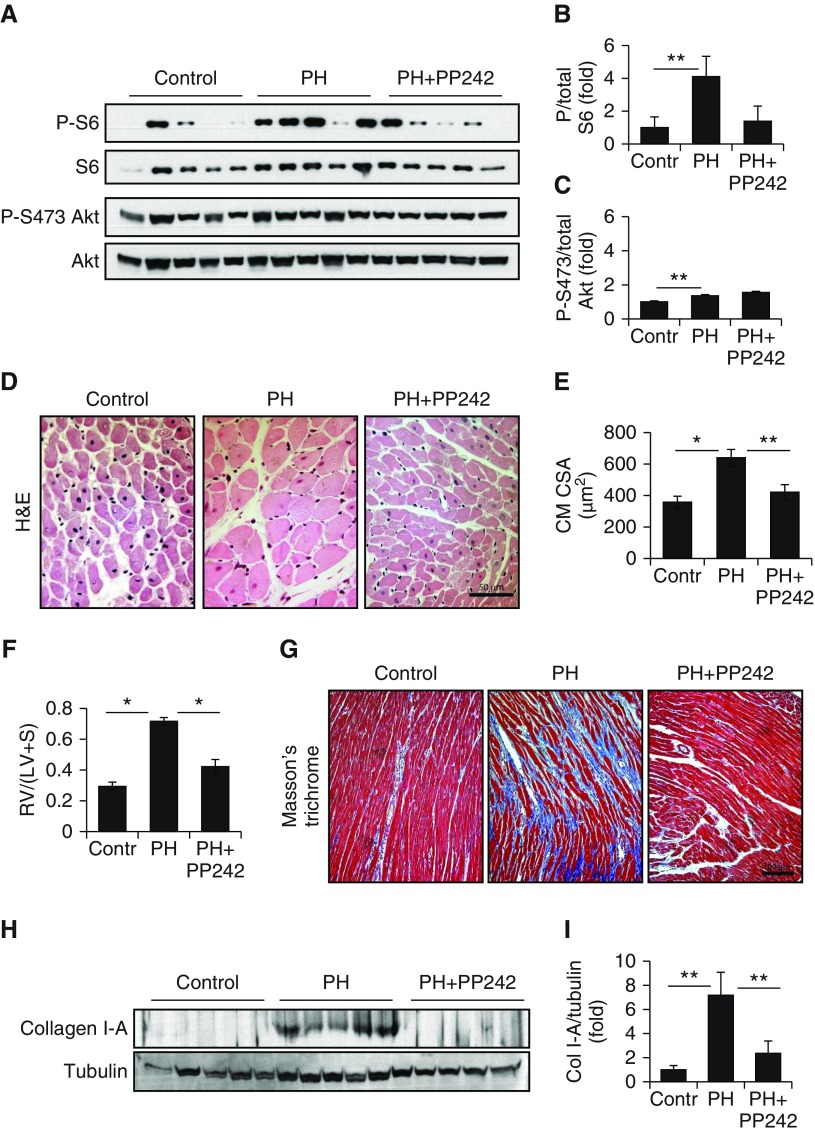
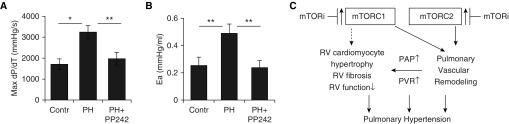
Pulmonary arterial hypertension (PAH) is characterized by pulmonary vascular remodeling, increased pulmonary artery (PA) pressure, right-heart afterload and death. Mechanistic target of rapamycin (mTOR) promotes smooth muscle cell proliferation, survival, and pulmonary vascular remodeling via two functionally distinct mTOR complexes (mTORCs)-1 (supports cell growth) and -2 (promotes cell survival), and dual mTORC1/mTORC2 inhibition selectively induces pulmonary arterial hypertension PA vascular smooth muscle cell apoptosis and reverses pulmonary vascular remodeling. The consequences of mTOR inhibition on right ventricle (RV) morphology and function are not known. Using SU5416/hypoxia rat model of pulmonary hypertension (PH), we report that, in contrast to activation of both mTORC1 and mTORC2 pathways in small remodeled PAs, RV tissues had predominant up-regulation of mTORC1 signaling accompanied by cardiomyocyte and RV hypertrophy, increased RV wall thickness, RV/left ventricle end-diastolic area ratio, RV contractility and afterload (arterial elastance), and shorter RV acceleration time compared with controls. Treatment with mTOR kinase inhibitor, PP242, at Weeks 6-8 after PH induction suppressed both mTORC1 and mTORC2 in small PAs, but only mTORC1 signaling in RV, preserving basal mTORC2-Akt levels. Vehicle-treated rats showed further PH and RV worsening and profound RV fibrosis. PP242 reversed pulmonary vascular remodeling and prevented neointimal occlusion of small PAs, significantly reduced PA pressure and pulmonary vascular resistance, reversed cardiomyocyte hypertrophy and RV remodeling, improved max RV contractility, arterial elastance, and RV acceleration time, and prevented development of RV fibrosis. Collectively, these data show a predominant role of mTORC1 versus mTORC2 in RV pathology, and suggest potential attractiveness of mTOR inhibition to simultaneously target pulmonary vascular remodeling and RV dysfunction in established PH.

Keywords: mechanistic target of rapamycin complex 1; mechanistic target of rapamycin complex 2; mechanistic target of rapamycin kinase inhibitor; pulmonary hypertension; right ventricle.


Figures

Figure 1.
Figure 1.
Pulmonary artery (PA) vascular smooth muscle cell–specific mechanistic target of rapamycin (mTOR) complex (mTORC) 1–S6 and mTORC2–Akt activation, pulmonary vascular remodeling, and pulmonary hypertension (PH) in SU5416/hypoxia (SuHx)–exposed rats. (A and B) Immunohistochemical analysis of lung tissues from male Sprague-Dawley rats with SuHx-induced PH (5 wk after induction) and age-matched controls to detect P-S6 (red, A), P-Akt (red, B), smooth muscle actin (SMA; green) and 4′,6-diamidino-2-phenylindole (DAPI; blue). Yellow: SMA (green) and P-S6 (red) or P-Akt (red, B) overlap. Images are representative of 3 animals per condition, minimum of 10 vessels per animal. Scale bars: 50 μm. (C and D) PA medial thickness (PA MT) analysis of rats with SuHx-induced PH (5 wk after PH induction) and age-matched controls. Representative images of hematoxylin and eosin (H&E)–stained PAs (C) and PA MT analysis (D). Scale bar: 50 μm; n = 5–6 animals/group; minimum of 10 PAs/animal. Data are means ± SE; *P < 0.01. (EG) Right ventricular (RV) systolic pressure (sRVP) (E), mean pulmonary arterial pressure (mPAP) (F), and pulmonary vascular resistance (PVR) (G) of rats with SuHx-induced PH (5 wk after induction) and age-matched controls. Data are means ± SE; n = 5–6 animals/group; *P < 0.01, **P < 0.05. Contr, control; P-S6, phospho-S6.
Figure 2.
Figure 2.
Predominant up-regulation of mTORC1 signaling in RV from rats with SuHx-induced PH. (A) Immunoblot analysis of RV tissues from rats with SuHx-induced PH (5 wk after induction) and age-matched controls to detect indicated proteins. (BE) Data represent fold change in Phospho:total protein ratio to control. Data are means ± SE; n = 5 rats/group; *P < 0.01. 4EBP1, eucaryotic initiation factor 4E-binding protein 1; n/s, nonsignificant; P-4EBP-1, phospho-4EBP1; P-S473Akt, phospho-serine 473 Akt; P-SGK1, phospho SGK1; SGK1, serum and glucocorticoid-regulated kinase.
Figure 3.
Figure 3.
Impaired RV morphology and function in rats with SuHx-induced PH. (A and B) Representative images (A) and cardiomyocyte cross-sectional area (CM CSA) analysis (B) of RVs from male Sprague-Dawley rats with SuHx-induced PH (5 wk after induction) and age-matched controls. Scale bar: 50 μm. Data are means ± SE; n = 5–6 rats/group; 5 fields/animal, 12 cardiomyocytes/field were analyzed. **P < 0.05. (C, G, and H) Fulton index (RV / [LV + S]), where LV is left ventricle and S is sputum (C), RV contractility (max dP/dT) (G), and arterial elastance (Ea) analyses (H) of rats with SuHx-induced PH (5 wk after induction) and age-matched controls; n = 5–6 animals/group; *P < 0.01, **P < 0.05. (DF) Masson’s trichrome staining (D) and immunoblot analysis (E and F) of RV tissues from rats with SuHx-induced PH (5 wk after induction) and age-matched controls. (D) Images are representative of five to six rats/group; minimum of six images/rat. Scale bar: 100 μm. (F) Data represent collagen I-A (Col I-A):tubulin ratio to control. Data are means ± SE; n = 5 rats/group.
Figure 4.
Figure 4.
Effect of mTOR kinase inhibitor, PP242, on RV remodeling and acceleration time (AT) in rats with Su/Hx-induced PH. Repetitive, noninvasive echocardiography of rats with SuHx-induced PH treated with vehicle or PP242 at Weeks 6–8 after PH induction. Controls were age- and sex-matched rats maintained under normoxia. (A) Representative heart echocardiography images from six rats/group. Dashed lines, ventricles outlines. (BD) RV wall thickness (WT) (B), RV:LV end-diastolic area (EDA) ratio (C), and RV-AT in control rats (white circles) and rats with SuHx-induced PH before and after treatment with vehicle (PH; black circles) and PP242 (PH + PP242, gray circles) (5 and 8 wk, respectively). Data are means ± SE; n = 5–6 rats/group. (B) #P < 0.01 for PH 5 weeks versus control 5 weeks; **P < 0.05 for PH + PP242 5 weeks versus control 5 weeks; *P < 0.01 for PH + PP242 8 weeks versus PH 8 weeks and for PH 8 weeks versus control. (C) **P < 0.05 for PH 5 weeks versus control 5 weeks; PH + PP242 5 weeks versus control 5 weeks; ##P < 0.05 for PH + PP242 8 weeks versus PH 8 weeks. (D) #P < 0.01 for control 5 weeks versus PH + PP242 5 weeks; **P < 0.05 for control 5 weeks versus PH 5 weeks; ##P < 0.05 for PH 8 weeks versus PH PP242 8 weeks; *P < 0.01 for PH 8 weeks versus control 8 weeks.
Figure 5.
Figure 5.
PP242 inhibits mTORC1–S6 and mTORC2–Akt in small PAs, reverses pulmonary vascular remodeling, and reduces pulmonary hypertension. (A and B) Immunohistochemical analysis of lung tissues from male Sprague–Dawley rats with SuHx-induced PH treated with vehicle or PP242 for 3 weeks starting at Week 6 after PH induction and age-matched controls to detect P-S6 (red, A), P-Akt (red, B), SMA (green) and DAPI (blue). Yellow: SMA (green) and P-S6 (red) or P-Akt (red, B) overlap. Images are representative of 3 animals per condition, minimum of 10 vessels per animal. Scale bars: 50 μm. (C and D) PA medial thickness (PA MT) analysis of rats treated as described above. Representative images of H&E-stained lung sections (C) and PA MT analysis (D). Scale bar: 50 μm; n = 5–6 rats/group; minimum of 10 PAs/rat. Data are means ± SE; *P < 0.01. (E and F) Immunostaining with anti–von Willebrand factor (vWF) antibody (brown) performed on lung tissue sections of rats treated with vehicle or PP242 at Weeks 6–8 after PH induction. DAPI staining (blue) was performed to detect nuclei. See also Figure E7 for additional images. (E) Images are representative of five rats/group. Scale bar: 25 μm. (F) Black bars, PH + vehicle (PH); gray bars, PH + PP242. Data are means ± SE from n = 5 rats/group, 45 PAs/rat; *P < 0.001. (GI) sRVP (G), mPAP (H), and PVR (I) of rats treated as described above. Data are means ± SE; n = 5–6 animals/group; *P < 0.01, **P < 0.05. See also Figure E2 for systemic LV pressure and mean arterial pressure measurements.
Figure 6.
Figure 6.
PP242 reduces mTORC1–S6, but not mTORC2–Akt, decreases cardiomyocytes hypertrophy, and prevents fibrosis in RVs from rats with SuHx PH. Rats with SuHx-induced PH were treated with vehicle (PH group) or PP242 (PH + PP242 group) at Weeks 6–8 after PH induction; RVs were collected for immunoblot, morphological, and histochemical analyses. Controls are age- and sex-matched rats maintained under normoxia. (AC) Immunoblot analysis of RV tissues to detect indicated proteins. Data are fold changes in p/total protein ratio to controls; n = 5 animals/group; **P < 0.05. (D and E) Analysis of cardiomyocyte cross-sectional areas (CM CSA). Representative images (D) and statistical analysis (E) of H&E-stained RV sections from 6 rats/group, 6 random images/rat, 12 randomly selected cardiomyocytes/image analyzed. Scale bar: 50 μm. Data are means ± SE; *P < 0.01; **P < 0.05. (F) Fulton index was calculated as a RV / (LV + S) ratio; n = 5–6 rats/group; *P < 0.01. (G) Representative images of Masson’s trichrome staining from five to six rats/group; minimum of six images/rat. Scale bar: 100 μm. (H and I) Immunoblot analysis of RV tissues to detect collagen I-A and tubulin. Data are fold changes in collagen I-A (Col I-A):tubulin ratio to control; n = 5 animals/group; **P < 0.05.
Figure 7.
Figure 7.
(A and B) PP242 improves RV functional outcomes. RV contractility (max dP/dT) and afterload (Ea) analyses of rats with SuHx-induced PH treated with vehicle (PH group) or PP242 (PH + PP242 group) at Weeks 6–8 after PH induction and age- and sex-matched controls; n = 5–6 animals/group; *P < 0.01, **P < 0.05. (C) Schematic representation of the relative roles of mTORC1 and mTORC2 pathways in pulmonary hypertension based on our previous (7) and current findings. Both mTORC1 and mTORC2 pathways are activated in small remodeled PAs and are required for pulmonary vascular remodeling; predominantly mTORC1 signaling is activated in RV, which promotes cardiomyocyte hypertrophy and RV fibrosis. Dual mTORC1/mTORC2 inhibition with mTOR inhibitor (mTORi), PP242, inhibits mTORC1/mTORC2 activation in small PAs and mTORC1 signaling in RV, reverses pulmonary vascular remodeling and RV hypertrophy, prevents RV fibrosis, improves RV functional outcomes, and reduces overall PH.

Similar articles

Cited by

References

    1. Humbert M, Morrell NW, Archer SL, Stenmark KR, MacLean MR, Lang IM, Christman BW, Weir EK, Eickelberg O, Voelkel NF, et al. Cellular and molecular pathobiology of pulmonary arterial hypertension. J Am Coll Cardiol. 2004;43(12) suppl S:13S–24S. - PubMed
    1. Tuder RM, Archer SL, Dorfmüller P, Erzurum SC, Guignabert C, Michelakis E, Rabinovitch M, Schermuly R, Stenmark KR, Morrell NW. Relevant issues in the pathology and pathobiology of pulmonary hypertension. J Am Coll Cardiol. 2013;62(25) suppl:D4–D12. - PMC - PubMed
    1. Morrell NW, Archer SL, Defelice A, Evans S, Fiszman M, Martin T, Saulnier M, Rabinovitch M, Schermuly R, Stewart D, et al. Anticipated classes of new medications and molecular targets for pulmonary arterial hypertension. Pulm Circ. 2013;3:226–244. - PMC - PubMed
    1. Yeh ETH, Tong AT, Lenihan DJ, Yusuf SW, Swafford J, Champion C, Durand J-B, Gibbs H, Zafarmand AA, Ewer MS. Cardiovascular complications of cancer therapy: diagnosis, pathogenesis, and management. Circulation. 2004;109:3122–3131. - PubMed
    1. Laplante M, Sabatini DM. mTOR signaling at a glance. J Cell Sci. 2009;122:3589–3594. - PMC - PubMed

MeSH terms