. 2017 Jul 5;18(1):515.
doi: 10.1186/s12864-017-3900-6.

Increasing quality, throughput and speed of sample preparation for strand-specific messenger RNA sequencing

Affiliations

Increasing quality, throughput and speed of sample preparation for strand-specific messenger RNA sequencing

Simon Haile et al. BMC Genomics. .

Abstract

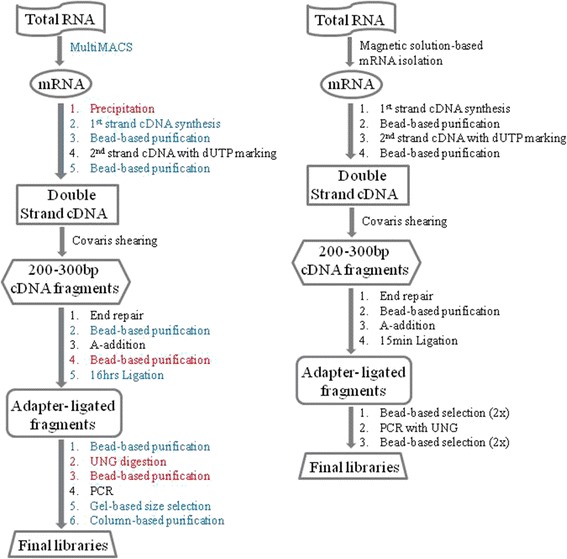
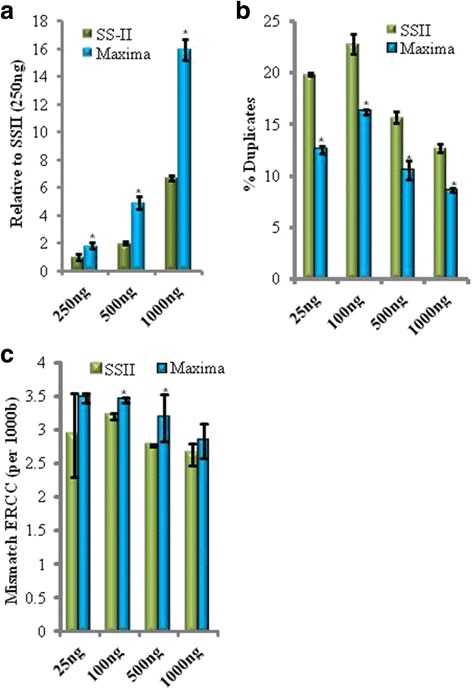
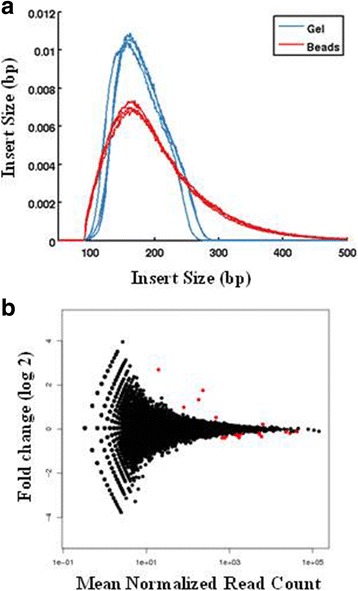
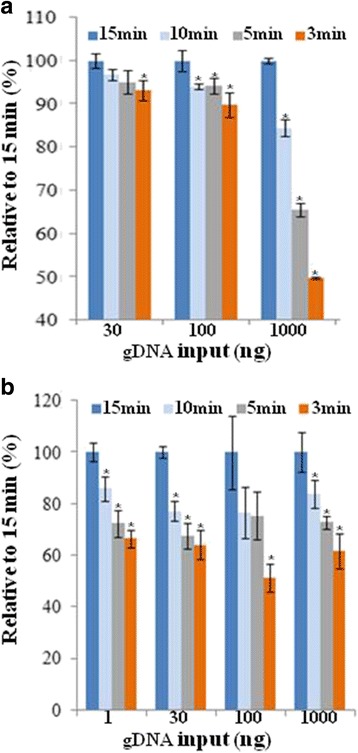
Background: RNA-Sequencing (RNA-seq) is now commonly used to reveal quantitative spatiotemporal snapshots of the transcriptome, the structures of transcripts (splice variants and fusions) and landscapes of expressed mutations. However, standard approaches for library construction typically require relatively high amounts of input RNA, are labor intensive, and are time consuming. METHODS: Here, we report the outcome of a systematic effort to optimize and streamline steps in strand-specific RNA-seq library construction. RESULTS: This work has resulted in the identification of an optimized messenger RNA isolation protocol, a potent reverse transcriptase for cDNA synthesis, and an efficient chemistry and a simplified formulation of library construction reagents. We also present an optimization of bead-based purification and size selection designed to maximize the recovery of cDNA fragments.

Conclusions: These developments have allowed us to assemble a rapid high throughput pipeline that produces high quality data from amounts of total RNA as low as 25 ng. While the focus of this study is on RNA-seq sample preparation, some of these developments are also relevant to other next-generation sequencing library types.

Keywords: Ampure XP magnetic beads; Illumina; Library construction; Ligation; Next-generation sequencing; RNA-seq; Reverse transcriptase; Strand-specific; Uracil DNA N-Glycosylase; dUTP; mRNA.


Conflict of interest statement

Ethics approval and consent to participate

Some of the patient samples used in this study are part of the BC Cancer Agency’s Personalized Oncogenomics project [14], which was approved by the University of British Columbia Research Ethics Committee (REB# H12–00137). Sample use was according to the written consent by each patient. Patient identity was made anonymous and sequence data and analyses thereafter were maintained within a secure computing environment.

Human promyelocytic Leukemia cell line (HL60) was purchased from Cedarlane Laboratories LTD.

Consent for publication

Not applicable.

Competing interests

The authors declare that they have no competing interests.

Publisher’s Note

Springer Nature remains neutral with regard to jurisdictional claims in published maps and institutional affiliations.

Figures

Fig. 1
Fig. 1
Workflow of ssRNA-seq pipeline at our facility. On the left is the previous version of our pipeline and the on the right is the new version. Red font denotes steps which are removed in the new version and blue font represents process or reagent modifications
Fig. 2
Fig. 2
The Maxima H Minus reverse transcriptase provides higher yield of cDNA and quality of libraries. a cDNA yield assessment. X-axis indicates various UHR RNA input amounts used for mRNA isolation and cDNA synthesis. Double strand cDNA was measured using the Qubit HS DNA assay. Values from this assay were normalized relative to the value obtained when using Superscript II (RT-II) for the 250 ng input. b Diversity of libraries. Libraries were generated from cDNA samples that were prepared using the best performing RT (Maxima) and Superscript II (SS-II). The resulting sequencing data were analyzed for duplicate rates. c ERCC spike-in sequence differences. Mismatch rates were calculated by comparing observed sequences and expected sequences from the known spike-in synthetic RNAs. X-axis represents various UHR RNA input amounts used for mRNA isolation and cDNA synthesis. Y-axis is error rate per 1000 nucleotides. n = 3; error bars = Standard Deviation. *P < 0.05. P values were calculated using Student’s t-test (unpaired and equal variance)
Fig. 3
Fig. 3
Bead versus gel-based size selection. a Insert size. Size profiles were based on reads that mapped to the human mitochondrial genome. b Differential gene expression between two conditions. DE-seq plots show genes (in red dots) that were differentially expressed at a statistically significant level (FDR ≤ 0.1) as in [21]. n = 3 (replicate libraries)
Fig. 4
Fig. 4
Bead binding time point analysis. a Pre-PCR assessment. Various gDNA input amounts (X-axis) were used and libraries were made where the binding time for each of the bead cleanups was varied. The cumulative effect after all cleanups up to the point of post-ligation cleanups is shown. The purified ligated DNA was measured using a Qubit HS assay. The values from this assay were normalized to that of the 15 min condition. b Post-PCR assessment. As in (a) but purified DNA was measured after PCR enrichment. i.e. after additional two post-PCR bead-based purifications. n = 3; error bars = Standard Deviation. *P < 0.05
Fig. 5
Fig. 5
Post-UNG bead-based purifications: library yield data. a Effect of bead to DNA ratio on library sizes. Various combinations of 1:1 and 2:1 bead to DNA ratio were applied for post-ligation and post-UNG purifications. The final purified PCR product was run on Agilent DNA 1000 for size profiling. b Size profiles of libraries made using variations of the UNG step. The first three conditions where bead amount was varied for post-ligation and post-UNG purifications involve a distinct UNG step. The fourth condition also has a separate UNG step but the reaction is used as a template for PCR without purification in between. The next condition combines UNG and PCR reactions where as the last condition omits the UNG treatment all together. The sizes of these libraries were calculated from fragment smear analysis using Agilent’s software. Input was 1μg UHR total RNA. c Yield comparison of libraries made using various formats of the UNG step. As in (b) but endpoint data is concentration of the final libraries. n = 3; error bars = Standard Deviation
Fig. 6
Fig. 6
Post-UNG bead-based purifications: Sequencing data. a Bioinformatic insert size profiles correlate with lab level data. The same libraries described in 5B and 5C were sequenced. Other post-alignment assessments included % duplicates (b), % Mitochondrial (c) and strand- specificity (d). n = 3; error bars = Standard Deviation
Fig. 7
Fig. 7
Identification of optimal library construction chemistry and ligation condition. a Workflows of three categories of library construction chemistries. Work flow-A has cleanups after every step of library construction and in Work flow-B the cleanup after A-addition is removed where as in the most-streamlined Work flow-C end-repair and A-addition are coupled into one reaction and the cleanup after A-addition is removed. b Comparison of library yield between the three NEB workflows. PCR-free libraries were generated using the chemistries that represented the workflows depicted in (a) using two different amounts of gDNA as inputs. qPCR was applied to measure the final library yield. c Optimization of ligation. For the best performing chemistry (NEB workflow-B), ligation time point analysis was performed by varying the adapter amount. This was performed using our ssRNA-seq pipeline. n = 3; error bars = Standard Deviation
Fig. 8
Fig. 8
UHR total RNA input titration using the new ssRNA-seq pipeline. a Comparable mapping of reads to various transcriptome catagories. b Other alignment-based metrics. Y-axis represents the value for each of the inputs divided by that of the 1000 ng for a given metric
Fig. 9
Fig. 9
Evaluation of the new ssRNA-seq pipeline using RNA from tumor samples. 100 ng total RNA from 12 different tumor samples was used as input to generate libraries using the new protocol. Adapter-ligated libraries were enriched with 13 cycles of PCR. a Library yield. b Correlation of expression. Pearson’s correlation coefficient was calculated pair-wise showing higher correlation between the new lower input libraries and their previous higher input counterparts

References

    1. Engler MJ, Richardson CC. DNA ligases. The Enzymes (Boyer PD, ed.), Academic Press, Inc, New York. 1982;3–29.
    1. Mills JD, Kawahara Y, Janitz M. Strand-specific RNA-Seq provides greater resolution of Transcriptome profiling. Current Genomics. 2013;14(3):173–181. doi: 10.2174/1389202911314030003. - DOI - PMC - PubMed
    1. Sigurgeirsson B, Emanuelsson O, Lundeberg J. Analysis of stranded information using an automated procedure for strand specific RNA sequencing. BMC Genomics. 2014;15:631. doi: 10.1186/1471-2164-15-631. - DOI - PMC - PubMed
    1. Zhao S, Zhang Y, Gordon W, Quan J, Xi H. Du S, von Schack D and Zhang B. BMC Genomics. 2015;16:675. doi: 10.1186/s12864-015-1876-7. - DOI - PMC - PubMed
    1. Parkhomchuk D, Parkhomchuk M, Borodina T, Amstislavskiy V, Banaru M, Hallen L, Krobitsch S, Lehrach H, Soldatov A. Transcriptome analysis by strand-specific sequencing of complementary DNA. Nucleic Acids Res. 2009;37:e123. doi: 10.1093/nar/gkp596. - DOI - PMC - PubMed

Publication types

LinkOut - more resources