Comment
. 2017 Jul 5;18(1):128.
doi: 10.1186/s13059-017-1257-4.

Data normalization considerations for digital tumor dissection

Affiliations
Comment

Data normalization considerations for digital tumor dissection

Aaron M Newman et al. Genome Biol. .

Abstract

In a recently published article in Genome Biology, Li and colleagues introduced TIMER, a gene expression deconvolution approach for studying tumor-infiltrating leukocytes (TILs) in 23 cancer types profiled by The Cancer Genome Atlas. Methods to characterize TIL biology are increasingly important, and the authors offer several arguments in favor of their strategy. Several of these claims warrant further discussion and highlight the critical importance of data normalization in gene expression deconvolution applications.Please see related Li et al correspondence: www.dx.doi.org/10.1186/s13059-017-1256-5 and Zheng correspondence: www.dx.doi.org/10.1186/s13059-017-1258-3.


Figures

Fig. 1
Fig. 1
Variable correlation of directly enumerated leukocyte frequencies in lung tumors and blood. a All-versus-all Pearson correlation matrix of nine distinct leukocyte subsets profiled by flow cytometry in peripheral blood mononuclear cells (PBMCs) from 20 healthy donors [6]. b Same as panel a, but for five immune subsets profiled by flow cytometry in 13 lung squamous cell carcinoma tumor biopsies [7]. a, b Leukocyte frequencies were normalized to sum to 1 prior to correlation analysis. c Same as panel b, except the frequency of each leukocyte subset was expressed as a percentage of viable singlets prior to correlation assessment. NK natural killer, TIL tumor-infiltrating leukocyte
Fig. 2
Fig. 2
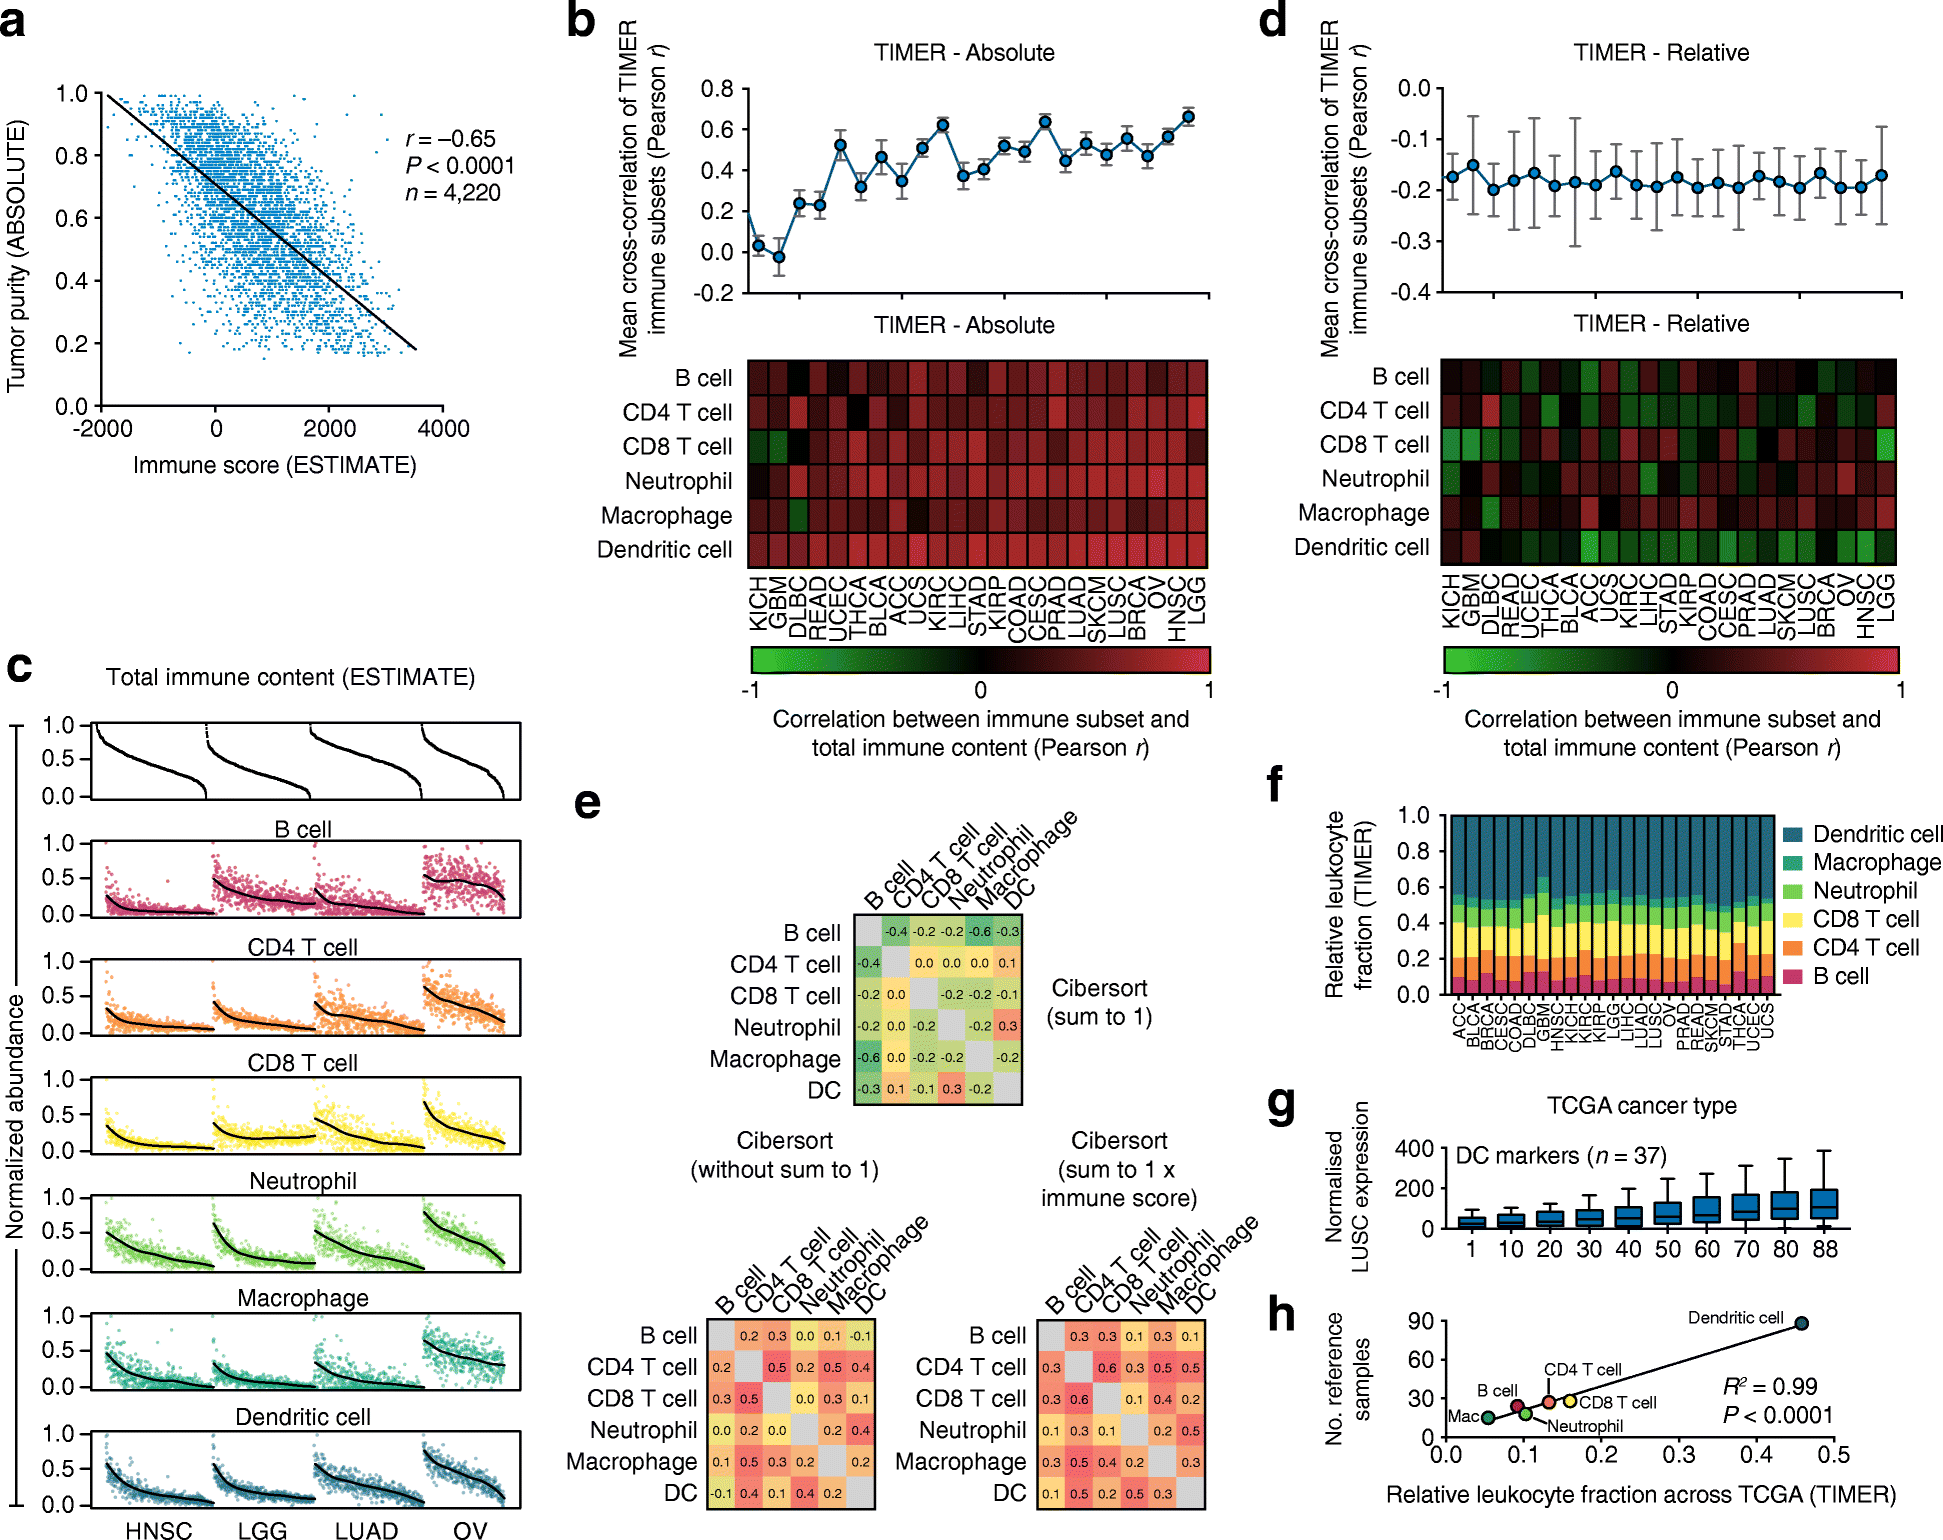
Impact of data normalization on in silico tumor-infiltrating leukocyte profiling. a Tumor purity inferred by ABSOLUTE [29] versus immune content inferred by ESTIMATE [30], compared across 11 TCGA (The Cancer Genome Atlas) cancer types (ABSOLUTE data were obtained from [26]). b Bottom heat map showing Pearson correlations comparing overall leukocyte content, inferred by ESTIMATE, with immune subset abundance, inferred by TIMER, across 23 TCGA tumor types. Cancers are ordered from left to right by the mean correlation coefficient calculated across the six immune cell types. Top mean cross-correlation coefficient of the six immune subsets compared with each other, omitting self-comparisons. Cancer types are vertically aligned, and correlation coefficients are expressed as mean ± SEM. c TIMER results are shown for four representative TCGA cancer types, along with immune content inferred by ESTIMATE. Overall leukocyte content and estimates of individual tumor-infiltrating leukocyte (TIL) subsets are normalized from 0 to 1 within each cancer type, and ordered from left to right by decreasing immune content. Regression lines (shown in black) were calculated by cubic splines. d Same as panel b, but after normalizing inferred levels of the six leukocyte subsets to one in each patient. e Cross-correlation matrix of CIBERSORT results before and after adjustment by total leukocyte content. Results are shown for lung squamous cell carcinoma (LUSC) microarrays profiled by TCGA (n = 130 tumor samples). ESTIMATE was used to infer total leukocyte content, denoted immune score. f Average representation of the six immune subsets inferred by TIMER across 23 TCGA cancer types. g Impact of source datasets on tumor gene expression levels following batch correction. Li et al. applied ComBat [17] to merge expression profiles of bulk tumors with a reference database containing six immune cell types with variable representation. Here, the number of dendritic cell (DC) samples in the authors’ reference database (n = 88) was randomly sampled from 1 to 88 while the remaining immune subsets were left unchanged. For each iteration, ComBat was applied to merge the reference immune profiles with RNA-Seq data from LUSC, which we used as a representative TCGA cancer type (n = 555 tumors). The median expression level of each DC marker gene (used in Li et al. and originally obtained from [31]) was determined across the LUSC cohort; markers are represented as medians, quartiles, and 10th and 90th percentiles. h Analysis of the number of immune reference samples versus the relative fraction of each immune subset inferred by TIMER across TCGA (colored as in panel f)

Comment in

Comment on

References

    1. Newman AM, Alizadeh AA. High-throughput genomic profiling of tumor-infiltrating leukocytes. Curr Opin Immunol. 2016;41:77–84. doi: 10.1016/j.coi.2016.06.006. - DOI - PMC - PubMed
    1. Aran D, Butte AJ. Digitally deconvolving the tumor microenvironment. Genome Biol. 2016;17:175. doi: 10.1186/s13059-016-1036-7. - DOI - PMC - PubMed
    1. Shen-Orr SS, Gaujoux R. Computational deconvolution: extracting cell type-specific information from heterogeneous samples. Curr Opin Immunol. 2013;25:571–8. doi: 10.1016/j.coi.2013.09.015. - DOI - PMC - PubMed
    1. Li B, Severson E, Pignon JC, Zhao H, Li T, Novak J, et al. Comprehensive analyses of tumor immunity: implications for cancer immunotherapy. Genome Biol. 2016;17:174. doi: 10.1186/s13059-016-1028-7. - DOI - PMC - PubMed
    1. Abbas AR, Wolslegel K, Seshasayee D, Modrusan Z, Clark HF. Deconvolution of blood microarray data identifies cellular activation patterns in systemic lupus erythematosus. PLoS One. 2009;4 doi: 10.1371/journal.pone.0006098. - DOI - PMC - PubMed