

Tracing Genetic Exchange and Biogeography of Cryptococcus neoformans var. grubii at the Global Population Level
- PMID: 28679543
- PMCID: PMC5586382
- DOI: 10.1534/genetics.117.203836
Tracing Genetic Exchange and Biogeography of Cryptococcus neoformans var. grubii at the Global Population Level
Abstract
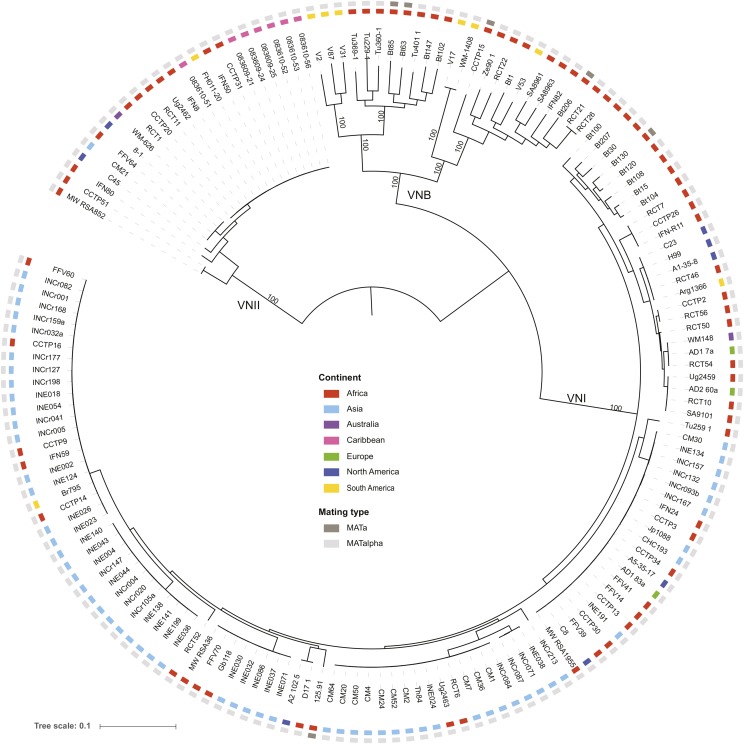
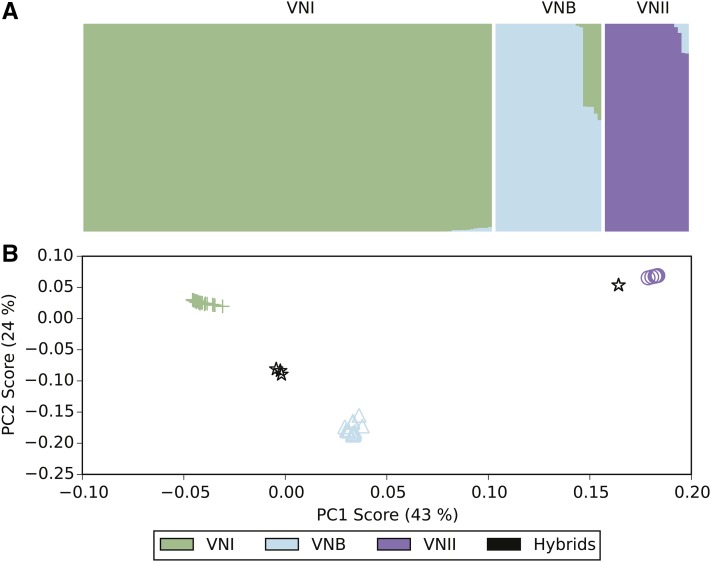
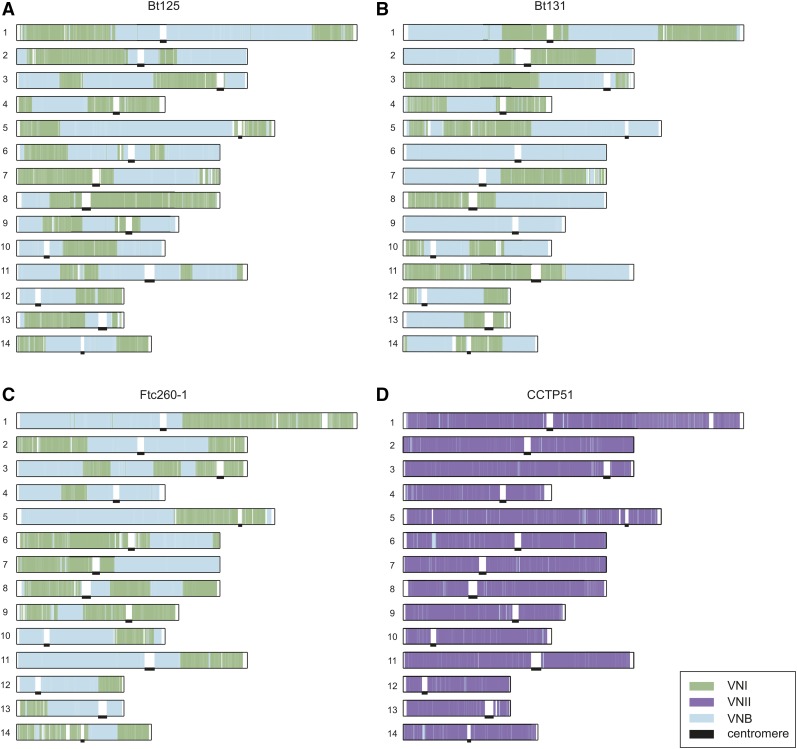
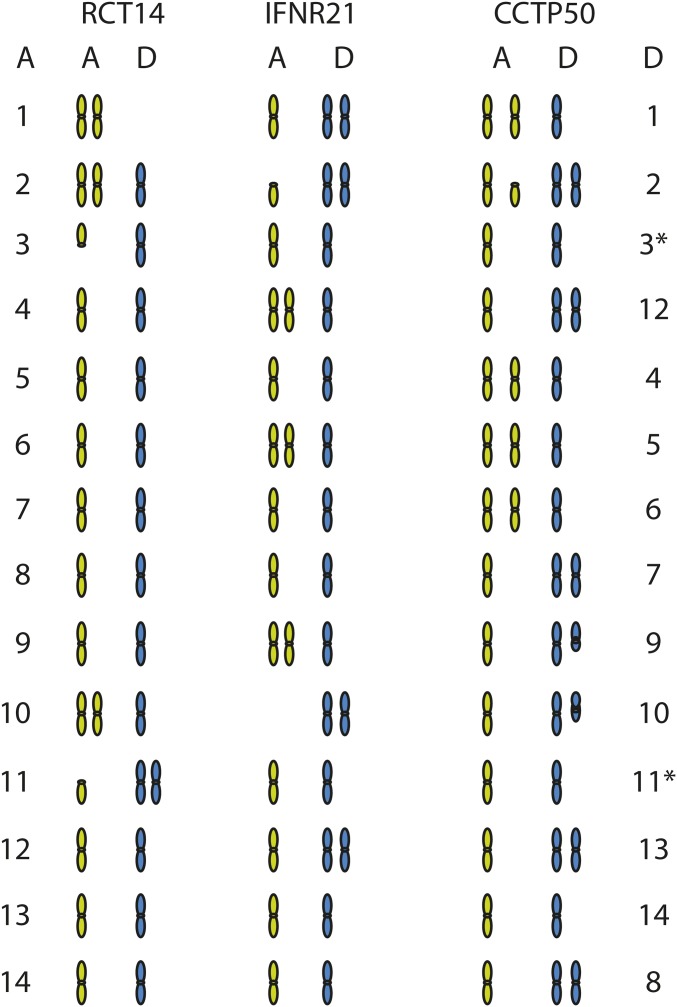
Cryptococcus neoformans var. grubii is the causative agent of cryptococcal meningitis, a significant source of mortality in immunocompromised individuals, typically human immunodeficiency virus/AIDS patients from developing countries. Despite the worldwide emergence of this ubiquitous infection, little is known about the global molecular epidemiology of this fungal pathogen. Here we sequence the genomes of 188 diverse isolates and characterize the major subdivisions, their relative diversity, and the level of genetic exchange between them. While most isolates of C. neoformans var. grubii belong to one of three major lineages (VNI, VNII, and VNB), some haploid isolates show hybrid ancestry including some that appear to have recently interbred, based on the detection of large blocks of each ancestry across each chromosome. Many isolates display evidence of aneuploidy, which was detected for all chromosomes. In diploid isolates of C. neoformans var. grubii (serotype AA) and of hybrids with C. neoformans var. neoformans (serotype AD) such aneuploidies have resulted in loss of heterozygosity, where a chromosomal region is represented by the genotype of only one parental isolate. Phylogenetic and population genomic analyses of isolates from Brazil reveal that the previously "African" VNB lineage occurs naturally in the South American environment. This suggests migration of the VNB lineage between Africa and South America prior to its diversification, supported by finding ancestral recombination events between isolates from different lineages and regions. The results provide evidence of substantial population structure, with all lineages showing multi-continental distributions; demonstrating the highly dispersive nature of this pathogen.
Keywords: Cryptococcus; genome sequence; hybridization; phylogeography; recombination; selection.
Copyright © 2017 Rhodes et al.
Figures
Similar articles
-
Identification of novel hybrids between Cryptococcus neoformans var. grubii VNI and Cryptococcus gattii VGII.Mycopathologia. 2012 Jun;173(5-6):337-46. doi: 10.1007/s11046-011-9491-x. Epub 2011 Nov 13. Mycopathologia. 2012. PMID: 22081254
-
Many globally isolated AD hybrid strains of Cryptococcus neoformans originated in Africa.PLoS Pathog. 2007 Aug 17;3(8):e114. doi: 10.1371/journal.ppat.0030114. PLoS Pathog. 2007. PMID: 17708680 Free PMC article.
-
Molecular epidemiology of Italian clinical Cryptococcus neoformans var. grubii isolates.Med Mycol. 2013 Jul;51(5):499-506. doi: 10.3109/13693786.2012.751642. Epub 2013 Jan 4. Med Mycol. 2013. PMID: 23286351
-
Recognition of seven species in the Cryptococcus gattii/Cryptococcus neoformans species complex.Fungal Genet Biol. 2015 May;78:16-48. doi: 10.1016/j.fgb.2015.02.009. Epub 2015 Feb 23. Fungal Genet Biol. 2015. PMID: 25721988 Review.
-
Advances in Cryptococcus genomics: insights into the evolution of pathogenesis.Mem Inst Oswaldo Cruz. 2018;113(7):e170473. doi: 10.1590/0074-02760170473. Epub 2018 Feb 19. Mem Inst Oswaldo Cruz. 2018. PMID: 29513784 Free PMC article. Review.
Cited by
-
Clade-specific chromosomal rearrangements and loss of subtelomeric adhesins in Candida auris.Genetics. 2021 May 17;218(1):iyab029. doi: 10.1093/genetics/iyab029. Genetics. 2021. PMID: 33769478 Free PMC article.
-
Deciphering the Association among Pathogenicity, Production and Polymorphisms of Capsule/Melanin in Clinical Isolates of Cryptococcus neoformans var. grubii VNI.J Fungi (Basel). 2022 Feb 28;8(3):245. doi: 10.3390/jof8030245. J Fungi (Basel). 2022. PMID: 35330247 Free PMC article.
-
The Evolution of Sexual Reproduction and the Mating-Type Locus: Links to Pathogenesis of Cryptococcus Human Pathogenic Fungi.Annu Rev Genet. 2019 Dec 3;53:417-444. doi: 10.1146/annurev-genet-120116-024755. Epub 2019 Sep 19. Annu Rev Genet. 2019. PMID: 31537103 Free PMC article. Review.
-
Emergence of terbinafine-resistant Trichophyton indotineae in Ontario, Canada, 2014-2023.J Clin Microbiol. 2025 Jan 31;63(1):e0153524. doi: 10.1128/jcm.01535-24. Epub 2024 Nov 25. J Clin Microbiol. 2025. PMID: 39584838 Free PMC article.
-
Genome restructuring and lineage diversification of Cryptococcus neoformans during chronic infection of human hosts.Cell Rep. 2025 Aug 26;44(8):116103. doi: 10.1016/j.celrep.2025.116103. Epub 2025 Aug 5. Cell Rep. 2025. PMID: 40768337 Free PMC article.
References
-
- Armstrong-James D., Meintjes G., Brown G. D., 2014. A neglected epidemic: fungal infections in HIV/AIDS. Trends Microbiol. 22: 120–127. - PubMed
-
- Bicanic T., Harrison T., Niepieklo A., Dyakopu N., Meintjes G., 2006. Symptomatic relapse of HIV-associated Cryptococcal meningitis after initial fluconazole monotherapy: the role of fluconazole resistance and immune reconstitution. Clin. Infect. Dis. 43: 1069–1070. - PubMed
-
- Bicanic T., Meintjes G., Wood R., Hayes M., Rebe K., et al. , 2007. Fungal burden, early fungicidal activity, and outcome in cryptococcal meningitis in antiretroviral-naive or antiretroviral-experienced patients treated with amphotericin B or fluconazole. Clin. Infect. Dis. Off. Publ. Infect. Dis. Soc. Am. 45: 76–80. - PubMed
MeSH terms
Grants and funding
LinkOut - more resources
Full Text Sources
Other Literature Sources
