

Laboratory predictors of bleeding and the effect of platelet and RBC transfusions on bleeding outcomes in the PLADO trial
- PMID: 28679741
- PMCID: PMC5606003
- DOI: 10.1182/blood-2017-01-757930
Laboratory predictors of bleeding and the effect of platelet and RBC transfusions on bleeding outcomes in the PLADO trial
Abstract
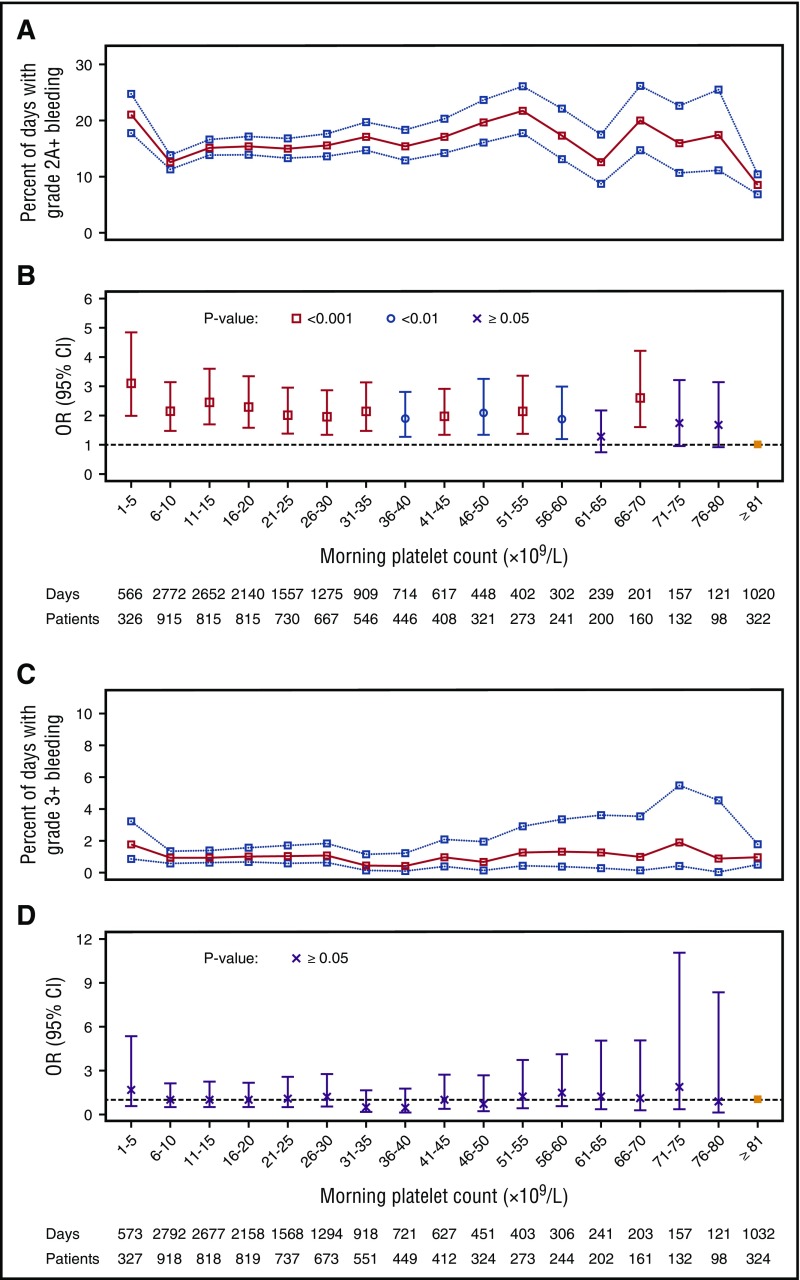
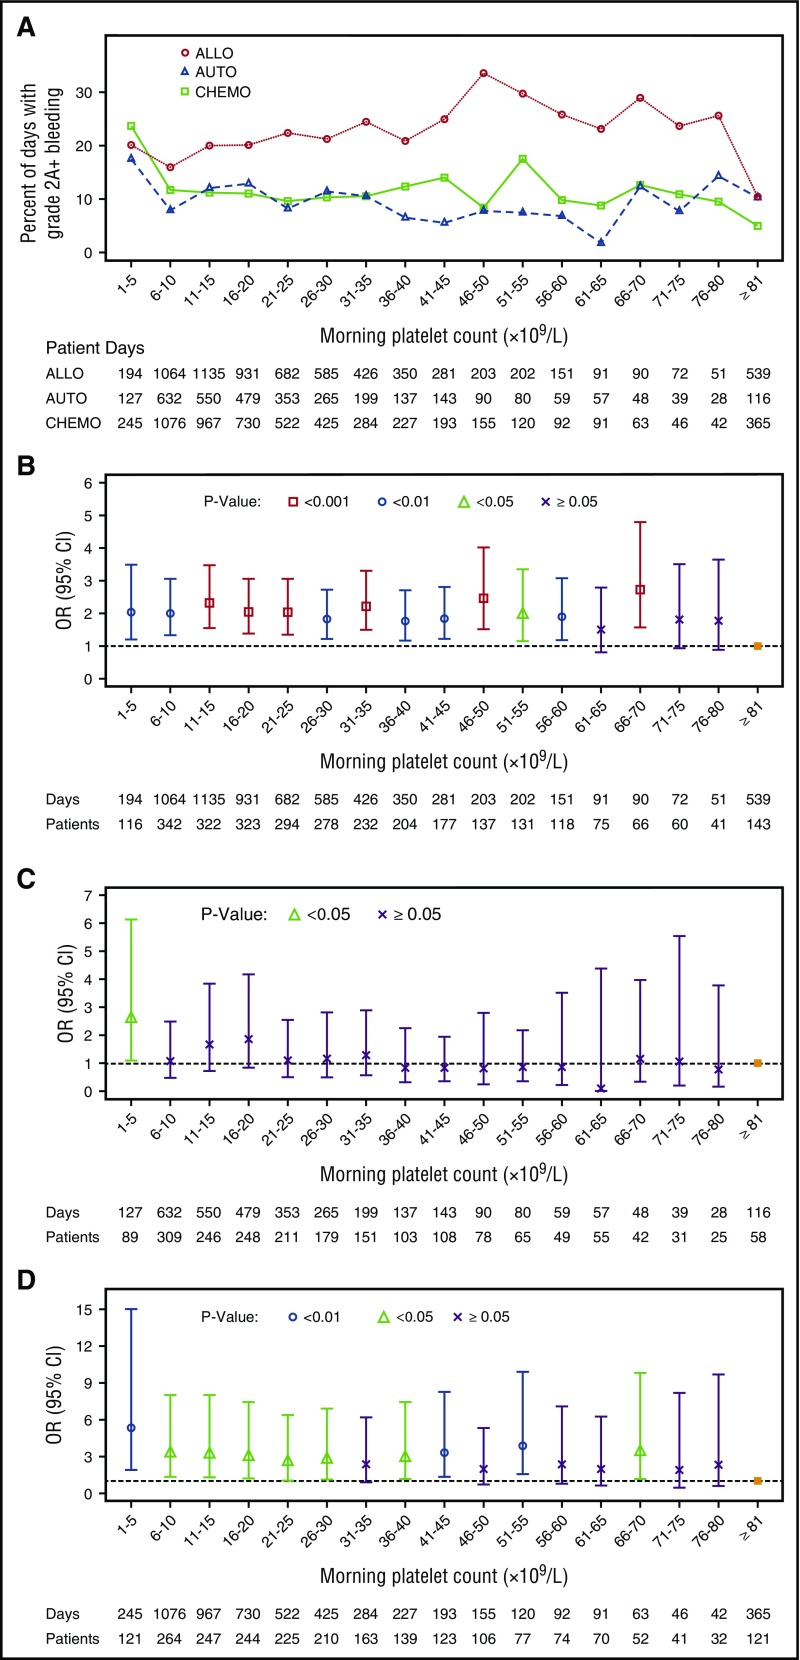
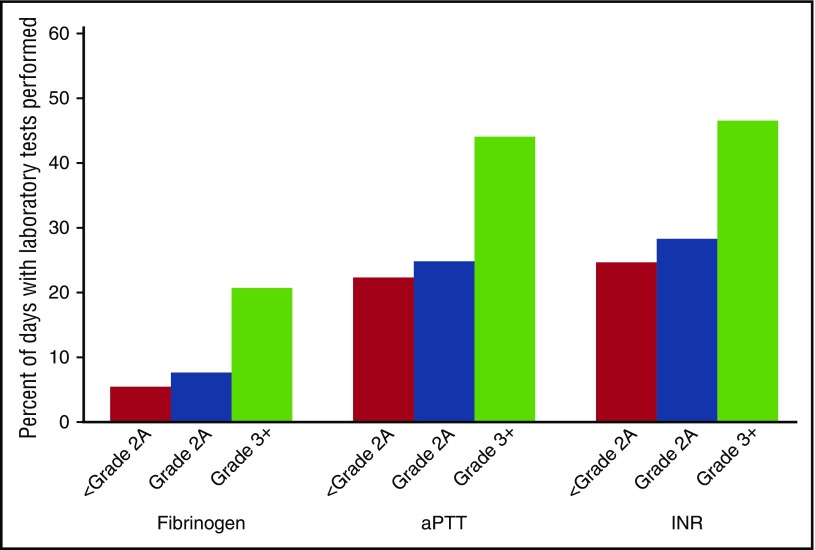
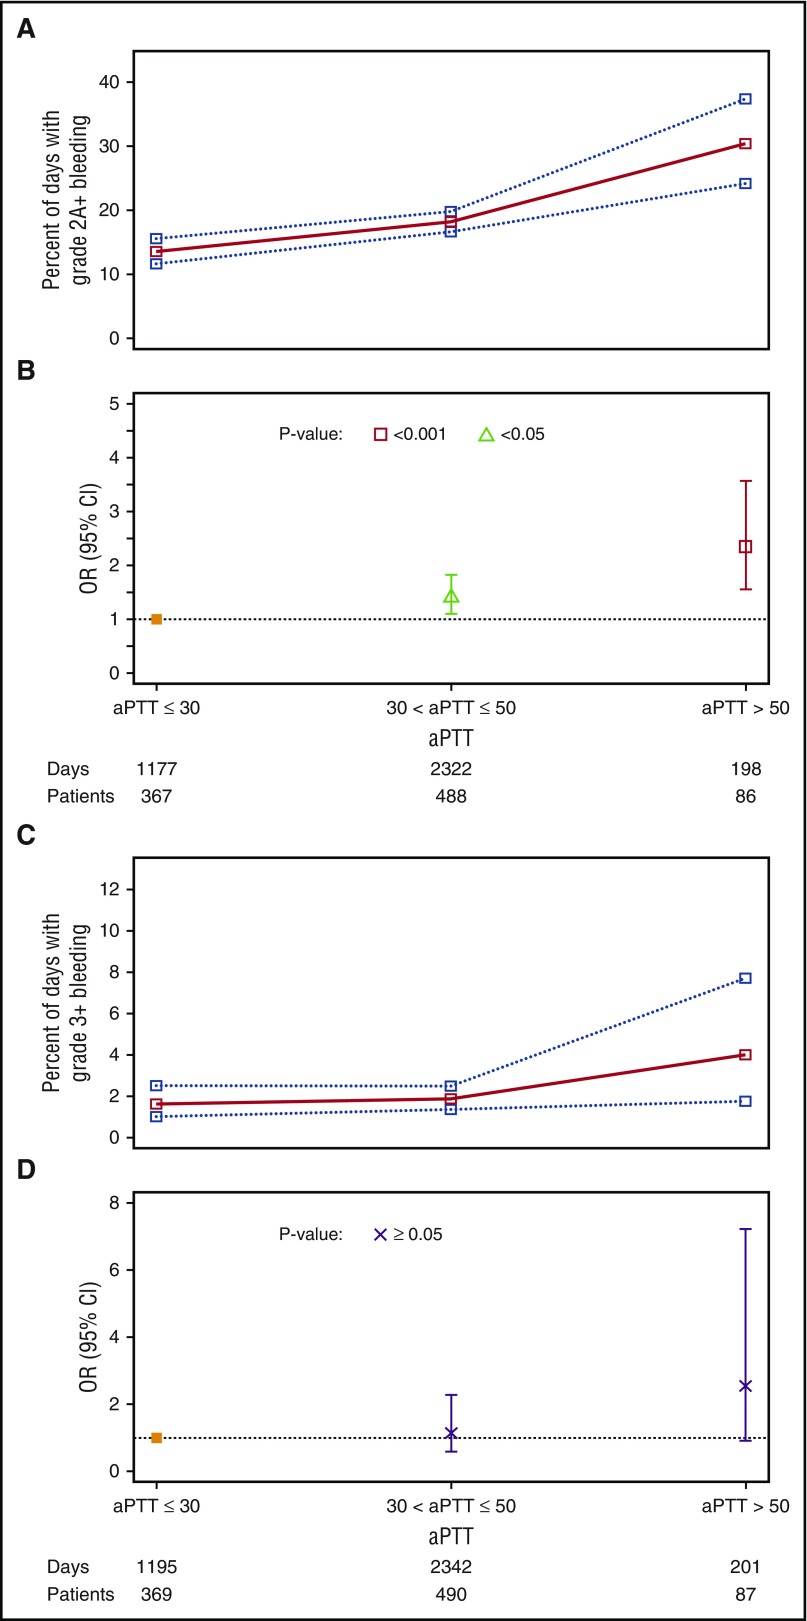
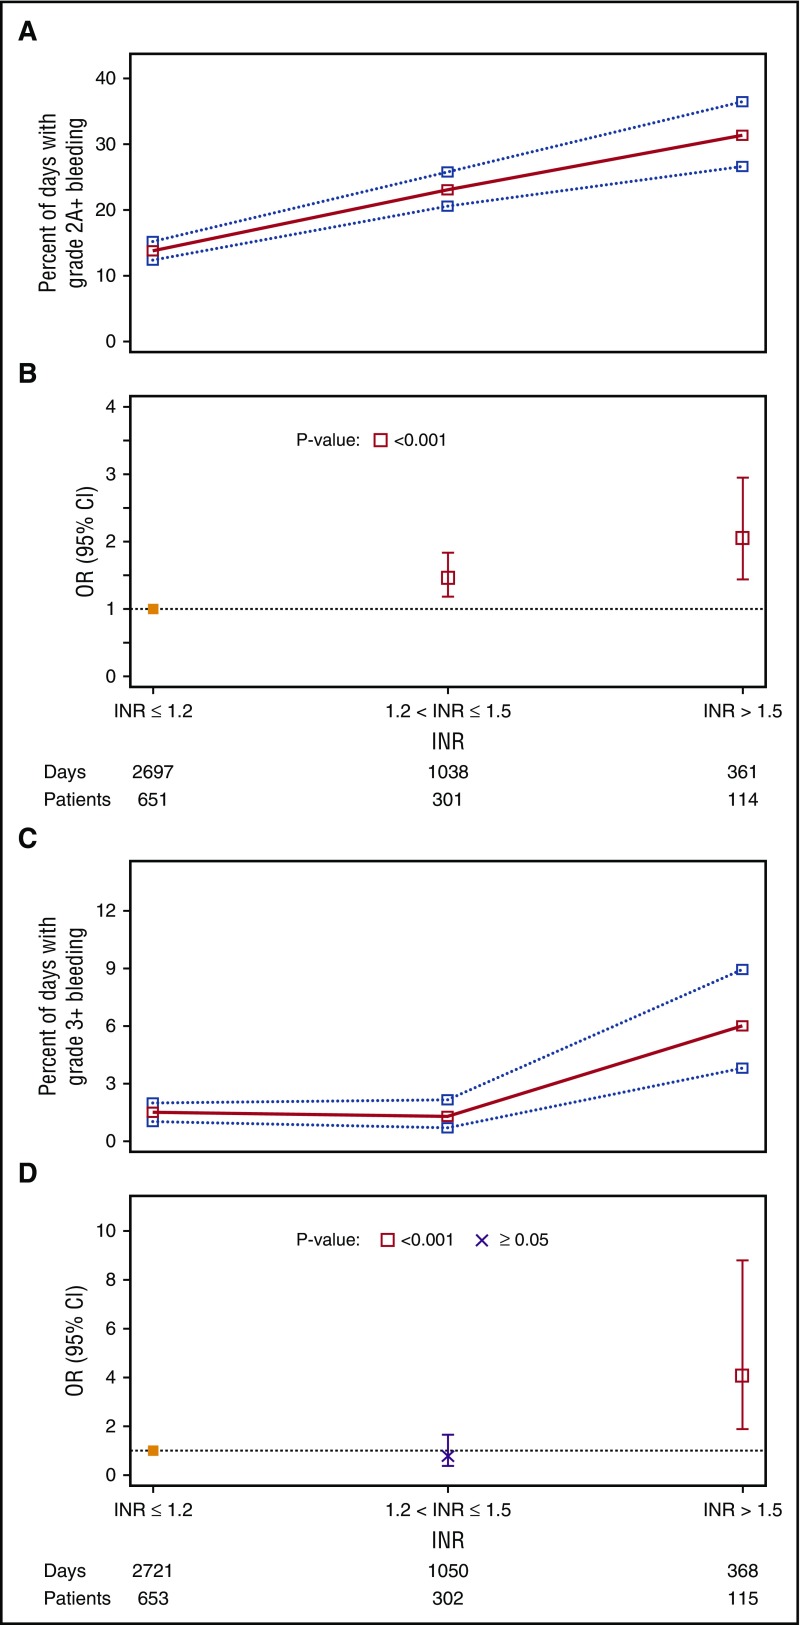
Bleeding remains a significant problem for many thrombocytopenic hematology/oncology patients in spite of platelet transfusions. Factors that might contribute to bleeding were analyzed for 16 320 patient-days on or after their first platelet transfusion in 1077 adult patients enrolled in the Platelet Dose (PLADO) trial. All patients had a greatly increased risk of bleeding at platelet counts of ≤5 × 10⁹/L (odds ratio [OR], 3.1; 95% confidence interval [CI], 2.0-4.8) compared with platelet counts ≥81 × 109/L. Platelet counts between 6 × 10⁹/L and 80 × 109/L were also associated with a somewhat elevated bleeding risk in patients receiving allogeneic stem cell transplants (SCTs) or chemotherapy but not in those undergoing autologous SCTs. Other significant laboratory predictors of bleeding were hematocrit ≤25% (OR, 1.29; 95% CI, 1.11-1.49), activated partial thromboplastin time (aPTT) 30 to ≤50 seconds (OR, 1.40; 95% CI, 1.08-1.81; P = .01), aPTT >50 seconds (OR, 2.34; 95% CI, 1.54-3.56), international normalized ratio (INR) 1.2 to 1.5 (OR, 1.46; 95% CI, 1.17-1.83), and INR >1.5 (OR, 2.05; 95% CI, 1.43-2.95). Transfusion of either platelets or red blood cells (RBCs) on days with bleeding was often not sufficient to change bleeding outcomes on the following day. Because bleeding occurred over a wide range of platelet counts among patients undergoing allogeneic SCT or chemotherapy and because platelet transfusions may not prevent bleeding, other risk factors may be involved. These may include low hematocrit and coagulation abnormalities. This trial was registered at www.clinicaltrials.gov as #NCT00128713.
© 2017 by The American Society of Hematology.
Conflict of interest statement
Conflict-of-interest disclosure: The authors declare no competing financial interests.
Figures

Comment in
-
Anemia and bleeding in thrombocytopenic patients.Blood. 2017 Sep 7;130(10):1178-1179. doi: 10.1182/blood-2017-07-795922. Blood. 2017. PMID: 28882834 No abstract available.
References
-
- Friedmann AM, Sengul H, Lehmann H, Schwartz C, Goodman S. Do basic laboratory tests or clinical observations predict bleeding in thrombocytopenic oncology patients? A reevaluation of prophylactic platelet transfusions. Transfus Med Rev. 2002;16(1):34-45. - PubMed
-
- Heddle NM, Cook RJ, Tinmouth A, et al. ; SToP Study Investigators of the BEST Collaborative. A randomized controlled trial comparing standard- and low-dose strategies for transfusion of platelets (SToP) to patients with thrombocytopenia. Blood. 2009;113(7):1564-1573. - PubMed
-
- Wandt H, Schaefer-Eckart K, Wendelin K, et al. ; Study Alliance Leukemia. Therapeutic platelet transfusion versus routine prophylactic transfusion in patients with haematological malignancies: an open-label, multicentre, randomised study. Lancet. 2012;380(9850):1309-1316. - PubMed
Publication types
MeSH terms
Substances
Associated data
Grants and funding
- U01 HL072346/HL/NHLBI NIH HHS/United States
- U01 HL072289/HL/NHLBI NIH HHS/United States
- U01 HL072305/HL/NHLBI NIH HHS/United States
- U01 HL072028/HL/NHLBI NIH HHS/United States
- U01 HL072291/HL/NHLBI NIH HHS/United States
- U01 HL072290/HL/NHLBI NIH HHS/United States
- U01 HL072283/HL/NHLBI NIH HHS/United States
- U01 HL072299/HL/NHLBI NIH HHS/United States
- U01 HL072274/HL/NHLBI NIH HHS/United States
- U01 HL072355/HL/NHLBI NIH HHS/United States
- U01 HL072072/HL/NHLBI NIH HHS/United States
- U01 HL072331/HL/NHLBI NIH HHS/United States
- U01 HL072359/HL/NHLBI NIH HHS/United States
- U01 HL072248/HL/NHLBI NIH HHS/United States
- U01 HL072191/HL/NHLBI NIH HHS/United States
- U01 HL072033/HL/NHLBI NIH HHS/United States
- U01 HL072196/HL/NHLBI NIH HHS/United States
- U01 HL072268/HL/NHLBI NIH HHS/United States
LinkOut - more resources
Full Text Sources
Other Literature Sources
Medical
