. 2017 Jul 5;8(4):e00944-17.
doi: 10.1128/mBio.00944-17.

AIM2-Like Receptors Positively and Negatively Regulate the Interferon Response Induced by Cytosolic DNA

Affiliations

AIM2-Like Receptors Positively and Negatively Regulate the Interferon Response Induced by Cytosolic DNA

Yuki Nakaya et al. mBio. .

Abstract

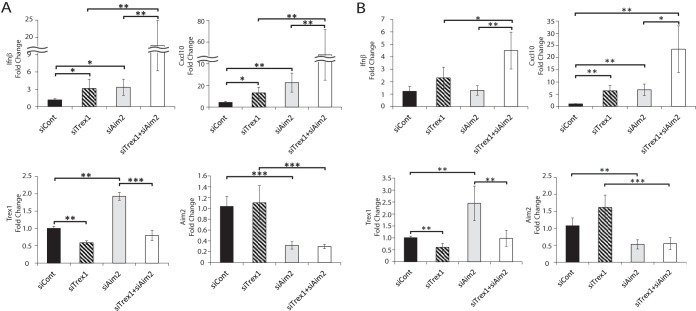
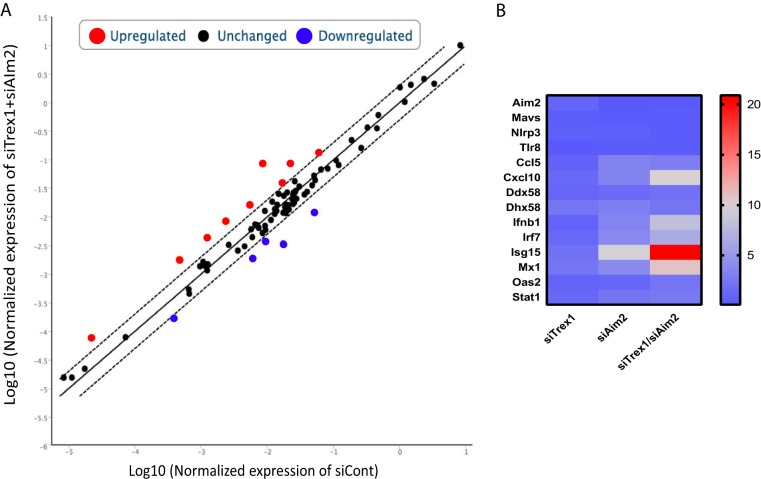
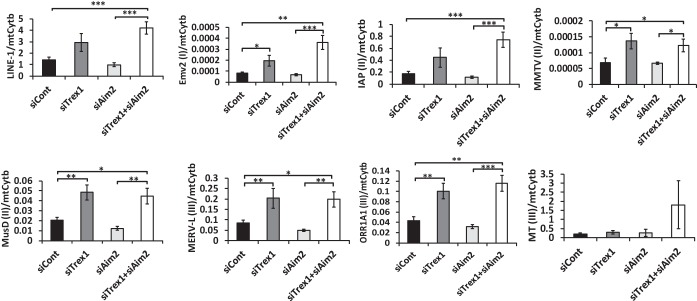
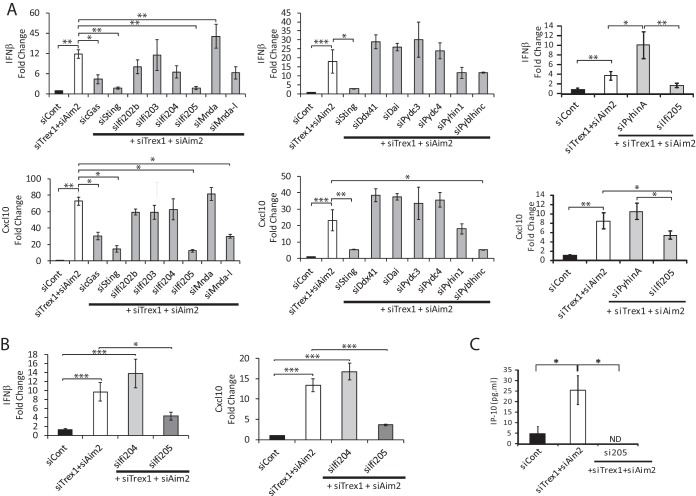
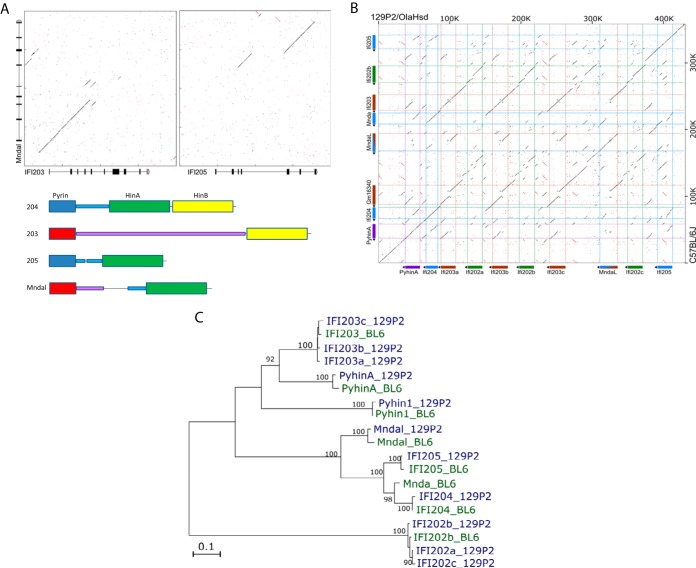
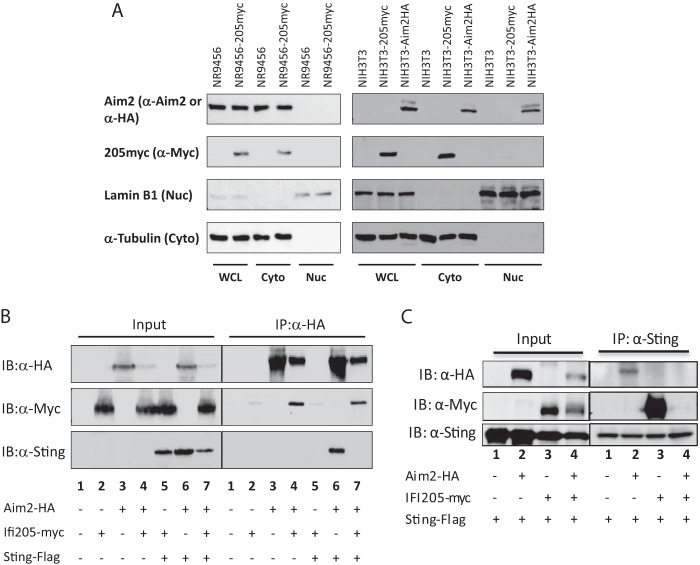
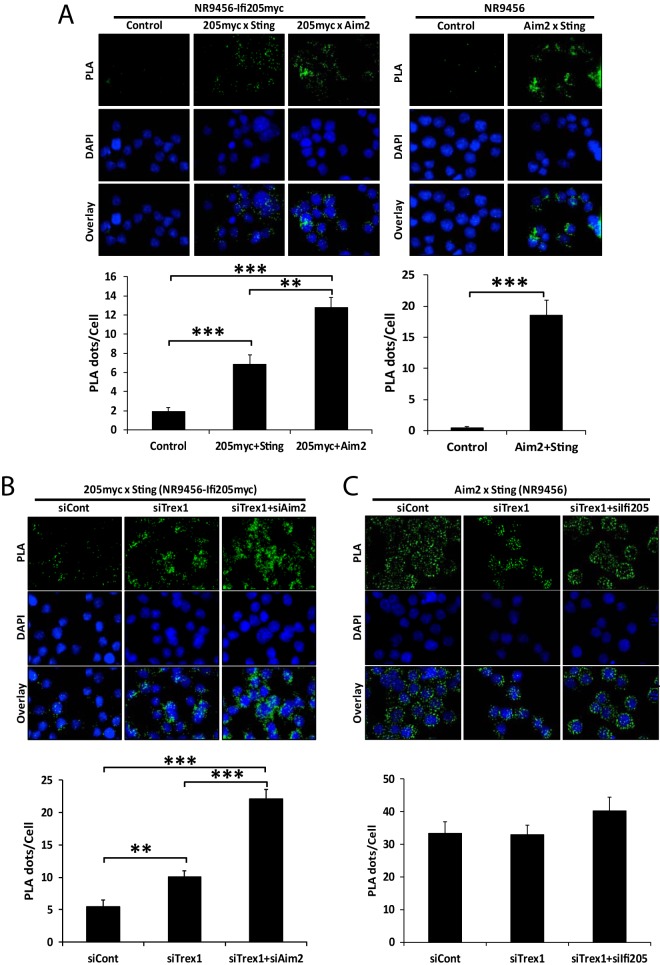
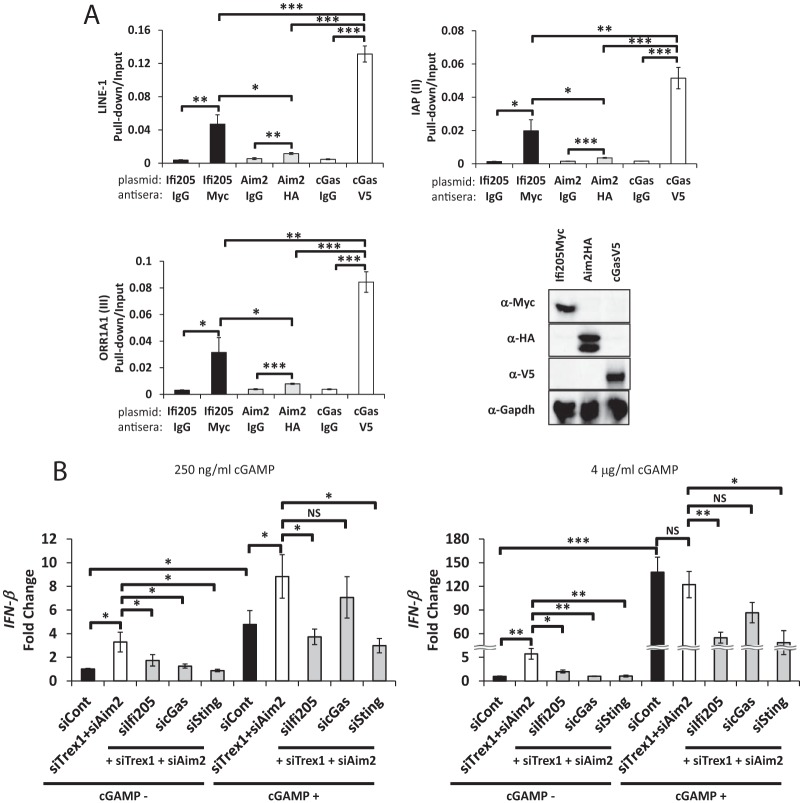
Cytosolic DNAs derived from retrotransposons serve as pathogen-associated molecular patterns for pattern recognition receptors (PRRs) that stimulate the induction of interferons (IFNs) and other cytokines, leading to autoimmune disease. Cyclic GMP-AMP synthase is one PRR that senses retrotransposon DNA, activating type I IFN responses through the stimulator of IFN genes (STING). Absent in melanoma 2 (AIM2)-like receptors (ALRs) have also been implicated in these pathways. Here we show that the mouse ALR IFI205 senses cytosolic retrotransposon DNA independently of cyclic GMP-AMP production. AIM2 antagonizes IFI205-mediated IFN induction activity by sequestering it from STING. We also found that the complement of genes located in the ALR locus in C57BL/6 and AIM2 knockout mice are different and unique, which has implications for interpretation of the sensing of pathogens in different mouse strains. Our data suggest that members of the ALR family are critical to the host IFN response to endogenous DNA.IMPORTANCE Autoimmune diseases like Aicardi-Goutières syndrome and lupus erythematosus arise when cells of the immune system become activated and attack host cells and tissues. We found that DNA generated by endogenous retroviruses and retroelements in inbred mice and mouse cells is recognized by several host proteins found in macrophages that are members of the ALR family and that these proteins both suppress and activate the pathways leading to the generation of cytokines and IFNs. We also show that there is great genetic diversity between different inbred mouse strains in the ALR genes, which might contribute to differential susceptibility to autoimmunity. Understanding how immune cells become activated is important to the control of disease.

Keywords: ALR; Aim2; Trex1; endogenous retrovirus; retrotransposon; self DNA.


Figures

FIG 1
FIG 1
Trex1 and Aim2 double knockdown induces a type I IFN response in macrophages. IFN-β, CXCL10, Trex1, and Aim2 RNA levels upon knockdown of the genes indicated in NR9456 cells (A) and BMDMs (B). RNA were analyzed by RT-qPCR. The values presented are normalized to Gapdh and are the mean ± the standard error of the mean of three experiments. *, P < 0.05; **, P < 0.005; ***, P < 0.0005 (two-tailed t test). The knockdown of TREX1 and AIM2 protein levels by siRNA treatment is shown in Fig. S2B. siCont, control siRNA.
FIG 2
FIG 2
Aim2 and Trex1 depletion increases ISG RNA levels. A PCR array of NR9456 cells was conducted after knocking down the genes indicated. (A) Scatterplot of the genes analyzed. (B) Heat map of genes with significant differences from those of control siRNA (siCont)-treated cells. Equal amounts of total RNAs from three different experiments were combined and subjected to cDNA synthesis. A single PCR array was performed.
FIG 3
FIG 3
Trex1 knockdown increases cytosolic retrotransposon DNA levels. (A) Cytosolic DNA was isolated from NR9456 cells treated with the siRNAs indicated. The retrotransposon DNA copy number was measured by qPCR and normalized to that of the mitochondrial gene for cytochrome b (mtCytb). I, II, and III in parentheses indicate class I, II, and III retroviruses, respectively. The values shown are the mean ± the standard error of the mean of three experiments. *, P < 0.05; **, P < 0.005; ***, P < 0.0005 (two-tailed t test). siCont, control siRNA.
FIG 4
FIG 4
Screening of the genes involved in the type I IFN response. RNAs isolated from NR9456 cells (A) and BMDMs (B) were treated with the siRNAs indicated and analyzed by RT-qPCR with IFN-β and CXCL10 primers. Values were normalized to Gapdh and are the mean ± the standard error of the mean of three experiments. Knockdown of each gene was confirmed (Fig. S6). Depletion of IFI205 was also confirmed at the protein level (Fig. S2B). (C) Supernatants of cells transfected with the siRNAs indicated were filtered and subjected to mouse IP-10 ELISA. The values shown are the mean ± the standard error of the mean of three independent experiments. ND, not detectable. *, P < 0.05; *, P < 0.05; **, P < 0.005; ***, P < 0.0005 (two-tailed t test). siCont, control siRNA.
FIG 5
FIG 5
Characterization of mouse Alr genes. (A) Dot plot comparing Mndal to Ifi203 from C57BL/6 mice and the predicted domain structures of Ifi203, Ifi204, Ifi205, and Mndal. (B) Dot plot comparing the region of the Alr locus from PyhinA to Ifi205 in 129P/OlaHsd and C57BL/6J mice. (C) Phylogenetic analysis of ALRs from different mouse strains.
FIG 6
FIG 6
Interaction of IFI205, AIM2, and STING. (A) Intracellular localization of IFI205 and AIM2 in NR9456 and NIH 3T3 cells. Lysates of cells stably expressing IFI205myc or AIM2HA were fractionated into cytoplasmic and nuclear fractions and then subjected to Western blotting with the antibodies indicated. Lamin B1 and α-tubulin were used as markers for the nucleus and cytoplasm, respectively. A single experiment was done for each panel. (B, C) Co-IP of IFI205myc, AIM2HA, and STING-FLAG. HEK293T cells were transfected with tagged proteins as indicated. Cells were lysed 48 h after transfection and immunoprecipitated (IP) with anti-HA (B) or anti-FLAG (C) antibodies. Proteins were detected by Western blotting with the antibodies indicated. The co-IP was repeated three times and gave the same results. WCL, whole-cell lysate; Cyto, cytoplasm; Nuc, nucleus; IB, immunoblotting.
FIG 7
FIG 7
IFI205-STING interaction increases upon TREX1 and AIM2 depletion. (A) PLA for interactions of IFI205myc-AIM2, IFI205myc-STING, and AIM2-STING in NR9456-IFI205myc or NR9456 cells. The number of cells and images quantified for each condition in NR9456-IFI205myc cells are as follows: IFI205myc-Sting, 141 cells and 10 images; IFI205myc-Aim2, 101 cells and 6 images; control, 65 cells and 5 images. The number of cells and images quantified for each condition in NR9456 cells are as follows: control, 74 cells and 5 images; Aim2-Sting, 47 cells and 5 images. Controls for knockdowns are shown in Fig. S9A. (B) PLA for IFI205myc-STING interactions in NR9456-IFI205myc cells with knockdown of the genes indicated. Quantification: siCont, 102 cells and 5 images; siTrex1, 190 cells and 7 images; siTrex1+siAim2, 108 cells and 5 images. A representative image is shown. This experiment was repeated twice and gave similar results both times. (C) PLA for AIM2-STING interaction in NR9456 cells after knockdown of the genes indicated. Quantification: siCont, 84 cells and 4 images; siTrex1, 33 cells and 4 images; siTrex1+si205, 58 cells and 4 images. PLA dots were quantified and normalized to cell numbers based on DAPI staining with ImageJ software. The values shown are the mean ± the standard error of the mean of different pictures. **, P < 0.005; ***, P < 0.0005. (two-tailed t test). siCont, control siRNA.
FIG 8
FIG 8
IFI205 binds to the cytoplasmic DNAs of endogenous retrotransposons and induces a cGAMP-independent IFN response (A) DNA pulldown assay for IFI205, AIM2, and cGAS. NIH 3T3 cells were transiently transfected with expression plasmids for IFI205myc, AIM2HA, or cGASV5 and harvested 48 h after transfection. The cytoplasmic fractions were subjected to a DNA pulldown assay with the antibodies indicated. Normal IgG was used as a negative control. Bound DNA copy numbers were measured by qPCR and normalized to input DNA values. The assays were repeated three times for each protein, and qPCR was performed in triplicate for each experiment. Protein expression was confirmed by Western blotting with the same lysates and antibodies used for the DNA pulldown. (B) NR9456 cells were transfected with the siRNAs indicated and cGAMP at the concentrations shown. IFN-β expression levels were measured by RT-qPCR and normalized to Gapdh. The values shown are the mean ± the standard error of the mean of three experiments. *, P < 0.05; **, P < 0.005; ***, P < 0.0005; NS, not significant (two-tailed t test). siCont, control siRNA.

References

    1. Liu J, Qian C, Cao X. 2016. Post-translational modification control of innate immunity. Immunity 45:15–30. doi:10.1016/j.immuni.2016.06.020. - DOI - PubMed
    1. Luecke S, Paludan SR. 14 October 2016. Molecular requirements for sensing of intracellular microbial nucleic acids by the innate immune system. Cytokine. doi:10.1016/j.cyto.2016.10.003. - DOI - PubMed
    1. Stetson DB, Ko JS, Heidmann T, Medzhitov R. 2008. Trex1 prevents cell-intrinsic initiation of autoimmunity. Cell 134:587–598. doi:10.1016/j.cell.2008.06.032. - DOI - PMC - PubMed
    1. Brégnard C, Guerra J, Dejardin S, Passalacqua F, Benkirane M, Laguette N. 2016. Upregulated LINE-1 activity in the Fanconi anemia cancer susceptibility syndrome leads to spontaneous pro-inflammatory cytokine production. EBioMedicine 8:184–194. - PMC - PubMed
    1. Gifford R, Tristem M. 2003. The evolution, distribution and diversity of endogenous retroviruses. Virus Genes 26:291–315. doi:10.1023/A:1024455415443. - DOI - PubMed

Publication types

MeSH terms