. 2017 Jul 6;2(13):e93688.
doi: 10.1172/jci.insight.93688.

Anti-citrullinated protein antibodies cause arthritis by cross-reactivity to joint cartilage

Affiliations

Anti-citrullinated protein antibodies cause arthritis by cross-reactivity to joint cartilage

Changrong Ge et al. JCI Insight. .

Abstract

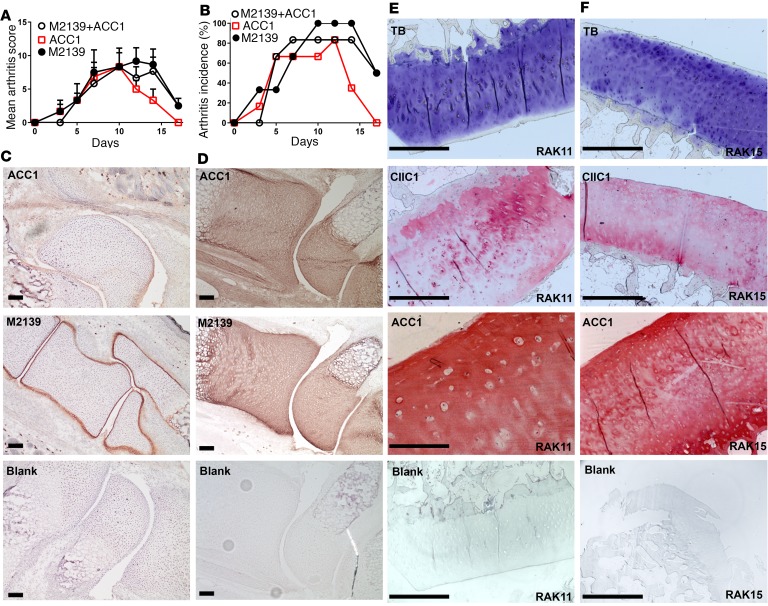
Today, it is known that autoimmune diseases start a long time before clinical symptoms appear. Anti-citrullinated protein antibodies (ACPAs) appear many years before the clinical onset of rheumatoid arthritis (RA). However, it is still unclear if and how ACPAs are arthritogenic. To better understand the molecular basis of pathogenicity of ACPAs, we investigated autoantibodies reactive against the C1 epitope of collagen type II (CII) and its citrullinated variants. We found that these antibodies are commonly occurring in RA. A mAb (ACC1) against citrullinated C1 was found to cross-react with several noncitrullinated epitopes on native CII, causing proteoglycan depletion of cartilage and severe arthritis in mice. Structural studies by X-ray crystallography showed that such recognition is governed by a shared structural motif "RG-TG" within all the epitopes, including electrostatic potential-controlled citrulline specificity. Overall, we have demonstrated a molecular mechanism that explains how ACPAs trigger arthritis.

Keywords: Autoimmunity; Immunology.


Conflict of interest statement

Conflict of interest: R. Holmdahl is coinventor of a patent (US 7,148,020 B2) protecting the use of collagen triple-helical epitopes for diagnostic use.

Figures

Figure 1
Figure 1. Anti-C1 epitope antibody responses in RA.
(A) The sequence of synthetic C1 epitope (CII259-269) variants. The lysine knot placed at the C terminus establishes the requisite register for triple-helix formation with the identical peptide strands, whereas two cysteine residues were added to a single α chain to achieve cyclization via disulfide bonds. Biotin was added to all peptides, as indicated for detection in Luminex assay. The corresponding citrullinated peptides have the same sequence, aside from substitution of arginine with citrulline residues at the given position, i.e., 360 and 365. O, (2S,4R)-4-hydroxyproline; Ahx, aminocaproic acid. (B and C) IgG response of the TIRA2 cohort (504 RA patients and 285 healthy controls) to peptides containing variants of the triple-helical C1 epitope (B) or to the cyclic α chain of the C1 epitope (C). All biotinylated peptides were captured on beads via recognition of NeutrAvidin, which was immobilized on the beads through amine coupling. Human serum samples were diluted 1:100 (v/v) in assay buffer and incubated for 60 minutes at room temperature on a shaker for preadsorption of unspecific antibodies. Then, the serum samples were transferred to a 384-well plate containing peptide-coated beads. After incubation at room temperature on a shaker for 75 minutes, all beads were washed with PBS-T and resuspended in a solution containing the secondary anti-human IgG Fcy-PE. After 40 minutes of incubation, the beads were washed with PBS-T and then measured. The median fluorescence intensity (MFI) was used to quantify the interaction of serum antibody with the given peptides. The red line indicates the cutoff value for positivity as described in the Methods. Mann-Whitney U test was used to calculate P values for differences between groups (*P < 0.05, **P < 0.01, ***P < 0.001, ****P < 0.0001). The red line indicates the cutoff (median + 5 × median absolute deviation [MAD]) based on healthy controls. MFI, median fluorescence intensity; RA, rheumatoid arthritis; HC, healthy controls; RT, room temperature.
Figure 2
Figure 2. Correlation of antibody responses against different C1 epitope variants in RA.
(A) Pairwise comparison was performed between cyclic unmodified C1 peptides (C1-R360 and C1-R365) and the triple-helical peptide containing the unmodified C1 epitope (C1_R-R). (B) Pairwise comparisons were performed between the citrullinated cyclic C1 peptides (C1-CIT360 and C1-CIT365) and the prominent triple-helical C1 peptide (C1_CIT-R). Comparison was also performed between the citrullinated cyclic C1-CIT360 and classical CEP1 peptide. A total of 504 RA patients from TIRA2 cohort was used in the analysis. MFI, median fluorescence intensity; RA, rheumatoid arthritis. The red line indicates the cutoff (median + 5 × median absolute deviation [MAD]) based on healthy controls.
Figure 3
Figure 3. Characterization of the cross-reactivity of ACC1.
(A) Responses of ACC1, ACC3, ACC4, CIIC1, and GB8 toward cyclic CII peptides and triple-helical CII peptides determined in the Luminex assay (Supplemental Table 2). A total of 127 peptides was used in the assay, and each dot represents a unique peptide. The median fluorescence intensity (MFI) was used to quantify the interaction of antibody with given peptides. (B) Reactivity of ACC1 toward triple-helical CII peptides (107 triple-helical peptides from Supplemental Table 1) measured by surface plasmon resonance (SPR). Sensograms were processed using an automatic correction for nonspecific bulk-refractive index effects. Data processing and analysis were performed using Biacore T200 evaluation software in a heterogenous binding model (GE Healthcare). 13, CII121-144; 21, CII241-264; 43, CII571-591; 66, CII916-939; 67, CII931-954; ptm15/ptm16, C1-T-CIT365; ptm35/36, F4-T-CIT933. (C) Preference of ACC1 for citrullinated CCP1 compared with the corresponding unmodified CCP1. Data are representative of results from triplicate assays. (D) Reactivity of ACC1, ACC3, ACC4, and 15A toward peptides from the CCP2 kit. The peptides from the Immunoscan CCPlus Kit (Euro Diagnostica) were used to measure the binding of ACC1, ACC3, ACC4, and 15A (COMP-specific antibody). The absorbance value at 405 nm was used to quantify the binding capacity. Data are representative of results from two assays performed using duplicate technical replicates. SPR, surface plasmon resonance; CII, collagen type II.
Figure 4
Figure 4. Evaluation of ACC1 in mice and RA in terms of pathogenicity and cartilage-binding capacity.
(A and B) ACC1-mediated arthritis in mice by passive transfer. Both arthritis score (A) and incidence (B) are shown. Four groups of B10.Q mice (6 mice in each group) were injected with PBS, ACC1, M2139, and a cocktail of M2139+ACC1, respectively. All mice received 25 μg LPS from E. coli intraperitoneally on day 5. Data represent mean ± SEM (n = 6 in each group) in A. (C and D) The cartilage binding of ACC1 to mouse cartilage was evaluated by immunohistochemical staining both in vivo (C) and in vitro (D). The knee joints and paws from adult mice were stained with H&E or toluidine blue. For in vivo staining, the knee joints from a 2-day-old neonate Cia9i mouse injected with biotinylated antibodies were used. To assess direct binding of mAbs to the tissue sections in vitro, limbs from 2-day-old naive Cia9i neonates were used. Scale bar: 100 μm (C and D). (E and F) Immunohistochemical staining of cartilage from the finger joints of two rheumatoid arthritis (RA) patients. The deparaffinized sections (5–8 μm) were treated with testicular hyaluronidase, followed by incubation with ACC1. The sections were visualized with permanent red (Dako) as color substrate. Nuclei were counterstained by hematoxylin. For positive control staining, deparaffinized sections were incubated with the mouse anti-CII mAb CIIC1 specific for triple-helical CII. Negative control staining lacked the primary anti-mouse IgG antibody. Samples were stained with ACC1, secondary antibody control (negative control), CIIC1 (positive control), and toluidine blue (TB). RAK11 and RAK15 represent two patients. Scale bar: 1,000 μm (E and F).
Figure 5
Figure 5. Crystal structures of the ACC1Fab-peptide complexes.
(A) The ACC1Fab heavy and light chains are shown in white and blue, respectively. The bound C1-CIT365-L peptide (yellow sticks) is in the paratope formed by 3 CDR loops from each heavy and light chain of the ACC1Fab. The variable and constant domains of both chains (VH, VL, CH1, and CL) each contain a disulfide bond, shown as sticks with carbon atoms in green and sulfur atoms in yellow. (B) The dimensions of the paratope are outlined by the semitransparent molecular envelope of the ACC1Fab, which is colored white for the heavy chain and blue for the light chain. The bound C1-CIT365-L peptide is depicted in yellow, and all ACC1 residues located within a 4-Å radius from the peptide are depicted as sticks with carbon atoms in white or light blue in accordance with heavy or light chain origin; oxygen atoms are depicted in red, and nitrogen atoms are depicted in blue. (C and D) Comparison of the peptide-binding modes, with the paratopes viewed from the side (C) and the top (D). The 5 ACC1Fab-peptide complexes were superimposed based on the heavy-chain variable domain. The molecular envelope of the ACC1Fab is colored as in B, bound peptides are shown in yellow (C1-CIT365-L), orange (C1-CIT365-T), magenta (CII538-591 in the crystal of space group P212121), mauve (CII538-591 in P1), and green (CII616-639-CIT). The orientation of the peptides is indicated by labeling of their N- and C-termini. (E) Schematic presentation of peptide-binding site in ACC1Fab. The nonconserved side chains (R2-R5) and invisible parts in electron density (R1, R6) are abbreviated. Only hydrogen bonds observed in at least a third of the 40 analyzed ACC1Fab-peptide complexes are shown. Intrapeptide hydrogen bonds are indicated by black dotted lines, hydrogen bonds between the peptide and the Fab are indicated as solid blue lines. The heavy- or light-chain origin is indicated by an h or l suffix, respectively. The counter ion of unknown type is indicated by a green circle. CDR, complementarity-determining region; Fab, antigen-binding fragment; VH, heavy-chain variable domain; VL, light chain variable domain; CH1, heavy-chain constant domain; CL, light-chain constant domain.
Figure 6
Figure 6. Hydrogen-bonding network formed upon peptide binding to ACC1, with emphasis on conserved interactions.
The chosen orientation focuses on the conserved interactions between the threonine of the conserved peptide motif and the H3 CDR loop (see Supplemental Figure 5 for another orientation). The heavy and light chains of the ACC1Fab are shown in white and blue, respectively. Fab residues forming hydrogen bonds to the peptide are shown as sticks, with carbon atoms colored according to their chain of origin and labeled in black. To improve clarity, residues lying behind the peptide are not labeled. Hydrogen bonds are indicated as black dotted lines, water molecules are indicated as red spheres. The peptides are shown as thicker sticks, with carbon atoms in yellow (C1-CIT365-L), mauve (CII538-591 in space group p1), and green (CII616-639-CIT), respectively. All peptide residues other than glycine, proline (except the proline occurring in CII538-591 and CII616-639-CIT at the same position as the citrulline in C1-CIT365-L and C1-CIT365-T), and 4-hydroxyproline are labeled in bold and according color. (A) ACC1Fab-C1-CIT365-L. (B) ACC1Fab-CII538-591 as in P1 space group. (C) ACC1Fab-CII616-639-CIT. (The hydrogen bonding networks of the complexes ACC1Fab-C1-CIT365-T and ACC1Fab-CII538-591 in P212121 are shown in Supplemental Figure 4). CDR, complementarity-determining region; Fab, antigen-binding fragment.
Figure 7
Figure 7. Comparison of CDR loop conformation and peptide binding by ACC1, ACC4, CIIC1, and M2139.
(A) All 5 ACC1Fab peptide complexes reported here were superimposed based on the Cα atom coordinates of their respective VH domains. The backbone of the ACC1Fab in the complex with CII616-639-CIT is shown in stereo view, with heavy and light chains colored white and blue, respectively, except for the hypervariable CDR loop regions. The superimposed CDR loops and peptides of the respective ACC1Fab-peptide complexes are shown in yellow for the C1-CIT365-L complex, bright orange for C1-CIT365-T, mauve for CII538-591 in space group P1, magenta for CII538-591 in space group P212121, and green for the CII616-639-CIT complex. (B) Stereo view of the superimposed ACC1Fab-C1-CIT365-L (white) and ACC4Fab-C1Cit1 (gray) (PDB ID: 2W65) structures. The CDR loops of the ACC1 heavy chain are colored yellow (H1), orange (H2), and red (H3); those of the light chain are colored cyan (L1), marine (L2), and dark blue (L3). The cartoon representation of the C1-CIT365-L peptide bound to the ACC1Fab is shown in dark green, and that of the C1Cit1 peptide bound to ACC4Fab is shown in magenta. (C) Stereo view of the superimposed ACC1Fab-C1-CIT365-L (white), CIIC1Fab-C1 (dark grey) (PDB ID: 2Y5T), and M2139Fab-J1 (light gray) (PDB ID: 4BKL) structures. The CDR loops of the ACC1 heavy chain are colored as in B. The cartoon representation of the C1-CIT365-L peptide bound to the ACC1Fab is shown in dark green, and those of the triple-helical C1 and J1 peptides bound to CIIC1Fab and M2139Fab are shown in magenta and pink, respectively. CDR, complementarity-determining region; VH, heavy-chain-variable.
Figure 8
Figure 8. Pathogenicity of ACC1 mediated by cross-reactivity.
CII exists in a dynamic state composed of both compact and relatively flexible conformations, which is essential for ensuring the mechanical resistance of collagen in joint cartilage. Under inflammatory conditions, this equilibrium state of triple-helical structure is disrupted. The citrullination resulting from dysregulation of PADs on some arginine residues further deteriorates triple-helical stability, leading to exposure of CII epitopes to immune systems. ACPAs, such as ACC1, attack CII via a shared structural motif, “RG-TG,” within all the epitopes, including the ones bearing a citrulline residue (e.g., C1-CIT365), to which the recognition is governed by electrostatic potential-controlled citrulline specificity. The triple-helical CII is shown as gray ribbon with the motif RG-TG marked in magenta. The arginine residue within this motif is colored in blue, while the corresponding citrulline is in yellow. CII, collagen type II; PADs, peptidylarginine deiminases.

Similar articles

Cited by

References

    1. McInnes IB, Schett G. The pathogenesis of rheumatoid arthritis. N Engl J Med. 2011;365(23):2205–2219. doi: 10.1056/NEJMra1004965. - DOI - PubMed
    1. Sangha O. Epidemiology of rheumatic diseases. Rheumatology (Oxford) 2000;39 Suppl 2:3–12. - PubMed
    1. Schellekens GA, et al. The diagnostic properties of rheumatoid arthritis antibodies recognizing a cyclic citrullinated peptide. Arthritis Rheum. 2000;43(1):155–163. doi: 10.1002/1529-0131(200001)43:1<155::AID-ANR20>3.0.CO;2-3. - DOI - PubMed
    1. Aho K, Heliovaara M, Maatela J, Tuomi T, Palosuo T. Rheumatoid factors antedating clinical rheumatoid arthritis. J Rheumatol. 1991;18(9):1282–1284. - PubMed
    1. Rantapaa-Dahlqvist S, et al. Antibodies against cyclic citrullinated peptide and IgA rheumatoid factor predict the development of rheumatoid arthritis. Arthritis Rheum. 2003;48(10):2741–2749. doi: 10.1002/art.11223. - DOI - PubMed