. 2017 Jul 6;2(13):e92530.
doi: 10.1172/jci.insight.92530.

SOCS1 is a negative regulator of metabolic reprogramming during sepsis

Affiliations

SOCS1 is a negative regulator of metabolic reprogramming during sepsis

Annie Rocio Piñeros Alvarez et al. JCI Insight. .

Abstract

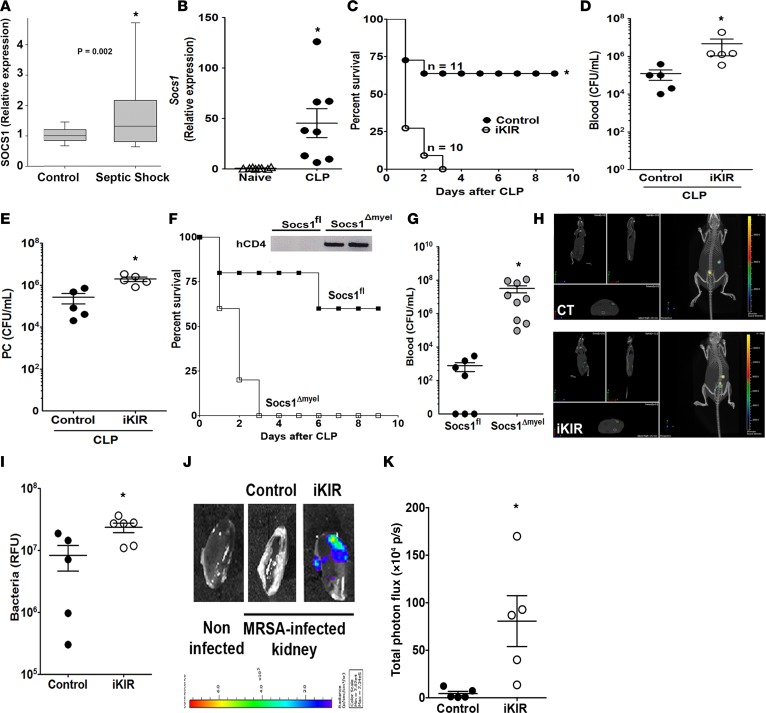
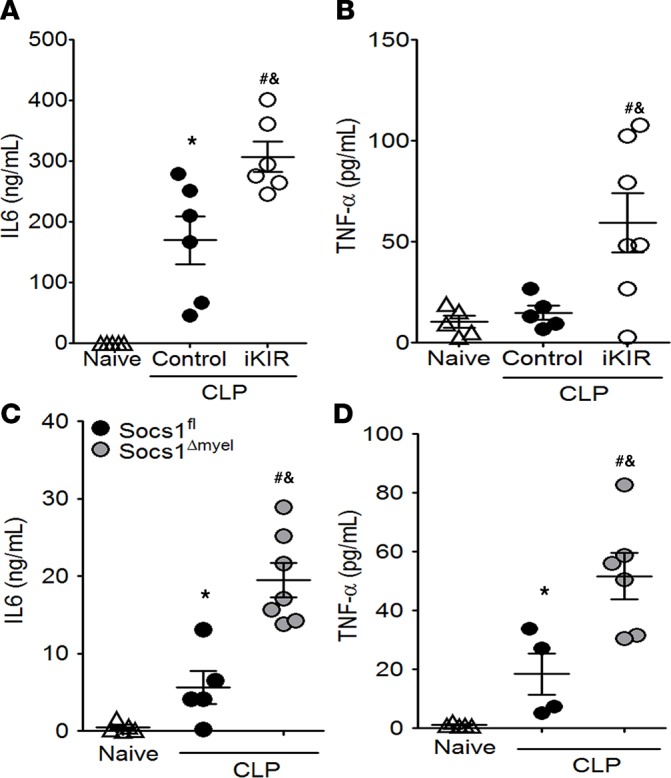
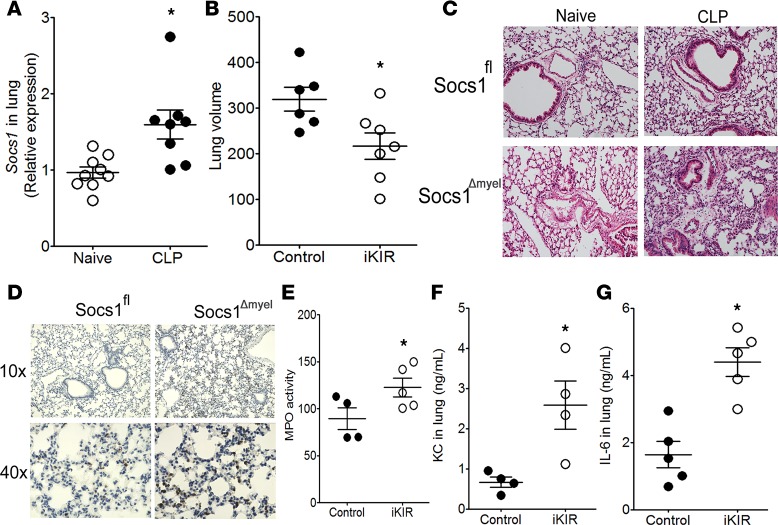
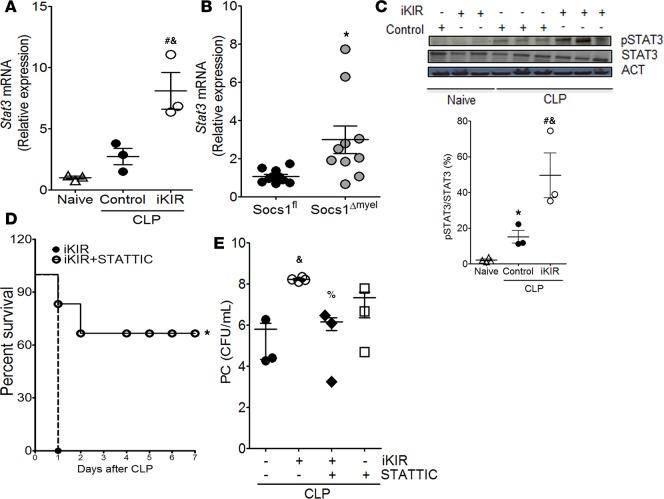
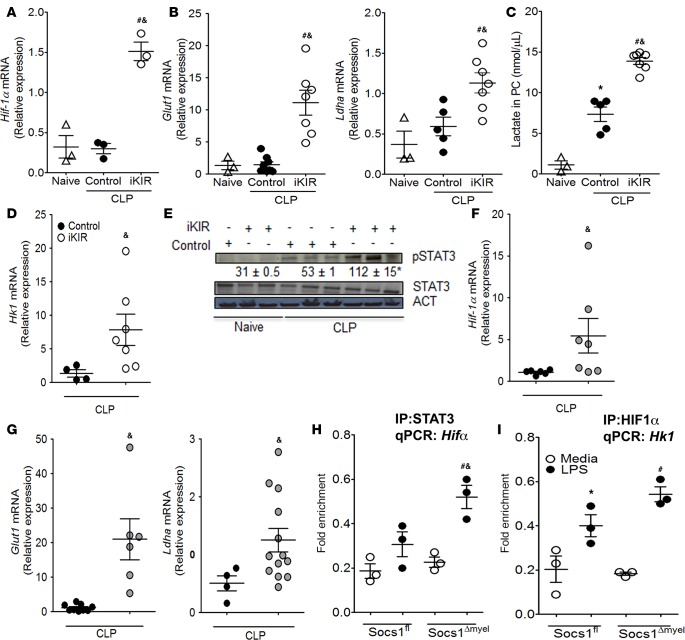
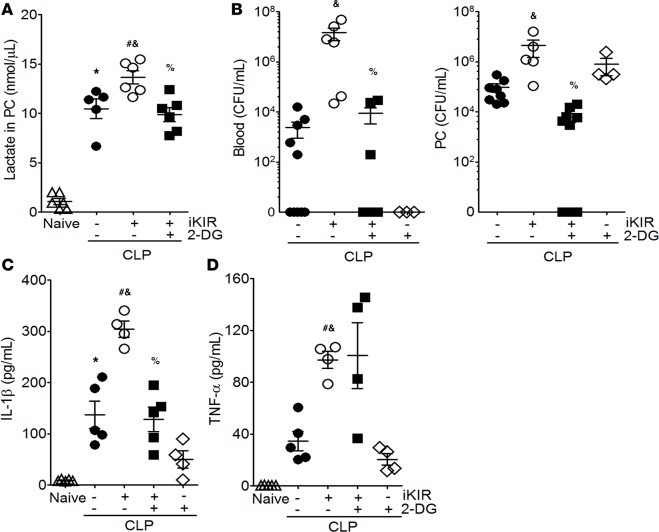
Sepsis can induce an overwhelming systemic inflammatory response, resulting in organ damage and death. Suppressor of cytokine signaling 1 (SOCS1) negatively regulates signaling by cytokine receptors and Toll-like receptors (TLRs). However, the cellular targets and molecular mechanisms for SOCS1 activity during polymicrobial sepsis are unknown. To address this, we utilized a cecal ligation and puncture (CLP) model for sepsis; C57BL/6 mice subjected to CLP were then treated with a peptide (iKIR) that binds the SOCS1 kinase inhibitory region (KIR) and blocks its activity. Treatment with iKIR increased CLP-induced mortality, bacterial burden, and inflammatory cytokine production. Myeloid cell-specific SOCS1 deletion (Socs1Δmyel) mice were also more susceptible to sepsis, demonstrating increased mortality, higher bacterial loads, and elevated inflammatory cytokines, compared with Socs1fl littermate controls. These effects were accompanied by macrophage metabolic reprograming, as evidenced by increased lactic acid production and elevated expression of the glycolytic enzymes hexokinase, lactate dehydrogenase A, and glucose transporter 1 in septic Socs1Δmyel mice. Upregulation was dependent on the STAT3/HIF-1α/glycolysis axis, and blocking glycolysis ameliorated increased susceptibility to sepsis in iKIR-treated CLP mice. These results reveal a role of SOCS1 as a regulator of metabolic reprograming that prevents overwhelming inflammatory response and organ damage during sepsis.

Keywords: Immunology; Metabolism.


Conflict of interest statement

Conflict of interest: The authors have declared that no conflict of interest exists.

Figures

Figure 1
Figure 1. Inhibition of SOCS1 increases bacterial burden and organ damage during sepsis.
(A) SOCS1 mRNA expression levels in the blood of septic pediatric patients and normal controls, as determined by qPCR (septic shock, n = 180 and normal controls, n = 52); ANOVA, and corrections for multiple comparisons were performed using a Benjamini-Hochberg false discovery rate of 5%. (B) Socs1 mRNA expression levels in C57BL/6 mouse peritoneal cells 18 hours after cecal ligation and puncture–induced (CLP-induced) sepsis, as determined by qPCR (n = 8 mice/group, t test, Mann-Whitney U test); *P < 0.05 vs. sham-operated mice or normal controls. (C) Survival rates for C57BL/6 mice treated with inhibitor of the kinase inhibitory region (iKIR) or scrambled peptide control prior to receiving moderate CLP. Survival was monitored for 9 days (n = 10 mice/group, log-rank [Mantel-Cox] test). Bacterial burden in the (D) blood and (E) peritoneal cavity (PC) was determined 18 hours after CLP (n = 4–5 mice/group, unpaired t test, Mann-Whitney U test). (F) Survival rates for of Socs1Δmyel and Socs1fl septic mice. Survival was monitored for 9 days (n = 13 mice/group, log-rank [Mantel-Cox] test). Inset: Immunoblot of hCD4 confirming Cre recombination in peritoneal cells from Socs1Δmyel mice and no recombination in Socs1fl (control) mice. (G) Bacterial burden in the blood of Socs1Δmyel and Socs1fl septic mice, 18 hours after CLP surgery (n = 7–9 mice/group, t test, Mann-Whitney U test). (H) Bioluminescent methicillin–resistant Staphylococcus aureus (MRSA) load was determined using the in vivo animal imaging (IVIS) detection system in the peritoneal cavity of mice treated with iKIR at 24 hours and 1 hour before infection. (I) Representative diffuse light imaging tomography (DLIT) MRSA CT overlay of mice treated with iKIR or peptide control and infected with bioluminescent MRSA for 24 hours (n = 5-6 mice/group, unpaired t test). (J) Bioluminescent MRSA infection in the kidney 24 hours after infection. (K) Representative DLIT MRSA CT overlays from the kidneys of mice treated with iKIR or peptide control and infected with bioluminescent MRSA for 24 hours (n = 5–6 mice/group, t test, Mann-Whitney U test). Scatter plot shows individual values, mean, and SEM; *P < 0.05, septic vs. control or naive group.
Figure 2
Figure 2. Pharmacological inhibition of SOCS1 or SOCS1 deficiency increases the systemic proinflammatory response in septic mice.
Quantification of IL-6 and TNF-α levels in serum from mice treated with inhibitor of the kinase inhibitory region (iKIR) or control peptide (A and B), and from Socs1Δmyel and Socs1fl mice (C and D) 18 hours after the onset of sepsis. Scatter plot shows individual values, mean, and SEM. *P < 0.05, control septic mice vs. naive, or Socs1fl septic mice vs. naive; #P < 0.05, iKIR-treated septic mice vs. naive, or Socs1Δmyel septic mice vs. naive; &P < 0.05 iKIR-treated septic mice vs. control-treated septic mice, or Socs1Δmyel septic mice vs. Socs1fl septic mice. In all circumstances, n = 4–7 mice/group and 1-way ANOVA followed by Bonferroni correction.
Figure 3
Figure 3. SOCS1 inhibits lung injury during sepsis.
(A) Socs1 expression in the lung of septic mice was quantified 18 hours after cecal ligation and puncture (CLP) (n = 8–9 mice/group, unpaired t test). (B) Quantification of lung volume in inhibitor of the kinase inhibitory region–treated (iKIR-treated) septic mice 18 hours after CLP by microCT analysis (n = 6–7 mice/group, unpaired t test). (C) Histological analysis with H&E staining of lung tissue from Socs1Δmyel and Socs1fl septic and their respective naive mice (original magnification, ×100). (D) Detection of Ly6G+ neutrophils in Socs1Δmyel and Socs1fl mice, 18 hours after the onset of sepsis. Original magnifications, ×100 and ×400. (E) Pulmonary myeloperoxidase (MPO) activity in the lung of iKIR-treated septic mice. (F) KC and (G) IL-6 production in the lung of iKIR-treated septic mice. E: n = 4 mice/group, t test, Mann-Whitney U test. F: n = 4–5 mice/group, unpaired t test. Scatter plot shows individual values, mean, and SEM. *P < 0.05, iKIR-treated vs. control or naive mice.
Figure 4
Figure 4. SOCS1 mediates protective effects during sepsis via blockage of STAT3 activation.
Levels of Stat3 mRNA expression 18 hours after onset of sepsis as quantified by qPCR in peritoneal cells from inhibitor of the kinase inhibitory region–treated (iKIR-treated) septic mice (A) or Socs1Δmyel septic mice (B). A: n = 3 mice/group, 1-way ANOVA followed by Bonferroni correction; B: n = 9–10 mice/group, t test. (C) Top: Lung cells were harvested 18 hours after induction of sepsis in mice treated with iKIR or control peptide and subjected to immunoblotting for determination of total STAT3 and phosphorylated STAT3 (Tyr705) expression. Bottom: Histogram showing mean densitometric analysis of immunoblots (n = 3–4 mice/group, 1-way ANOVA followed by Bonferroni correction). (D) Survival rates of iKIR-treated septic mice that were treated (or not) with STATTIC at 24 hours and 1 hour before cecal ligation and puncture (CLP) and once daily for 3 days after CLP (n = 7–8 mice/group, log-rank [Mantel-Cox] test). (E) Bacterial load in mice treated as in D. CFU determined 18 hours after CLP (n = 3–4 mice/group, 1-way ANOVA followed by Bonferroni correction). Scatter plot shows individual values, mean, and SEM. *P < 0.05, control septic mice vs. naive, Socs1Δmyel septic mice vs. Socs1fl; #P < 0.05, iKIR-treated septic mice vs. naive; %P < 0.05, STATTIC- and iKIR-treated septic mice vs. iKIR-treated septic mice; &P < 0.05, iKIR-treated septic mice vs. control septic mice.
Figure 5
Figure 5. SOCS1 amplifies HIF-1α–mediated glycolysis during sepsis.
Septic mice treated with inhibitor of the kinase inhibitory region (iKIR) or control peptide were sacrificed 18 hours after cecal ligation and puncture (CLP), and mRNA expression levels of (A) Hif-1α (n = 3 mice/group, 1-way ANOVA followed by Bonferroni correction) or (B) Glut1 and Ldha were quantified in peritoneal cells by qPCR (n = 3–7 mice/group, 1-way ANOVA followed by Bonferroni correction). (C) Lactate levels in peritoneal exudate (n = 3–7 mice/group, 1-way ANOVA followed by Bonferroni). (D) Hk1 mRNA expression as determined by qPCR in peritoneal cells from mice treated as in A (n = 4–6 mice/group, t test, Mann-Whitney U test). (E) Lung cells were harvested 18 hours after CLP in mice treated with iKIR or control peptide and subjected to immunoblotting for determination of hexokinase expression. Numbers: Mean densitometric analysis of the bands from immunoblots (n = 3–4 mice/group, 1-way ANOVA followed by Bonferroni correction). Expression of (F) Hif-1α, (G) Glut1, and Ldha mRNA transcripts was determined by qPCR in peritoneal cells from Socs1Δmyel or Socs1fl septic mice. F: n = 4–7 mice/group, t test, Mann-Whitney U test. G: Glut1: n = 6–9 mice/group, t test, Mann-Whitney U test. Ldha: n = 4–13 mice/group, t test, Mann-Whitney U test. (H and I) Peritoneal macrophages from Socs1Δmyel or Socs1fl were stimulated with 100 ng/ml LPS for 24 hours, and ChIP assays were performed using anti-STAT3 (H), anti–HIF-1α (I), or isotype control IgG antibodies. Pulled-down DNA was subjected to qPCR amplification using specific primers against the promoter for Hif-1α (H) or Hk1 (I). H and I: n = 3 mice/group, 1-way ANOVA followed by Bonferroni correction. Scatter plot shows individual values, mean, and SEM. *P < 0.05, control septic mice vs. naive; #P<0.05, iKIR-treated septic mice vs. naïve; &P<0.05, iKIR-treated septic mice vs. control-treated septic mice, or Socs1Δmyel vs. Socs1fl septic mice. Experiments in vitro: *P < 0.05, LPS-Socs1fl vs. media-Socs1fl macrophages; #P < 0.05, LPS-Socs1Δmyel vs. media-Socs1Δmyel macrophages; &P < 0.05, LPS-Socs1fl vs. LPS-Socs1Δmyel macrophages. PC, peritoneal cavity.
Figure 6
Figure 6. Increased glycolysis is responsible for iKIR-mediated animal mortality during sepsis.
Mice were treated with the competitive hexokinase inhibitor 2-deoxyglucose (2-DG; 0.5 g/kg, i.p.) daily for 4 days and 1 hour before cecal ligation and puncture (CLP). The animals were also treated with iKIR (inhibitor of the kinase inhibitory region), 24 hours and 1 hour before surgery. (A) Lactate levels in peritoneal exudate (n = 5–7 mice/group, 1-way ANOVA followed by Bonferroni correction). (B) Bacterial loads were determined in blood and peritoneal exudate 18 hours after CLP (n = 4–9 mice/group, 1-way ANOVA followed by Bonferroni correction). Levels of IL-1β (C) and TNF-α (D) were quantified in peritoneal exudate (n = 4–5 mice/group, 1-way ANOVA followed by Bonferroni correction). Scatter plot shows individual values, mean, and SEM. *P < 0.05, control-treated septic mice vs. naive; &P<0.05, iKIR vs. control-treated septic mice; %P<0.05, iKIR and 2-DG vs. iKIR-treated septic mice; #P<0.05, iKIR-septic mice vs. naive mice. PC, peritoneal cavity.

Similar articles

Cited by

References

    1. Singer M, et al. The Third International Consensus Definitions for Sepsis and Septic Shock (Sepsis-3) JAMA. 2016;315(8):801–810. doi: 10.1001/jama.2016.0287. - DOI - PMC - PubMed
    1. Hotchkiss RS, Moldawer LL, Opal SM, Reinhart K, Turnbull IR, Vincent JL. Sepsis and septic shock. Nat Rev Dis Primers. 2016;2:16045. - PMC - PubMed
    1. Medzhitov R, Schneider DS, Soares MP. Disease tolerance as a defense strategy. Science. 2012;335(6071):936–941. doi: 10.1126/science.1214935. - DOI - PMC - PubMed
    1. Chovatiya R, Medzhitov R. Stress, inflammation, and defense of homeostasis. Mol Cell. 2014;54(2):281–288. doi: 10.1016/j.molcel.2014.03.030. - DOI - PMC - PubMed
    1. Jamieson AM, et al. Role of tissue protection in lethal respiratory viral-bacterial coinfection. Science. 2013;340(6137):1230–1234. doi: 10.1126/science.1233632. - DOI - PMC - PubMed