. 2017 Jul 6;2(13):e92282.
doi: 10.1172/jci.insight.92282.

Islet inflammation and ductal proliferation may be linked to increased pancreatitis risk in type 2 diabetes

Affiliations

Islet inflammation and ductal proliferation may be linked to increased pancreatitis risk in type 2 diabetes

Belinda Schludi et al. JCI Insight. .

Abstract

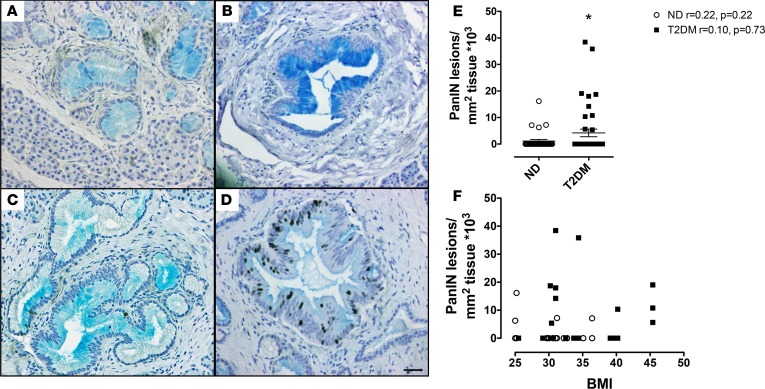
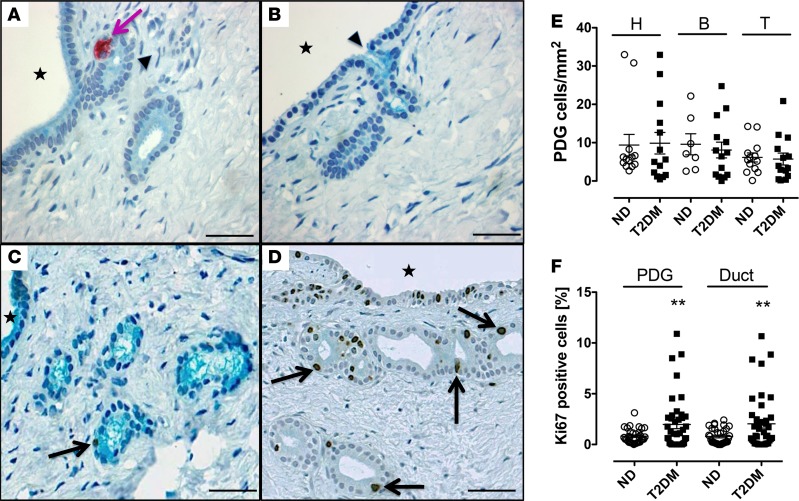
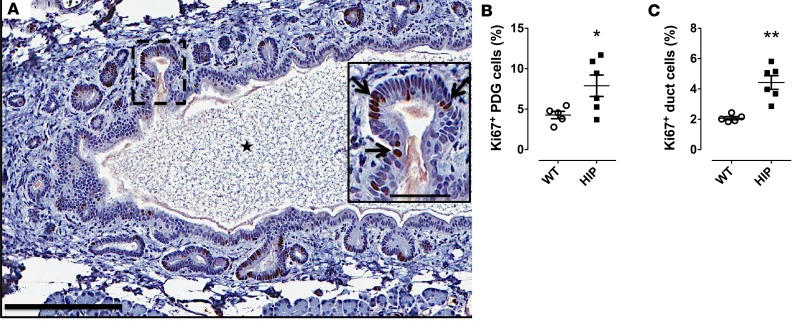
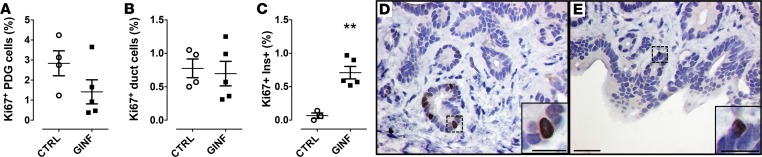
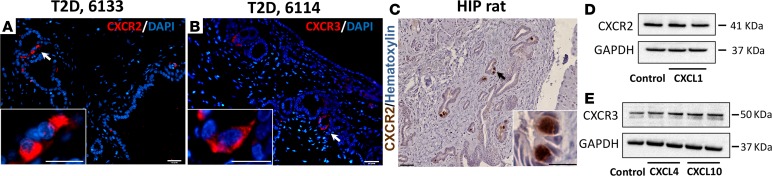
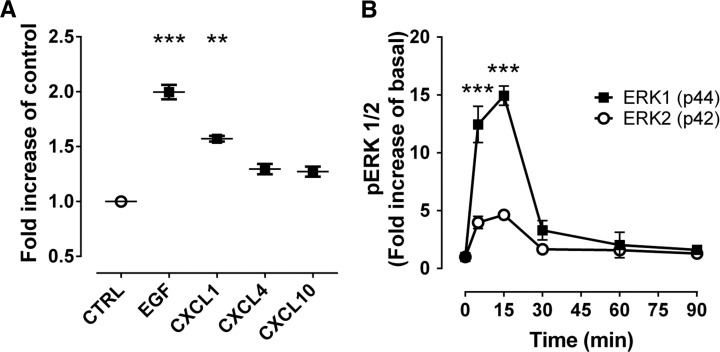
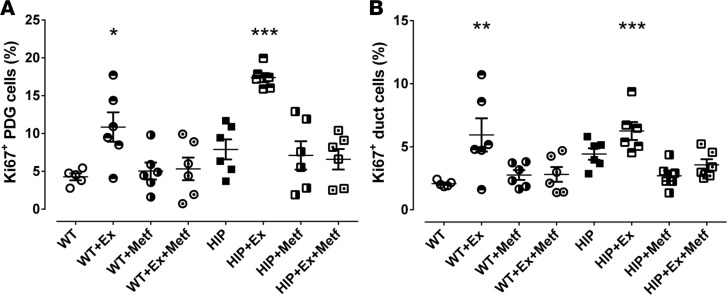
Pancreatitis is more frequent in type 2 diabetes mellitus (T2DM), although the underlying cause is unknown. We tested the hypothesis that ongoing β cell stress and apoptosis in T2DM induces ductal tree proliferation, particularly the pancreatic duct gland (PDG) compartment, and thus potentially obstructs exocrine outflow, a well-established cause of pancreatitis. PDG replication was increased 2-fold in human pancreas from individuals with T2DM, and was associated with increased pancreatic intraepithelial neoplasia (PanIN), lesions associated with pancreatic inflammation and with the potential to obstruct pancreatic outflow. Increased PDG replication in the prediabetic human-IAPP-transgenic (HIP) rat model of T2DM was concordant with increased β cell stress but preceded metabolic derangement. Moreover, the most abundantly expressed chemokines released by the islets in response to β cell stress in T2DM, CXCL1, -4, and -10, induced proliferation in human pancreatic ductal epithelium. Also, the diabetes medications reported as potential modifiers for the risk of pancreatitis in T2DM modulated PDG proliferation accordingly. We conclude that chronic stimulation and proliferation of the PDG compartment in response to islet inflammation in T2DM is a potentially novel mechanism that serves as a link to the increased risk for pancreatitis in T2DM and may potentially be modified by currently available diabetes therapy.

Keywords: Endocrinology.


Conflict of interest statement

Conflict of interest: The authors have declared that no conflict of interest exists.

Figures

Figure 1
Figure 1. Pancreatic intraepithelial neoplasia (PanIN) lesions are more frequent in type 2 diabetes mellitus (T2DM).
(AD) Examples of PanIN lesions identified in individuals with T2DM (A: donor 6108, low-grade PanIN; B: donor 6114, low-grade PanIN; C: donor 6142, low-grade PanIN, D: donor 6139, low-grade PanIN; all images acquired with a ×20 lens [×200 magnification]) stained with Alcian blue to detect mucin deposition, and for insulin (pink) and Ki67 (brown) to mark replicating cells. Scale bars: 50 μm. (E) Low-grade PanIN lesions were more frequent in T2DM (14 donors; n = 42 pancreas sections [14 head, 14 body, and 14 tail]) compared with nondiabetic (ND) controls (13 donors, n = 33 pancreas sections [13 head, 7 body and 13 tail]): 4.2 ± 1.4 vs. 1.1 ± 0.6 PanIN lesions/mm2 pancreas × 103, T2DM vs. ND; *P < 0.05. Open circles = ND donors, black squares = T2DM donors. (F) There was no relationship between PanIN lesions and BMI in either the ND controls (linear regression r = 0.22, P = 0.22; n = 33) or the subjects with T2DM (linear regression r = 0.05, P = 0.77; n = 42). Open circles = ND donors, black squares = T2DM donors. Data represent mean ± SEM; 1-tailed Student’s t test.
Figure 2
Figure 2. Pancreatic duct glands (PDGs) are present throughout the human pancreas with increased PDG cell replication in type 2 diabetes mellitus (T2DM).
(A and B) Examples of PDGs (arrows) in cross section in mesenchyme surrounding pancreatic ducts (A and B: donor 6015). PDGs and interlobular duct epithelium (but not intralobular pancreatic ducts) stain positively for mucin (Alcian blue) and are continuous and open into the interlobular duct epithelium (arrowheads); Stars indicate interlobular duct lumen; pink arrow indicates insulin-positive cell in PDG epithelium. Scale bars: 50 μm. (C and D) Representative examples of the PDG compartment in a nondiabetic (ND) subject (C: donor 6165) and a subject with T2DM (D: donor 6133) stained for Ki67 (brown) and with Alcian blue. Scale bars: 50 μm. Stars indicate interlobular duct lumen; black arrows indicate Ki67-positive nuclei in the PDG epithelium. Scale bars: 50 μm. (E) PDGs in human pancreas are present in the head, body, and tail with a comparable abundance in individuals with T2DM and ND controls (head: 9.9 ± 2.8 vs. 9.4 ± 2.8 PDGs/mm2 pancreas, T2DM [n = 14] vs. ND [n = 13], P = ns; body: 8.1 ± 2.1 vs. 9.6 ± 2.8 PDGs/mm2 pancreas, T2DM [n = 14] vs. ND [n = 7], P = ns; tail: 5.7 ± 1.6 vs. 6.1 ± 1.2 PDGs/mm2 pancreas, T2DM [n = 14] vs. ND [n = 13], P = ns). Open circles = ND donors, black squares= T2DM donors. (F) The frequency of PDG cell replication and interlobular pancreatic duct replication is increased in T2DM compared with ND controls (PDG: 2.0% ± 0.4% vs. 0.8% ± 0.1%, T2DM [n = 42] vs. ND [n = 33], **P < 0.01; interlobular duct: 2.0% ± 0.4% vs. 0.8% ± 0.1%, T2DM [n = 42] vs. ND [n = 33]). **P < 0.01. Open circles = ND donors, black squares = T2DM donors. Data represent mean ± SEM; 1-tailed Student’s t test.
Figure 3
Figure 3. Pancreatic duct gland (PDG) cell replication is increased in the human-IAPP-transgenic (HIP) rat model of type 2 diabetes mellitus (T2DM).
(A) Sections of pancreas from a HIP rat showing PDGs in the mesenchyme surrounding the pancreatic duct into which they open. Section is stained for Ki67 with a hematoxylin counterstain. Inset shows a higher-power view of a PDG with frequent Ki67-positive nuclei (black arrows). The star indicates the interlobular duct lumen. Scale bars: 200 μm and 50 μm (inset). (B and C) Consistent with T2DM, cell replication evaluated by Ki67 is increased in both the PDG and interlobular duct cell epithelium in the HIP rat (n = 6) compared with WT (n = 5) controls, coincident with increased β cell apoptosis but before onset of diabetes in many animals. Data represent mean ± SEM. *P < 0.05, **P < 0.01 by 2-tailed Student’s t test.
Figure 4
Figure 4. Pancreatic duct gland (PDG) cell replication is not increased following chronic glucose infusion in WT rats.
Following 72-hour chronic glucose infusion (GINF), neither PDG (A) nor interlobular duct cell replication (B) was increased, further excluding hyperglycemia/hyperinsulinemia as the driving signals. However, β cell replication was increased 7-fold (C) during the GINF serving as a positive control for the proproliferative actions of hyperglycemia. Representative examples of replication in the PDG compartment in control (D) and GINF-treated (E) rats. Sections are stained for Ki67 with a hematoxylin counterstain. Insets show higher-power views of PDGs, each with a Ki67-positive nucleus. Scale bars: 50 μm, 25 μm (inset in D), and 20 μm (inset in E). Control (CTRL) rats n = 4, GINF-treated rats n = 5. Data represent mean ± SEM. **P < 0.01 by 2-tailed Student’s t test.
Figure 5
Figure 5. The chemokine receptors are expressed in pancreatic duct glands (PDGs) and pancreatic ductal cells.
(A and B) are representative images of immunofluorescent staining for CXCR2 and CXCR3 in PDG compartment of pancreas from 2 subjects with type 2 diabetes mellitus (T2DM), nPOD donor 6133 and donor 6114, respectively. (C) A representative image of immunohistochemical staining for CXCR2 in PDGs in diabetic human-IAPP-transgenic (HIP) rat pancreas (3 independent staining experiments were performed, total n = 7 rats). Western blots confirming the presence of both CXCR2 (D) and CXCR3 (E) receptors in human pancreatic ductal epithelial (HPDE) cells (2 independent experiments were performed). Insets in AC indicate the high-power images of the areas indicated by white arrows (A and B) and black arrow (C) in the low-power images. Scale bars: 100 μm, 50 μm (insets in A and B), and 25 μm (inset in C).
Figure 6
Figure 6. Chemokines increase human pancreatic duct cell replication.
(A) To evaluate the potential link between β cell apoptosis and increased duct cell replication in type 2 diabetes mellitus, human pancreatic duct cell epithelia (HPDE) cells were exposed to the 3 primary chemokines, CXCL1, -4, and -10 (found to be overexpressed in excess in the islet of the human-IAPP-transgenic (HIP) rat, Supplemental Figure 4) for 96 hours, and cell growth was measured using a cell viability assay (MTT, see Methods). Epidermal growth factor (EGF) was used as a positive control. Data represent mean ± SEM from 3 independent experiments. **P < 0.01, ***P < 0.001 versus control (CTRL) by 1-way ANOVA with Dunnett’s post-hoc test. (B) CXCL1 increased phosphorylation of ERK1/2 in a time-dependent manner; 0 time point is a baseline (cells were not treated with chemokine). Data represent mean ± SEM from 3 independent experiments. ***P < 0.001 versus 0 time point for both ERK1 and ERK2 by 1-way ANOVA with Dunnett’s post-hoc test.
Figure 7
Figure 7. The actions of exendin-4 and metformin on pancreatic duct glands (PDGs) and interlobular duct replication in human-IAPP-transgenic (HIP) rats and WT controls.
(A and B) Twelve weeks of treatment with the glucagon-like peptide-1 mimetic exendin-4 (Ex) induced an increase in PDG (A) and interlobular duct (B) cell replication in control WT rats and caused a further increase in replication in HIP rats. Metformin (Metf) treatment over the same 12 weeks suppressed the Ex-induced proliferation in WT and HIP rats in both PDGs and interlobular ducts. WT n = 5, WT+Ex n = 6, WT+Metf n = 6, WT+Ex+Metf n = 6, HIP n = 6, HIP+Ex n = 6, HIP+Metf n = 6, HIP+Ex+Metf n = 6. Data represent mean ± SEM. *P < 0.05, **P < 0.01, ***P < 0.001 versus WT saline control by 1-way ANOVA with Dunnett’s post-hoc test.

References

    1. Wideroff L, et al. Cancer incidence in a population-based cohort of patients hospitalized with diabetes mellitus in Denmark. J Natl Cancer Inst. 1997;89(18):1360–1365. doi: 10.1093/jnci/89.18.1360. - DOI - PubMed
    1. Huxley R, Ansary-Moghaddam A, Berrington de González A, Barzi F, Woodward M. Type-II diabetes and pancreatic cancer: a meta-analysis of 36 studies. Br J Cancer. 2005;92(11):2076–2083. doi: 10.1038/sj.bjc.6602619. - DOI - PMC - PubMed
    1. Cui Y, Andersen DK. Diabetes and pancreatic cancer. Endocr Relat Cancer. 2012;19(5):F9–F26. doi: 10.1530/ERC-12-0105. - DOI - PubMed
    1. Li D, Tang H, Hassan MM, Holly EA, Bracci PM, Silverman DT. Diabetes and risk of pancreatic cancer: a pooled analysis of three large case-control studies. Cancer Causes Control. 2011;22(2):189–197. doi: 10.1007/s10552-010-9686-3. - DOI - PMC - PubMed
    1. Moreau JA, Zinsmeister AR, Melton LJ, DiMagno EP. Gallstone pancreatitis and the effect of cholecystectomy: a population-based cohort study. Mayo Clin Proc. 1988;63(5):466–473. doi: 10.1016/S0025-6196(12)65644-4. - DOI - PubMed