. 2017 Jul 5;7(1):4728.
doi: 10.1038/s41598-017-04654-0.

Synergistic cellular effects including mitochondrial destabilization, autophagy and apoptosis following low-level exposure to a mixture of lipophilic persistent organic pollutants

Affiliations

Synergistic cellular effects including mitochondrial destabilization, autophagy and apoptosis following low-level exposure to a mixture of lipophilic persistent organic pollutants

Nathan E Rainey et al. Sci Rep. .

Abstract

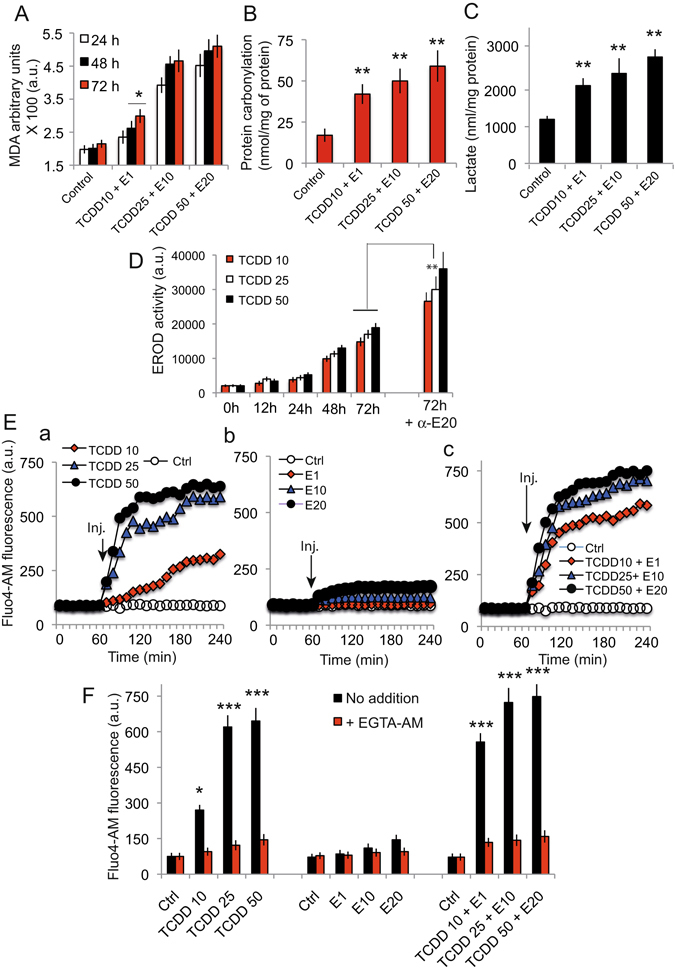
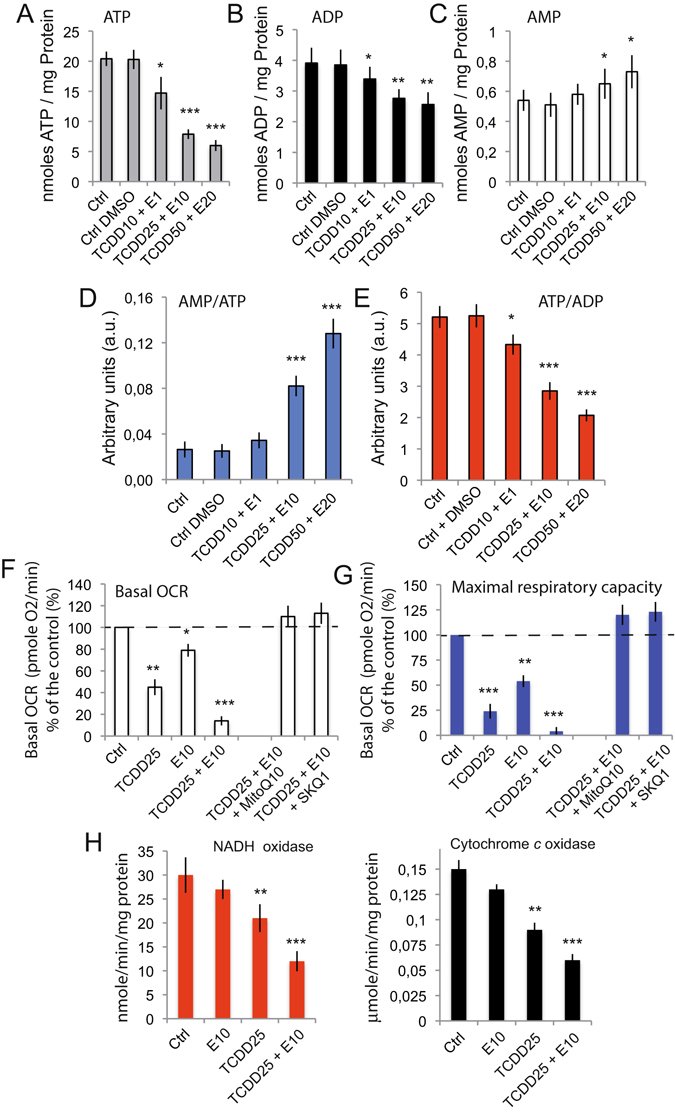
Humans are exposed to multiple exogenous environmental pollutants. Many of these compounds are parts of mixtures that can exacerbate harmful effects of the individual mixture components. 2,3,7,8-tetrachlorodibenzo-p-dioxin (TCDD), is primarily produced via industrial processes including incineration and the manufacture of herbicides. Both endosulfan and TCDD are persistent organic pollutants which elicit cytotoxic effects by inducing reactive oxygen species generation. Sublethal concentrations of mixtures of TCDD and endosulfan increase oxidative stress, as well as mitochondrial homeostasis disruption, which is preceded by a calcium rise and, in fine, induce cell death. TCDD+Endosulfan elicit a complex signaling sequence involving reticulum endoplasmic destalilization which leads to Ca2+ rise, superoxide anion production, ATP drop and late NADP(H) depletion associated with a mitochondrial induced apoptosis concomitant early autophagic processes. The ROS scavenger, N-acetyl-cysteine, blocks both the mixture-induced autophagy and death. Calcium chelators act similarly and mitochondrially targeted anti-oxidants also abrogate these effects. Inhibition of the autophagic fluxes with 3-methyladenine, increases mixture-induced cell death. These findings show that subchronic doses of pollutants may act synergistically. They also reveal that the onset of autophagy might serve as a protective mechanism against ROS-triggered cytotoxic effects of a cocktail of pollutants in Caco-2 cells and increase their tumorigenicity.


Conflict of interest statement

The authors declare that they have no competing interests.

Figures

Figure 1
Figure 1
TCDD plus endosulfan induces cell death. (A) YO-PRO-1/PI staining of Caco-2 cells treated with TCDD or α-E alone or with TCDD + endosulfan mixtures for 48 h incubation. Two controls have been used: control cells (in DMEM) and control cells treated with DMSO and nonane since TCDD and E are dissolved respectively in nonane or DMSO. Each experiment has been performed each time we set flow cytometry analysis of any other parameters (ΔΨm, ROS, annexine V/PI measurements or caspases, cathepsin or calpain determination). So the number of experiments realized is high (n ≥ 55). (B) YO-PRO-1/PI staining of Caco-2 cells treated with increased amounts of TCDD + endosulfan mixtures for 24 h incubation. (C) Phosphatidyl serine exposure to the outer leaflet of the plasma membrane measured with annexine V-FITC with Propidium iodide (n = 12).
Figure 2
Figure 2
Diverses cellular activities linked to the pollutant cocktail treatment. (A) Malondialdehyde production as a function of time (24 h, 48 h and 72 h) and TCDD + E concentration (n = 5). (B) Protein carbonylation in cells treated with the indicated concentrations of pollutant cocktails, after 48 h incubation (n = 6). (C) Lactate production induced by the treatment of Caco-2 cells after 48 h treatment with different pollutant cocktails. The data are expressed as nmol/mg protein (n = 7). (D) EROD activity linked to TCDD treatment at different concentration and an example of the synergistic action of TCDD + α-E at 48 h incubation (n = 5). (E) Calcium rise induced by the individual pollutants (i.e, TCDD or endosulfan) or the pollutant mixtures at different concentrations in presence or absence of EGTA-AM during the 4 hours following exposure (n = 7). (F) Histograms of the calcium content of the cells after treatments (similar to E) but at 48 h in presence or absence of EGTA-AM (n = 7).
Figure 3
Figure 3
TCDD + endosulfan induced ultrastructural ER alterations in Caco-2 cells. (A) Caco-2 cells were treated with or without different substances separately or in cocktails (i.e., control; endosulfan 20 µM; TCDD 50 nM and TCDD 50 nM + Endosulfan 20 µM) for 24 h and then examined by transmission electron microscopy. Representative images from five independent experiments are shown. ER, endoplasmic reticulum; M, mitochondria; N, nucleus; NmL nuclear membrane lumen; SF, stress fibers. Arrows indicate normal or dilated ER. *P < 0.05 compared with the control group. Representative images from five independent experiments are shown. (B) Histogram presentation of the quantification of the width of the ER lumen (in µm) in Caco-2 cells treated with either TCDD 10, 25 or 50 nM; endosulfan 1, 10 or 20 μM or a mixture of TCDD + Endosulfan (respectively 10 nM + 1 μM; 25 nM + 10 μM or 50 nM + 20 μM). Data are shown as mean ± SD (n = 11). (C and D) Flow cytometric determination of the CHOP and GRP78 activities linked to ER stress induced by TCDD, α-E and TCDD + α-E treatements. (C) After 6 h treatment and (D) after 12 h treatment for the mixture only.
Figure 4
Figure 4
Mitochondria behavior of TCDD + α-E treated cells. (A) Electron microscopy pictures of Caco-2 cells treated 48 h with different TCDD + α-E cocktails. Two pictures for each treatment are presented as representative of the subcellular organelles affected by each treatment (top and bottom). M; Mitochondria, Ly; lysosomes, APh; autophagosomes, F-Ly; Fused lysosomes. The bar in the first top left panel represents 0.5 μM. (B) Biparametric flow cytometric analyses of the mitochondrial membrane potential [ΔΨm, DiOC6(3)] and permeability of the plasma membrane to propidium iodide (PI). The arrow indicates a cell subpopulation (SP) with low ΔΨm and intermediate staining for PI. (C) Evolution of the mitochondrial membrane potential (ΔΨm) as measured by DiOC6(3) staining of cells treated 24 h or 48 h with different TCDD + α-E cocktail (n- 18). (D) Evolution of the mitochondrial membrane potential [ΔΨm, DiOC6(3)] and of the NAD(P)H cellular content as a function of time for an incubation with a TCDD25 + α-E 10 cocktail, TCDD25 and a-E alone (n = 20, variations are low and not visibles due to the size of the points used for drawing).
Figure 5
Figure 5
Analysis of diverses bioenergetic parameters concerning cells or mitochondrial isolated from cells which have been treated by diverses TCDD + α-E cocktails. (AE) HPLC determination of the ATP, ADP and AMP levels in cells treated with different concentrations of TCDD + E (dosage expressed as nmoles/mg protein). AMP/ATP and ATP/ADP ratios are respectively presented in D and E (arbitrary units). From A to E, the statistics are based on 6 differents experiments (n = 6). (F and G) Seahorse analysis of the cellular respiration for Caco-2 cells treated with TCDD or α-E, or TCDD + α-E cocktails. (F) basal oxidative respiratory chain (ORC) and in (G) Maximal respiratory capacity after 10 μM mClCCCP addition (n = 4). On these two panels F and G, the mitochondrially targeted antioxidants MitoQ10 100 μM and SKQ1 5 nM have been used to minimize the superoxide anion production. TCDD alone at 25 nM, α-E at 10 nM and the cocktail TCDD 25 nM + α-E 10 nM. MitoQ10 is used at 500 mM and SKQ1 at 25 μM. (H and I) NADH oxidation (H) and Cytochrome c oxidase activity (I) of isolated mitochondia treated with α-E 10, TCDD 25 or a mixture of TCDD + α-E (25 + 10) (n = 8).
Figure 6
Figure 6
Light scattering properties and ROS production of Caco-2 cells treated with different concentrations of the pollutant mixture TCDD + E. (A) Changes in light scattering (i.e forward low angle light squatter, FSC and side squatter, SSC) of Caco-2 cells treated 48 h with different mixtures of TCDD + E. Percentages (%) indicate the amount of cells selected on FSC/SCC that are not debris (red dots at the bottom left part of the histograms) or aggregates. (B) Biparametric analyses of cells selected in the gate G1 on the light scatter (A), for the MitoSOX fluorescence (superoxide anion production) versus propidium iodide (PI) staining (taken as plasma membrane permeability and/or cellular viability). F bar (mean fluorescence value) indicates the mean fluorescence of the population in blue (viable cells) whereas the other values (4) are the percentage of cells in each quadrant. Red dots represent PI positive non-viable cells. (C) Biparametric analyses of the cells selected in the gate G1 on the light scatter (A), for the 2HDCF-DA staining and the DCF fluorescence (H2O2 production, in blue) versus propidium iodide (PI, in red) staining (taken as plasma membrane permeability and/or cellular viability). F bar indicates the mean fluorescence of the population in blue that increases upon treatments. The percentage of cells that are non-viables (PI positives) is indicated in % (red dots). (DF) The histograms represent statistical analyses of the above A, B and C measurements respectively concerning in (D) the light scattering properties (*P < 0,5), in (E) the superoxide anion generation with MitoSOX staining and in (F) the hydroperoxide measurements with DCFH-DA staining. Means of 7 independent experiments are presented (n = 7). In (E) and (F) respectively, MitoSOX and DCFH-DA measurements have also been realized in presence of three different antoxidants, i.e., N-acetylcystein (NAC) as a cytoplasmic anti-oxidant and two mitochondrially targeted antixoxidants which are MitoQ10 and SKQ1. (all data are means of 6 independent experiments, n = 6).
Figure 7
Figure 7
Morphology of the lysosomes and details of the cytoplasm in cells treated with a cocktail of polluants. (AD) Caco-2 cells were treated for 24 h with 20 µM endosulfan, 50 nM TCDD or 50 nM TCDD combined with 20 μM endosulfan and observed under transmission electron microscopy. Typical lysosomes are shown in control (A) When cells are treated with α-E (20 μM) alone, the lysosomes appeared swollen (B) whereas with TCDD alone (50 nm) the lysomes become electron dense and seem to fuse to each other (C). When the sample has been treated with a cocktail of pollutant, i.e., TCDD 50 nM and α-E (20 μM), autophagosomes are visible (D,E) Relative aboundance of each subcellular compartment estimated from electron microscopy picture and counted. The mitochondria, lysosomes, lipid droplets and vacuoles are counted on one side and the autophagosomes upper left pannel are counted apart. Statistical analysis calculated from 10 separated experiments and from 5 differents microscopic field (pooled) for each (n = 10). (F) Electron microscopy picture of Caco-2 cells treated with 50 nM TCDD alone or a cocktail of TCDD 50 nM + 20 μM Endosulfan. SF: stress fibers and NmL, nuclear membrane lumen.
Figure 8
Figure 8
Measurements of Caco-2 cellular proliferation changes upon treatment with different mixtures of TCDD + E (xCELLigence) and of the induction of autophay associated processes. (A) xCELLigence measurements of Caco-2 cell proliferation in presence or absence of different mixtures of TCDD + E. Treatments were realized at the early time of the proliferation curve and the slope of the impedance curve is measured as an index of cellular proliferation. An additional histogram resume measurements on a statistical basis (n = 6). (B) xCELLigence measurements of Caco-2 cell proliferation realized by exposure to a mixture of pollutants at the late stage of the proliferation curve (80% of the maximum). Cells were untreated (curve a) or treated with DMSO plus nonane (curve b), TCDD 10 + E 1 (curve c), TCDD 25 + E 10 (curve d) or TCDD 50 + E 20 (curve e). Flow cytometric analysis indicates the time at which cells were extracted from XCELLigence device for analysis with indications for different treatments. (C) Analysis of the intracellular acidic compartment by acridine orange staining for the cells issued from the xCELLigence device (a to e). Note that the red fluorescence indicates the importance of the acidic compartment within the cell. A decrease in green fluorescence is linked to an increased number of dead cells. Red fluorescence decreases also since the dismantling of the cell abolishes the difference in pH between the cytoplasm and the altered acidic vesicles (whatever they are lysosomes or autophagic vesicles). (D) Western blots of LC3-I and LC3-II of control and treated cells (actin serve as a reference). Cells left untreated or exposed to the pollutants were analysed in presence of absence of Rapamycin 100 nM (Rapamycin is also an inducer of autophagy, as inhibition of mTOR mimics cellular starvation by blocking signals required for cell growth and proliferation) or of 3-MA and of 1 μM Bafilomycin A1 (an inhibitor of the fusion of autopagosomes to lysosomes). (E) LC3-II fluorescence (in red) and cell death (taken as the cell population with a ΔΨm drop) in black squares (n = 5 for each mesurement).
Figure 9
Figure 9
Cathepsin, calpain and caspase-8 activation by α-E, TCDD or pollutant cocktails. (A) Flow cytometry analysis of Caco-2 cells calpain activity following the incubation of cells with a pollutant cocktail (TCDD 50 nM + α-E 20 μM) for 24 h in the presence of calcium chelators, BAPTA-AM or EGTA-AM, mitochondrially targeted antioxidants (MitoQ10 or SKQ1), a pan caspase inhibitor BOK-D-fmk or 3 methyladenine an inhibitor of autophagy (n = 8). (B) Cathepsin activity in Caco-2 cells treated with a cocktail of pollutants for 48 h. A cathepsin inhibitor cocktail has been tested as well for the effects of z-LEHD, an inhibitor of caspase-9 (n = 6). (C) Caspase-8 activity in Caco-2 cells treated with TCDD 50 nM + α-E 20 μM has been tested at 24 h and 48 h (n = 9).
Figure 10
Figure 10
Schematic representation of the various events involved in the TCDD + endosulfan signalization. TCDD and endosulfan which are very lipophilic substances penetrate the cells and interact with all the membrane compartments. They provoke an ER stress and lysosomal membrane destabilization. Calcium release from the ER enter the mitochondria and alter the electron transport chain, resulting in a ΔΨm drop and superoxide generation. Altered mitochondria are taken up by mitophagy. The lysosomal pathway also converges towards mitochondria since calpain and cathepsin are susceptible of Caspase-8 activation and Bid cleavage. Huge autophagic processes are induced in parallel to cell death events until Beclin-1 is cleaved and death dominates. An inhibition of autophagy (by Bafilomycin A1) leads to a more pronounced cell death.

References

    1. Sweeney MH, Fingerhut MA, Arezzo JC, Hornung RW, Connally LB. Peripheral neuropathy after occupational exposure to 2,3,7,8-tetrachlorodibenzo-p-dioxin (TCDD) Am J Ind Med. 1993;23:845–858. doi: 10.1002/ajim.4700230603. - DOI - PubMed
    1. Parzefall, W. Risk assessment of dioxin contamination in human food. Food Chem Toxicol40, 1185–1189, doi:S0278691502000595 (2002). - PubMed
    1. Nawaz A, et al. Cellular impact of combinations of endosulfan, atrazine, and chlorpyrifos on human primary hepatocytes and HepaRG cells after short and chronic exposures. Cell Biol Toxicol. 2014;30:17–29. doi: 10.1007/s10565-013-9266-x. - DOI - PubMed
    1. Weber, J. et al. Endosulfan, a global pesticide: a review of its fate in the environment and occurrence in the Arctic. Sci Total Environ408, 2966–2984, doi:S0048-9697(09)01088-2 [pii] 10.1016/j.scitotenv.2009.10.077 (2010). - PubMed
    1. Barouki, R., Coumoul, X. & Fernandez-Salguero, P. M. The aryl hydrocarbon receptor, more than a xenobiotic-interacting protein. FEBS Lett581, 3608–3615, doi: S0014-5793(07)00317-1 (2007). - PubMed

LinkOut - more resources