. 2017 Jun 21;4(6):170463.
doi: 10.1098/rsos.170463. eCollection 2017 Jun.

Role of growth rate on the orientational alignment of Escherichia coli in a slit

Affiliations

Role of growth rate on the orientational alignment of Escherichia coli in a slit

Julian Sheats et al. R Soc Open Sci. .

Abstract

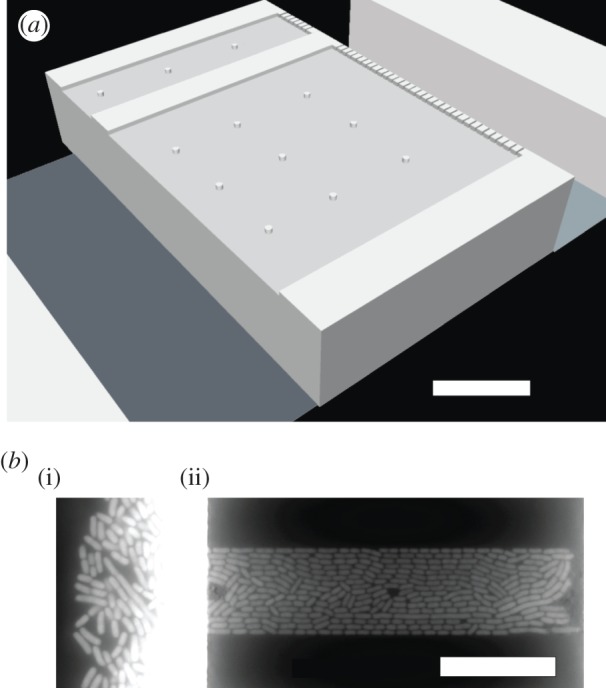
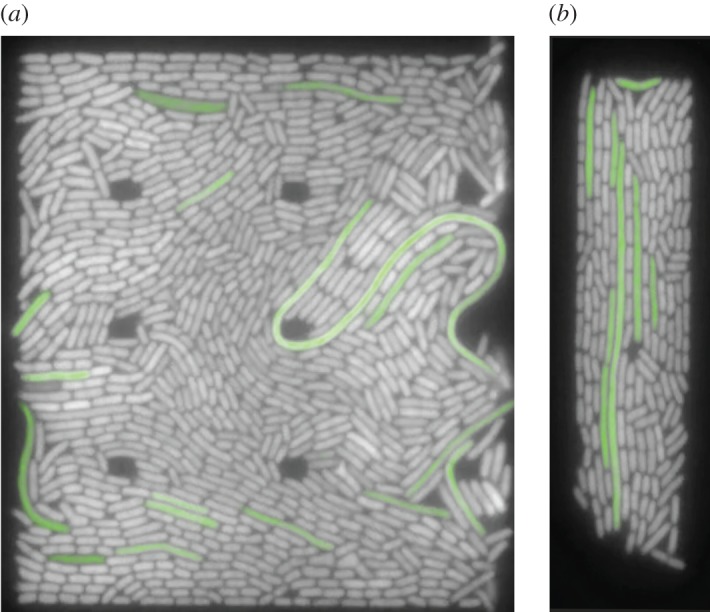
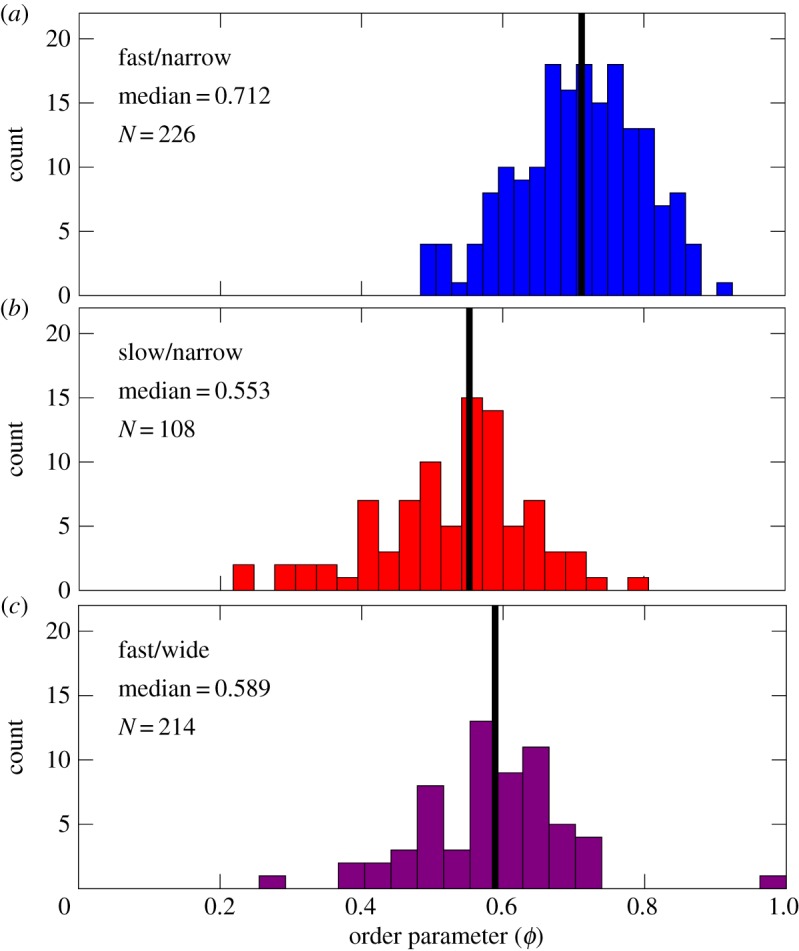
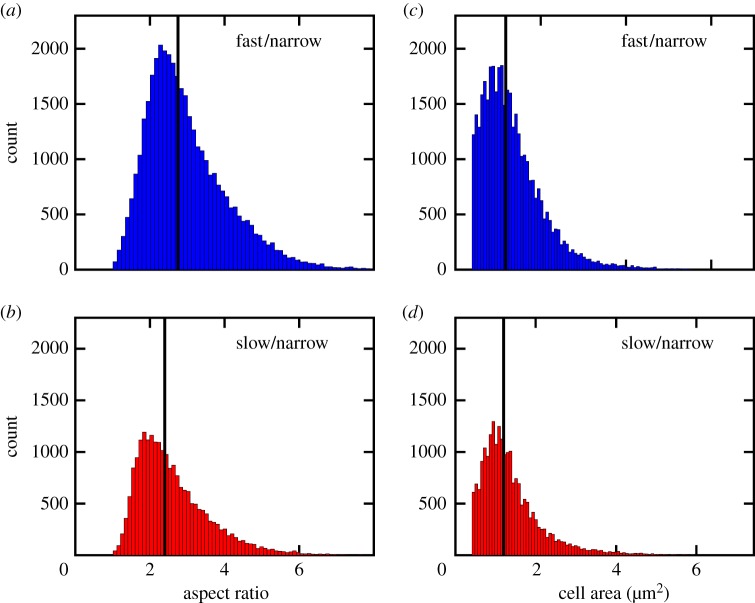
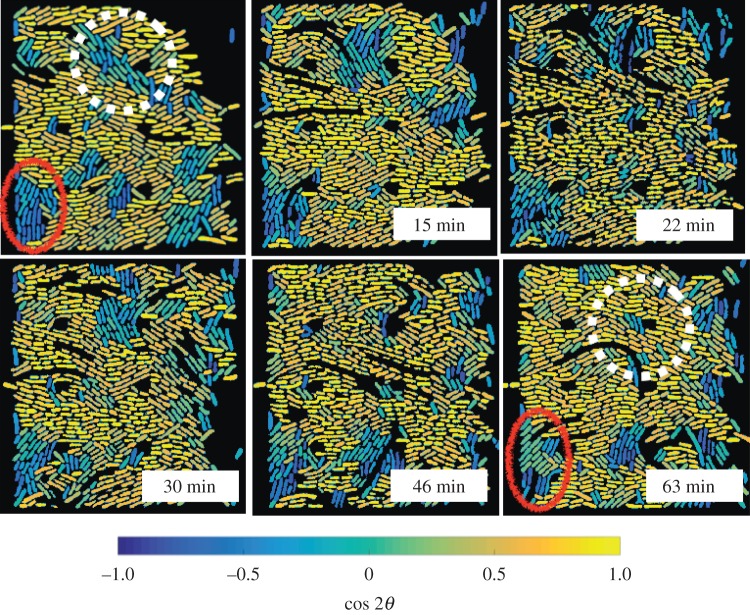
We present experimental data on the nematic alignment of Escherichia coli bacteria confined in a slit, with an emphasis on the effect of growth rate and corresponding changes in cell aspect ratio. Global alignment with the channel walls arises from the combination of local nematic ordering of nearby cells, induced by cell division and the elongated shape of the cells, and the preferential orientation of cells proximate to the side walls of the slit. Decreasing the growth rate leads to a decrease in alignment with the walls, which is attributed primarily to effects of changing cell aspect ratio rather than changes in the variance in cell area. Decreasing confinement also reduces the degree of alignment by a similar amount as a decrease in the growth rate, but the distribution of the degree of alignment differs. The onset of alignment with the channel walls is coincident with the slits reaching their steady-state occupancy and connected to the re-orientation of locally aligned regions with respect to the walls during density fluctuations.

Keywords: bacteria colony; microchemostat; microfluidics; nematic alignment.


Conflict of interest statement

We declare we have no competing interests.

Figures

Figure 1.
Figure 1.
Slit microchemostat and alignment of E. coli therein with respect to the channel walls. (a) Schematic of two different width slits in the array. The bacteria grow inside the slits, while the adjacent flow channels provide growth media and remove waste and extra cells. The filter at the right side of the slit aids in loading the cells by differential pressure between the two flow channels. Small pillars are included to support the ceiling of the device. The figure is approximately to scale. (b) Typical fluorescent image showing one media channel (i) and cells in a narrow slit (ii) grown under fast growth rate (LB). The bright region corresponds to overgrowth in the media channels; a similar overgrowth occurs in the media channel on the right (not shown). White scale bars are 20 μm in both panels.
Figure 2.
Figure 2.
Example images of filaments affecting ordering of cells. Filamentous cells have been false-coloured green. (a) Fast/wide and (b) fast/narrow.
Figure 3.
Figure 3.
Steady-state alignment of bacteria with the slit walls decreases when either decreasing the growth rate or increasing the slit width. The histograms show the distributions of the order parameter ϕ after the slit has been filled and frames containing filamentous cells have been removed. The data for slow/narrow and fast/wide correspond to measurements made over multiple slits and multiple time points within the same experiment; the fast/narrow data correspond to measurements obtained over many slits in two separate experiments. The panels correspond to (a) fast growth rate, LB, in narrow slits (15 μm wide), (b) slow growth rate, M9+0.2%CAA, in narrow slits and (c) fast growth rate in wide slits (60 μm wide). Black vertical lines indicate the median of the distribution.
Figure 4.
Figure 4.
Reducing the growth rate reduces the cell aspect ratio and narrows the distribution in cell area. The figures show distributions of aspect ratio (a,b) and cell size (c,d) in narrow slits (15 μm wide) for fast growth (LB, (a,c)) and slow growth (M9+0.2%CAA, (b,d)). The black lines indicate the medians in the distributions: aspect ratio—fast/narrow: 2.8; slow/narrow: 2.4. Cell area—fast/narrow: 1.3 μm2; slow/narrow: 1.2 μm2.
Figure 5.
Figure 5.
The evolution of domains of low nematic ordering are heterogeneous. The images are snapshots where the segmented cells have been coloured according to the value of cos2θ with respect to the channel walls. The times correspond to the elapsed time since the upper-left frame. The data correspond to fast growth (LB) with a mean doubling time of 18 min in a wide slit (60 μm). Two regions of low ordering with respect to the walls (but strong local nematic ordering) are indicated by the solid red oval and dashed white line. The corresponding movie data are provided as electronic supplementary material.

References

    1. Onsager L. 1949. The effect of shape on the interaction of colloidal particles. Ann. NY Acad. Sci. 51, 627–659. (doi:10.1111/j.1749-6632.1949.tb27296.x) - DOI
    1. Flory PJ. 1956. Phase equilibria in solutions of rod-like particles. Proc. R. Soc. A 234, 73–89. (doi:10.1098/rspa.1956.0016) - DOI
    1. de Gennes PG, Prost J. 1993. The physics of liquid crystals. Oxford, UK: Clarendon Press.
    1. Chen JZY. 2016. Theory of wormlike polymer chains in confinement. Prog. Poly. Sci. 54–55, 3–46. (doi:10.1016/j.progpolymsci.2015.09.002) - DOI
    1. Garlea IC, Mulder P, Alvarado J, Dammone O, Aarts DGAL, Lettinga MP, Koenderink GH, Mulder BM. 2016. Finite particle size drives defect-mediated domain structures in strongly confined colloidal liquid crystals. Nat. Commun. 7, 12112 (doi:10.1038/ncomms12112) - DOI - PMC - PubMed

LinkOut - more resources