. 2017 Apr 28;6(6):e1320626.
doi: 10.1080/2162402X.2017.1320626. eCollection 2017.

Amplification of N-Myc is associated with a T-cell-poor microenvironment in metastatic neuroblastoma restraining interferon pathway activity and chemokine expression

Affiliations

Amplification of N-Myc is associated with a T-cell-poor microenvironment in metastatic neuroblastoma restraining interferon pathway activity and chemokine expression

Julian P Layer et al. Oncoimmunology. .

Abstract

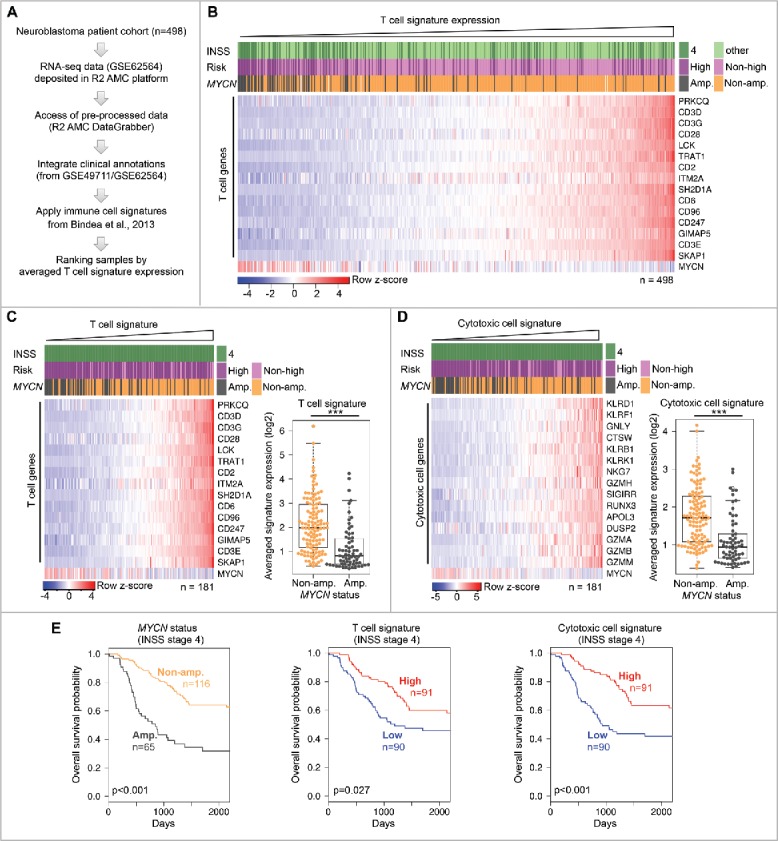
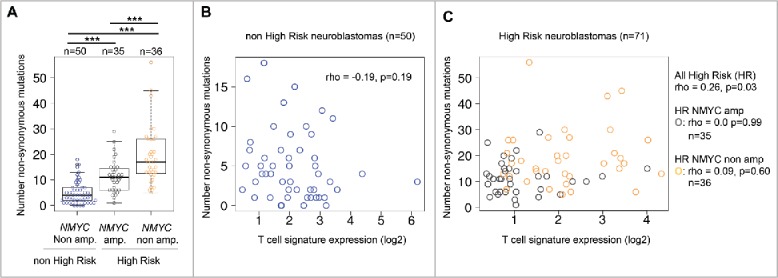
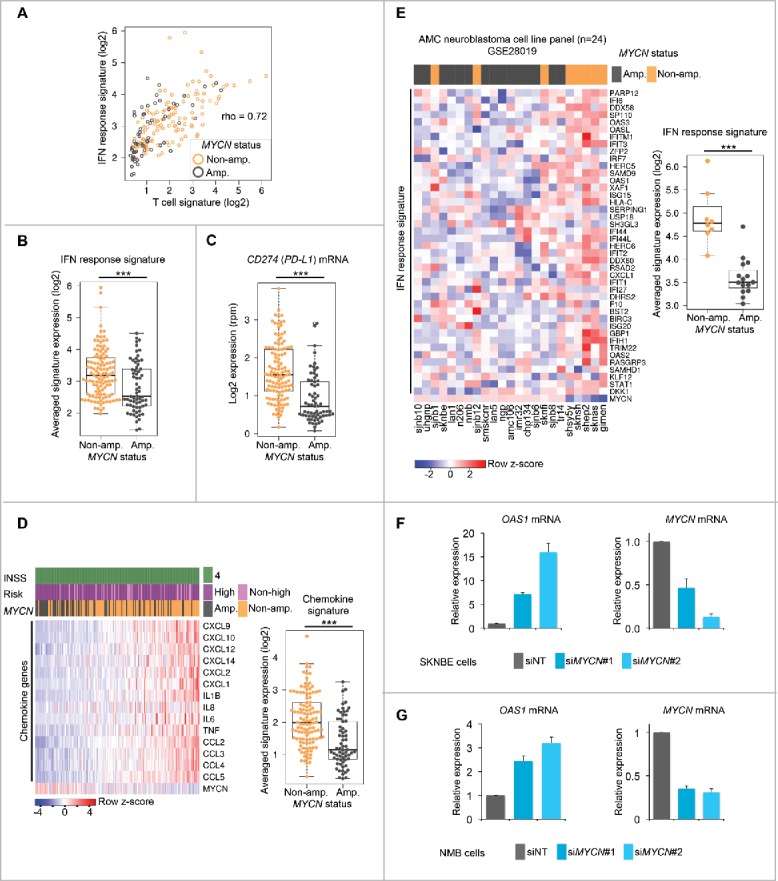
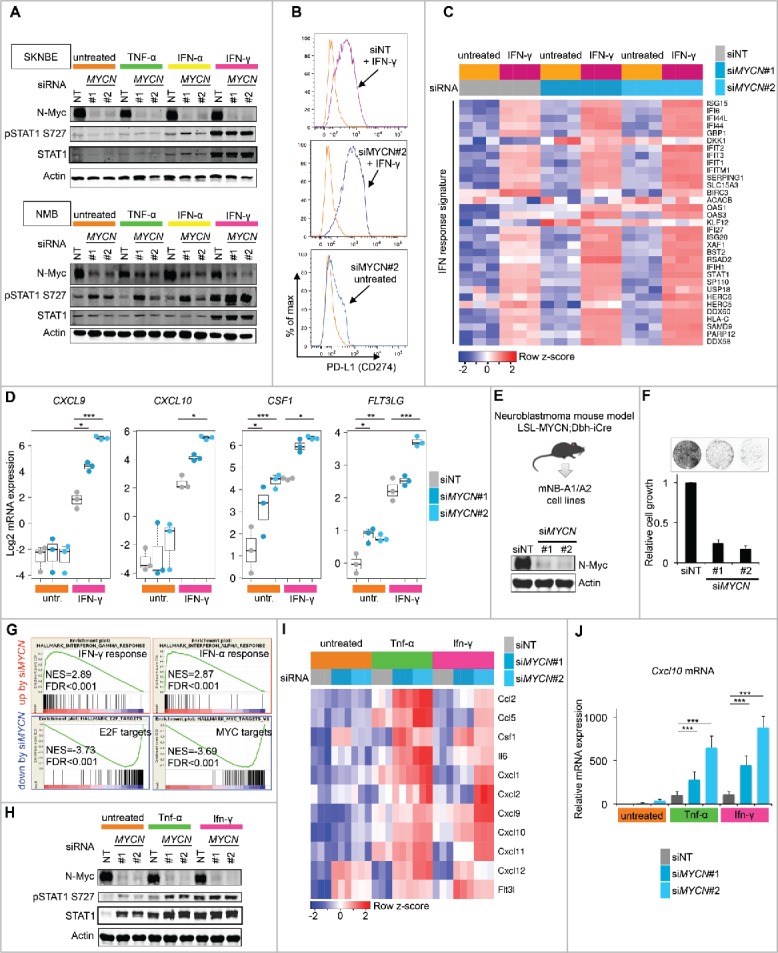
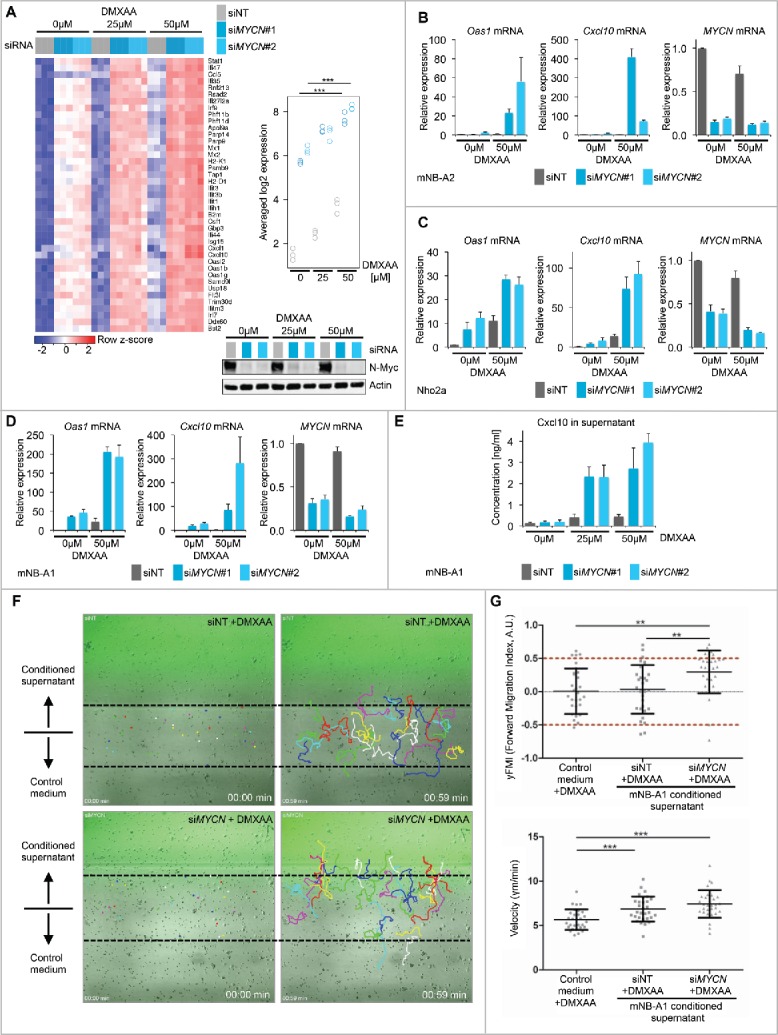
Immune checkpoint inhibitors have significantly improved the treatment of several cancers. T-cell infiltration and the number of neoantigens caused by tumor-specific mutations are correlated to favorable responses in cancers with a high mutation load. Accordingly, checkpoint immunotherapy is thought to be less effective in tumors with low mutation frequencies such as neuroblastoma, a neuroendocrine tumor of early childhood with poor outcome of the high-risk disease group. However, spontaneous regressions and paraneoplastic syndromes seen in neuroblastoma patients suggest substantial immunogenicity. Using an integrative transcriptomic approach, we investigated the molecular characteristics of T-cell infiltration in primary neuroblastomas as an indicator of pre-existing immune responses and potential responsiveness to checkpoint inhibition. Here, we report that a T-cell-poor microenvironment in primary metastatic neuroblastomas is associated with genomic amplification of the MYCN (N-Myc) proto-oncogene. These tumors exhibited lower interferon pathway activity and chemokine expression in line with reduced immune cell infiltration. Importantly, we identified a global role for N-Myc in the suppression of interferon and pro-inflammatory pathways in human and murine neuroblastoma cell lines. N-Myc depletion potently enhanced targeted interferon pathway activation by a small molecule agonist of the cGAS-STING innate immune pathway. This promoted chemokine expression including Cxcl10 and T-cell recruitment in microfluidics migration assays. Hence, our data suggest N-Myc inhibition plus targeted IFN activation as adjuvant strategy to enforce cytotoxic T-cell recruitment in MYCN-amplified neuroblastomas.

Keywords: Chemokine; Cxcl10; N-Myc; STING; immunotherapy; infiltration; interferoninfiltration; neuroblastoma.


Figures

Figure 1.
Figure 1.
Genomic MYCN amplification is associated with a T-cell-poor microenvironment in metastatic neuroblastoma. (A) Outline of analysis. (B) Expression of T-cell signature genes in entire neuroblastoma cohort. Samples ranked by increasing T-cell signature expression. Log2 gene expression values were z-score transformed for heatmap visualization. Clinical and genomic annotations are indicated. (C) Left panel: The same analysis as in (B), but restricted to INSS stage 4 neuroblastomas. Right panel: T-cell signature expression in MYCN-amplified and non-MYCN-amplified metastatic neuroblastomas. ***p < 0.001; two-sided Wilcoxon rank test. MYCN-amp., n = 65; non-MYCN-amp., n = 116. (D) The same analysis as in (C), but using the cytotoxic immune cell signature. (E) Kaplan–Meier survival plots of INSS stage 4 neuroblastomas stratified by MYCN amplification status (left panel), T-cell signature expression (middle panel) and cytotoxic immune cell signature (right panel). High/low groups were defined by an unbiased median expression value cut-off. p-values determined by two-sided log-rank test.
Figure 2.
Figure 2.
Comparison of T-cell signature expression and mutation load in primary human neuroblastomas. (A) Number of total non-synonymous mutations identified in indicated subgroups of low-risk and high-risk neuroblastomas. ***p < 0.001; pairwise two-sided Wilcoxon rank test with correction for multiple testing (false-discover rate). (B) Correlation analysis of T-cell signature expression level (log2) and mutation load (number of mutations) in non-high-risk neuroblastomas and (C) high-risk neuroblastomas (NMYC-status color-coded). rho: Spearman rank correlation value. p-value determined by two-sided Spearman's rank correlation test with continuity correction.
Figure 3.
Figure 3.
MYCN amplification status is associated with a lower IFN pathway activity in primary metastatic neuroblastomas and cultured neuroblastoma cell lines. (A) Scatter correlation plot of IFN response versus T-cell signature expression in INSS stage 4 neuroblastomas. MYCN amplification status of individual samples is color-coded as indicated. rho; Spearman rank correlation value. (B) IFN response signature expression in MYCN-amplified versus non-MYCN-amplified metastatic neuroblastomas. ***p < 0.001; two-sided Wilcoxon rank test. MYCN-amp., n = 65; non-MYCN-amp., n = 116. (C) The same analysis as in (B), but log2-transformed reads per million (rpm) of CD274 (PD-L1) mRNA expression. (D) Left panel: Expression of selected cytokine and chemokine genes in INSS stage 4 neuroblastoma tissues. Samples ranked by increasing signature expression. Log2 gene expression values were z-score transformed for heatmap visualization. Clinical and genomic annotations as indicated. Right panel: Chemokine signature expression in MYCN-amplified versus non-MYCN-amplified metastatic neuroblastomas. ***p < 0.001; two-sided Wilcoxon rank test. MYCN-amp., n = 65; non-MYCN-amp., n = 116. (E) Left panel: Heatmap clustering of IFN response signature gene expression in human neuroblastoma cell lines. MYCN amplification status is indicated. Right panel: IFN response signature expression in MYCN-amplified versus non-MYCN-amplified human neuroblastoma cell lines. ***p < 0.001; two-sided Wilcoxon rank test. MYCN-amp., n = 16; non-MYCN-amp., n = 8. (F, G) qRT-PCR analysis of relative OAS1 and MYCN mRNA expression (normalized to UBC mRNA expression) in the MYCN-amplified human neuroblastoma cell lines SKNBE (F) and NMB (G) treated with siNT (non-targeting siRNA pool) or two independent siRNAs against MYCN. Error bars indicate standard deviations (s.d.) from three biologic replicates.
Figure 4.
Figure 4.
N-Myc restrains INF-γ responses in human and murine neuroblastoma cell lines. (A) Western blot analysis for N-Myc, pSTAT1, total STAT1 and actin protein expression in SKNBE and NMB cells. Transfected siRNAs and interferon/TNF-α stimulation as indicated. (B) FACS analysis of PD-L1 surface expression in SKNBE cells treated as indicated. (C) Expression of IFN response signature genes in SKNBE cells determined by RNA-seq analysis. Transfected siRNAs and INF-γ stimulation as indicated. Log2 expression values were z-score transformed for heatmap visualization. (D) Experiment as described in (C) showing expression of selected chemokine/cytokine genes. *p < 0.05, **p < 0.01, ***p < 0.001, ANOVA with Tukey's HSD test for multiple comparisons. (E) Upper panel: Origin of mNB-A1/A2 cell lines. Lower panel: Immunoblot validation of N-Myc depletion in mNB-A1 cells by MYCN siRNAs targeting the human MYCN transgene. (F) Proliferation of mNB-A1 cells treated with non-targeting siRNA pool (siNT) or siRNAs against MYCN. Upper panel: Representative image of crystal violet stained dish. Lower panel: Quantification based on three biologic replicates. Error bars indicate s.d. (G) GSEA showing top hallmark gene sets upregulated or downregulated in mNB-A1 cells by knockdown of MYCN based on RNA-seq gene expression profiling. NES; normalized enrichment score. FDR: False discovery rate q-value. (H) Western blot analysis for N-Myc, pStat1, total Stat1 and actin protein expression in mNB-A1 cells. Transfected siRNAs and Ifnγ/Tnf-α stimulation as indicated. (I) Expression of selected chemokine/cytokine genes in mNB-A1 cells treated as indicated. Visualization of z-score transformed log2 expression values from RNA-seq analysis. (J) qRT-PCR analysis of relative Cxcl10 mRNA expression (normalized to Ubc expression) in mNB-A1 cells treated as described in H/I. Error bars indicate s.d. of biologic triplicates. ***p <0.001, two-sided Wilcoxon rank test.
Figure 5.
Figure 5.
Depletion of N-Myc promotes targeted IFN pathway activation by the STING agonist DMXAA and T-cell recruitment in microfluidics migration assays. (A) Left panel: Expression of IFN-inducible genes in mNB-A1 cells treated with siNT or siMYCN#1/#2 upon exposure to DMXAA or DMSO vehicle control. Log2 expression values were z-score transformed for heatmap visualization. Right upper panel: Quantification of averaged signature expression values shown in the heatmap. ***p < 0.001, ANOVA with Tukey's HSD test for multiple comparisons. Right lower panel: Immunoblot validation of N-Myc depletion in the respective conditions. (B–D) qRT-PCR analysis of relative Oas1, Cxcl10 and MYCN mRNA expression (normalized to Ubc expression) in mNB-A2 (B), Nho2a (C) and mNB-A1 (D) murine neuroblastoma cells treated as described in (A). Error bars indicate s.d. of biologic triplicates. (E) Cxcl10 protein concentration measured by ELISA in supernatant from cultured mNB-A1 cells treated as described in (D/E). Error bars indicate s.d. of biologic triplicates. (F) Representative images (one out of three biologic replicates) showing tracked migration of mouse OT-I T cells in microfluidics gradient chamber. Gradient was established using conditioned supernatant of mNB-A1 cells treated as indicated. (G) Quantitative analyses of T cell (n = 30) migration. Data shown for one representative biologic replicate. Average values (yFMI, velocity) of individual biologic replicates are shown in Fig. S4. *p < 0.05, **p < 0.01, ***p < 0.001, unpaired Student's t-test.

References

    1. Robert C, Long GV, Brady B, Dutriaux C, Maio M, Mortier L, Hassel JC, Rutkowski P, McNeil C, Kalinka-Warzocha E et al.. Nivolumab in previously untreated melanoma without BRAF mutation. N Engl J Med 2015; 372:320-30; PMID:25399552; https://doi.org/10.1056/NEJMoa141208210.1056/NEJMoa1412082 - DOI - PubMed
    1. Borghaei H, Paz-Ares L, Horn L, Spigel DR, Steins M, Ready NE, Chow LQ, Vokes EE, Felip E, Holgado E et al.. Nivolumab versus docetaxel in advanced nonsquamous non-small-cell lung cancer. N Engl J Med 2015; 373:1627-39; PMID:26412456; https://doi.org/10.1056/NEJMoa150764310.1056/NEJMoa1507643 - DOI - PMC - PubMed
    1. Motzer RJ, Escudier B, McDermott DF, George S, Hammers HJ, Srinivas S, Tykodi SS, Sosman JA, Procopio G, Plimack ER et al.. Nivolumab versus everolimus in advanced renal-cell carcinoma. N Engl J Med 2015; 373:1803-13; PMID:26406148; https://doi.org/10.1056/NEJMoa151066510.1056/NEJMoa1510665 - DOI - PMC - PubMed
    1. Garon EB, Rizvi NA, Hui R, Leighl N, Balmanoukian AS, Eder JP, Patnaik A, Aggarwal C, Gubens M, Horn L et al.. Pembrolizumab for the treatment of non-small-cell lung cancer. N Engl J Med 2015; 372:2018-28; PMID:25891174; https://doi.org/10.1056/NEJMoa150182410.1056/NEJMoa1501824 - DOI - PubMed
    1. Pauken KE, Wherry EJ. Overcoming T cell exhaustion in infection and cancer. Trends Immunol 2015; 36:265-76; PMID:25797516; https://doi.org/10.1016/j.it.2015.02.00810.1016/j.it.2015.02.008 - DOI - PMC - PubMed

Publication types

LinkOut - more resources