. 2017 Jun 21:7:259.
doi: 10.3389/fcimb.2017.00259. eCollection 2017.

Behavior of Neutrophil Granulocytes during Toxoplasma gondii Infection in the Central Nervous System

Affiliations

Behavior of Neutrophil Granulocytes during Toxoplasma gondii Infection in the Central Nervous System

Aindrila Biswas et al. Front Cell Infect Microbiol. .

Abstract

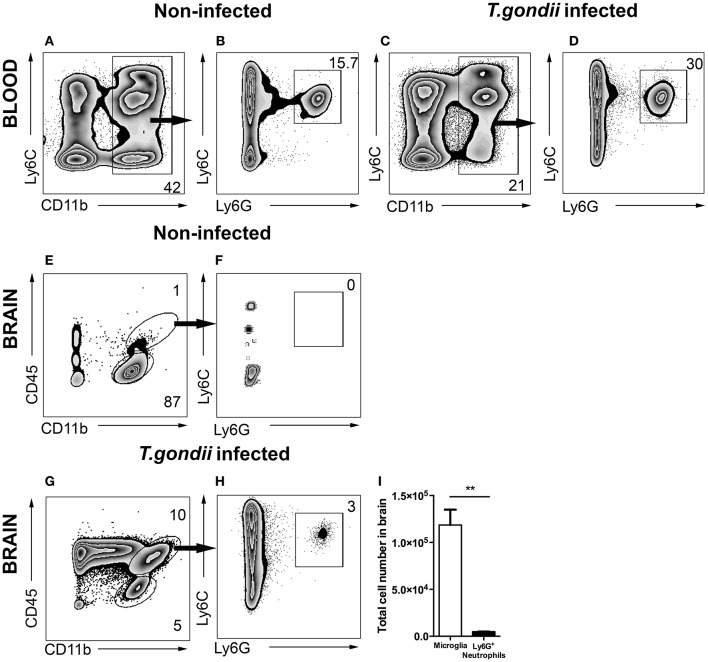
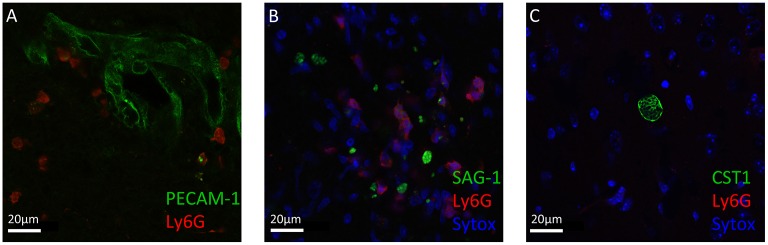
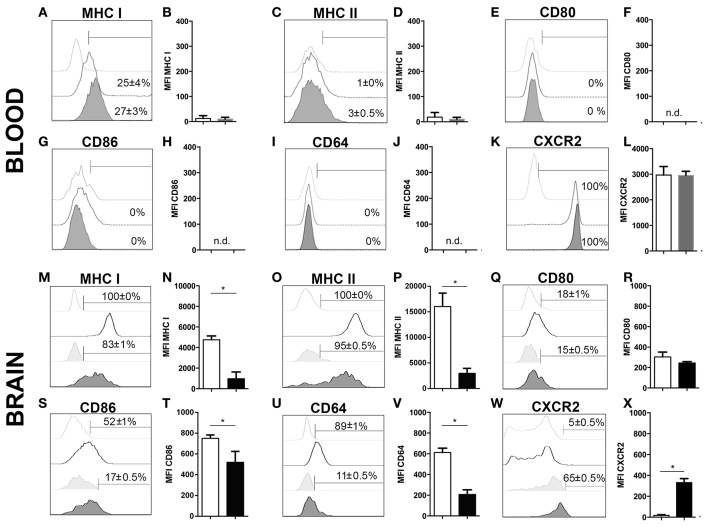
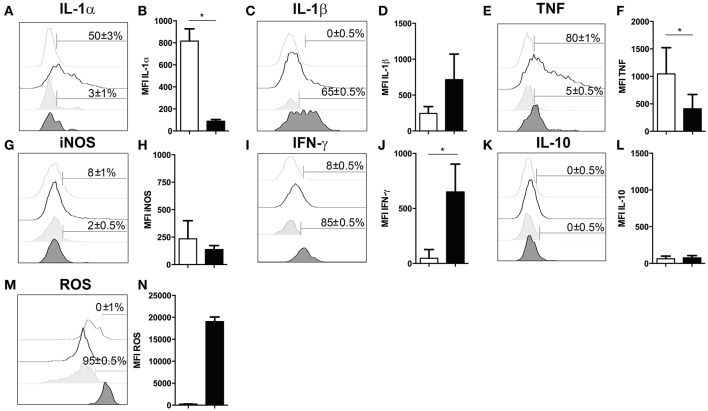
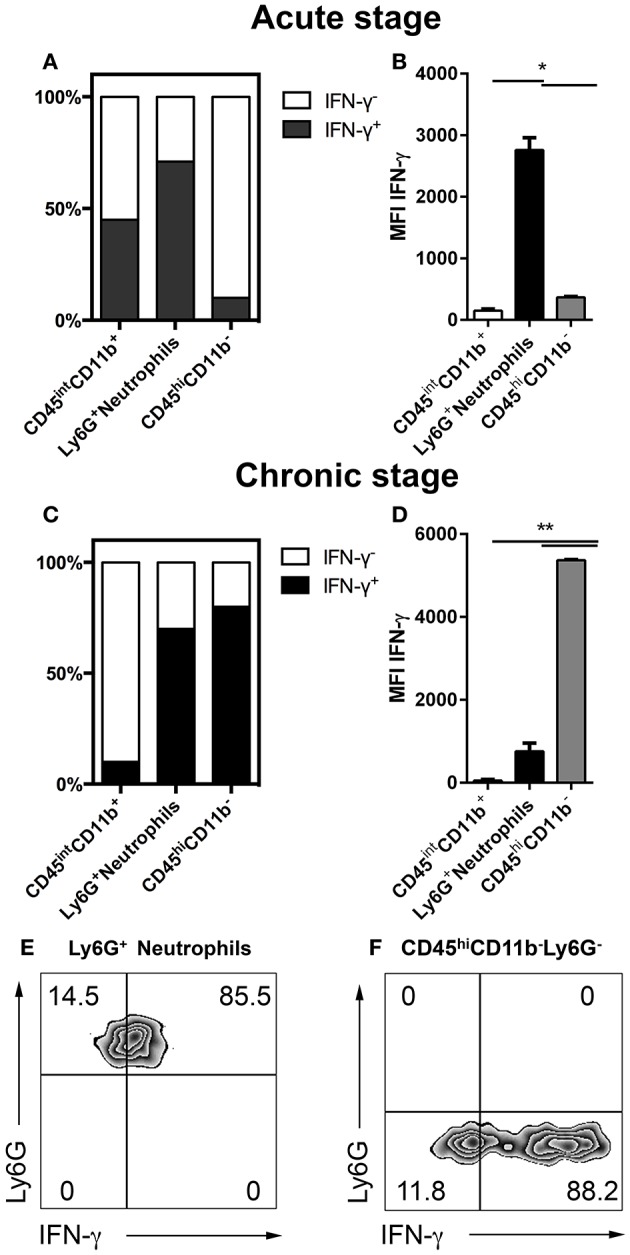
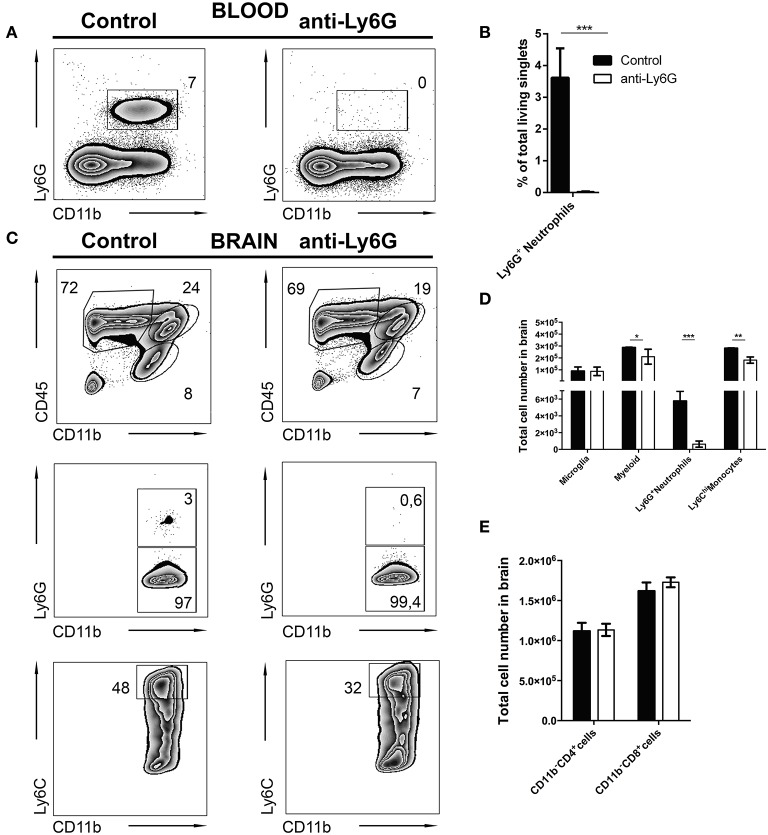
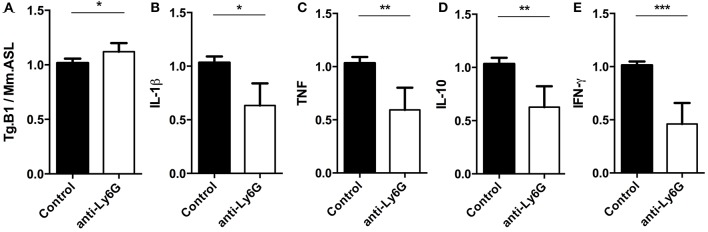
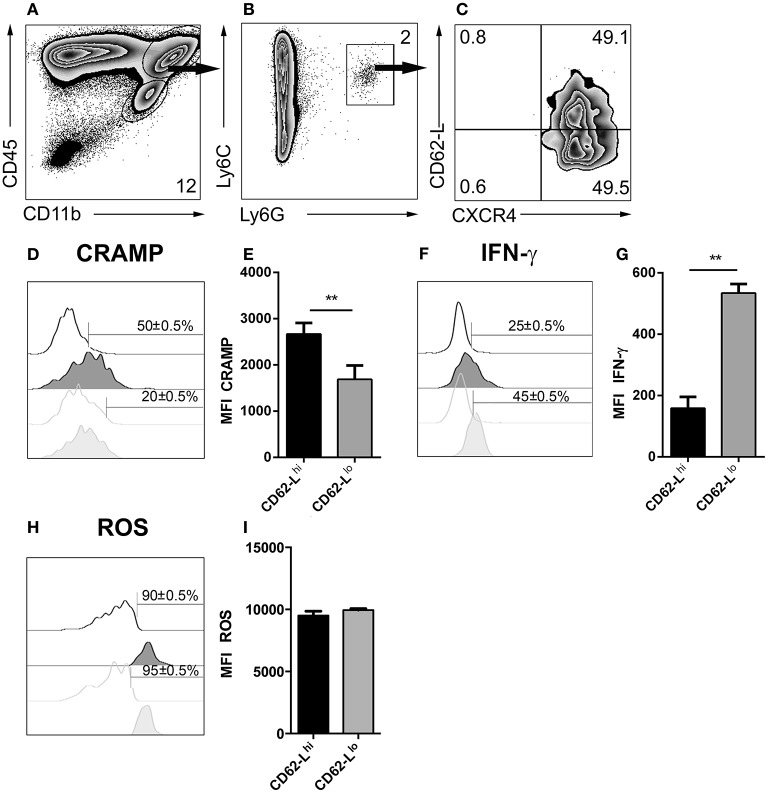
Cerebral toxoplasmosis is characterized by activation of brain resident cells and recruitment of specific immune cell subsets from the periphery to the central nervous system (CNS). Our studies revealed that the rapidly invaded Ly6G+ neutrophil granulocytes are an early non-lymphoid source of interferon-gamma (IFN-γ), the cytokine known to be the major mediator of host resistance to Toxoplasma gondii (T. gondii). Upon selective depletion of Ly6G+ neutrophils, we detected reduced IFN-γ production and increased parasite burden in the CNS. Ablation of Ly6G+ cells resulted in diminished recruitment of Ly6Chi monocytes into the CNS, indicating a pronounced interplay. Additionally, we identified infiltrated Ly6G+ neutrophils to be a heterogeneous population. The Ly6G+CD62-LhiCXCR4+ subset released cathelicidin-related antimicrobial peptide (CRAMP), which can promote monocyte dynamics. On the other hand, the Ly6G+CD62-LloCXCR4+ subset produced IFN-γ to establish early inflammatory response. Collectively, our findings revealed that the recruited Ly6G+CXCR4+ neutrophil granulocytes display a heterogeneity in the CNS with a repertoire of effector functions crucial in parasite control and immune regulation upon experimental cerebral toxoplasmosis.

Keywords: Toxoplasma gondii; cerebral toxoplasmosis; neuroinflammation; neutrophil Infiltration; neutrophil granulocytes.


Figures

Figure 1
Figure 1
Gating strategy of neutrophil granulocytes in blood and in brain. Cells were isolated from the blood and brain of non-infected mice (A,B,E,F) and the blood and brain of 4 weeks T. gondii-infected mice (C,D,G,H) and analyzed by flow cytometry. Following FSC-SSC, singlet gating and exclusion of dead cells (not shown), live cells were used for further analysis. (A,C) Show gating of CD11b+ cells in the blood which are further characterized into Ly6C+Ly6G+ neutrophil granulocytes (B,D). (E) Shows the resident microglia (CD11b+CD45lo, lower gate), and (F) shows the percentage of neutrophil granulocytes (Ly6C+Ly6G+) from myeloid populations in the brains of non-infected animals (CD11b+CD45hi, upper gate). (G,H) Shows the exact same gating strategy in the infected brains. (I) The bar graphs represent total number of cells (activated microglia - white bar and neutrophil granulocytes - black bar) in the infected brains. Numbers represent % of parent population. The data shown is representative for 3 independent experiments with 5 mice per group for each experiment. Mann-Whitney test was performed for comparisons (**p < 0.01).
Figure 2
Figure 2
Immunofluorescence staining of Ly6G+ neutrophil granulocytes and T. gondii in brain slices. Immunostaining of PECAM-1 or SAG1 or CST1 (green), Ly6G (red), and Sytox Dead Cell stain (blue) in the cortex of T. gondii-infected C57BL/6 mice (A–C). (A) In acute cerebral toxoplasmosis, recruitment of Ly6G+ neutrophil granulocytes into the brain from the circulation is shown. (B) Further, massive infiltration of Ly6G+ neutrophil granulocytes around T. gondii tachyzoites (green) is shown. (C) In chronic cerebral toxoplasmosis, no localization of Ly6G+ neutrophil granulocytes is shown. Eight coronal slides per mouse were analyzed with a maginification of 63x; n = 4 mice. This experiment was repeated two times. Scale bars, 20 μm in (A–C).
Figure 3
Figure 3
Phenotypic analysis of neutrophil granulocytes and activated microglia (A–X). Expression of activation markers and chemokine receptors in mice blood and brains after 4 weeks of T. gondii infection, were analyzed by flow cytometry, respectively. The cells were gated as described and shown in the representative plots of Figure 1. Neutrophils from the infected and non-infected blood (CD11b+CD45hiLy6G+Ly6C+), activated microglia (CD11b+CD45int), and neutrophil granulocytes from the infected brain (CD11b+CD45hiLy6G+Ly6C+), were assessed for their relative expression of the indicated molecules. (A,C,E,G,I,K,M,O,Q,S,U,W) Histograms show the representative expression level of the surface maker by the cell population in comparison to the corresponding isotype control (light gray without tint or light gray tinted). Bars mark cells positively expressing particular surface markers and numbers above bars represent the percentage of cells in the respective population: neutrophils in non-infected blood (CD11b+Ly6G+) (without any tint, dotted line), neutrophils in infected blood (CD11b+Ly6G+) (tinted, dotted line), activated microglia (CD11b+CD45int) (without any tint), neutrophil granulocytes (CD11b+Ly6G+) (tinted). (B,D,F,H,J,L,N,P,R,T,V,X) Bar graphs represent the median fluorescence intensity (MFI) for the specific marker MFI ± SD (n = 4) (neutrophils in non-infected blood: white bars; neutrophils in infected blood: gray bars; activated microglia: white bars; and neutrophils: black bars). Data represent 2 independent experiments with 5 mice per experiment. Mann-Whitney test was performed for comparisons (*p < 0.05).
Figure 4
Figure 4
Functional properties of neutrophil granulocytes and activated microglia in the infected brain. (A–N) Cells isolated from brains of mice infected with 4 weeks of T. gondii, were re-stimulated with Toxoplasma lysate antigen in vitro and analyzed by flow cytometry. The cells were gated as described in the Figure 1 (E–H). (A,C,E,G,I,K,M) Histograms show the representative expression levels of the indicated molecules in comparison to the corresponding isotype control (light gray without tint or light gray tinted). Bars mark cells positive for the particular cytokine. Numbers above bars represent the percentage of cells positive for the cytokine of the respective population: activated microglia (CD11b+CD45int) (without any tint), neutrophil granulocytes (CD11b+Ly6G+) (tinted). (B,D,F,H,J,L,N) Bar graphs represent the MFI of the respective fluorochrome for a particular cytokine, MFI ± SD (activated microglia: white bars; and neutrophils: black bars). Data are representative of 2 independent experiments with 5 mice per experiment. Mann-Whitney test was performed for comparisons (*p < 0.05). White bars and black bars represent activated microglia and neutrophil granulocytes respectively.
Figure 5
Figure 5
IFN-γ production over the course of cerebral toxoplasmosis (A–F). Cells isolated from brains of mice infected with 2 and 4 weeks of T. gondii, were re-stimulated with Toxoplasma lysate antigen in vitro and analyzed by flow cytometry. The cells were gated as shown in Figures 1E,F. (A,C) The fraction of the total cell population expressing IFN-γ was plotted in stacked bar graphs. (B,D) Bar graphs represent the MFI of the respective fluorochrome for a particular cytokine, MFI ± SD (n = 4). (E,F) The representative plots show the gating strategy of Ly6G+ neutrophils and CD11bCD45hiLy6G cells producing IFN-γ. The quadrant was set on isotype control. Data are representative of 2 independent experiments with 5 mice per experiment. Significant differences (*p < 0.05, **p < 0.01) were determined using the Mann-Whitney test. White bars, black bars and gray bars represent CD45intCD11b+ activated microglia, Ly6G+ neutrophils and CD45hiCD11b lymphocytes, respectively.
Figure 6
Figure 6
Selective depletion of Ly6G+ neutrophil granulocytes. C57BL/6 mice were infected with T. gondii. From day 10 to day 23 post-infection mice were alternatively treated with either IgG mAb (control, left), or anti-Ly6G (Anti-Ly6G, right) to deplete neutrophil granulocytes. The cells were gated as shown in Figures 1E–H. Panel (A) displays representative plots to define CD11b+Ly6G+ circulating neutrophil granulocytes (upper gate) in the blood. (B) The bar graph represents the percentage of Ly6G+ cells in the blood. (C) The upper plots show the gating of lymphocytes (CD11bCD45hi), activated microglia (CD11b+CD45int) and the myeloid population (CD11b+CD45hi) in infected brains. Middle plots display the myeloid subsets: Ly6G+(neutrophil granulocytes) and Ly6G (monocytes) in the brain. Lower plots display the inflammatory monocyte subset (from the Ly6G gate): Ly6Chi. (D) The bar graphs represent the total cell number of the respective subsets in the brain (black bars: control; white bars: anti-Ly6G). (E) The bar graphs represent the total cell number of the respective CD4+ and CD8+ lymphoid cell population. Data shown here is the representative of 2 individual experiments with 4 mice per group for each experiment. The numbers in the representative contour plots are % of the parent population. Significant differences (*p < 0.05, **p < 0.01, ***p < 0.001) were determined using the Mann-Whitney test.
Figure 7
Figure 7
Semi-quantitative RT-PCR analysis of Ly6G+ neutrophil granulocytes-depleted mice. Quantitative and Semi-quantitative RT-PCR analyses of pathogen load and cytokine gene expression in brains of T. gondii-infected C57BL/6 mice (for 23 days) after treatment with IgG mAb (black bars) or anti-Ly6G (white bars). (A–E) Relative expression was calculated by normalization to the expression of the housekeeping genes mouse argininosuccinate lyase and hypoxanthine phosphoribosyltransferase. Resulting data were further normalized on mean values of control groups. Data shown is the representative of 2 individual experiments with 4 mice per group for each experiment. Significant differences (*p < 0.05, **p < 0.01, ***p < 0.001) were determined using the Mann-Whitney test.
Figure 8
Figure 8
Emergence of neutrophil subsets in the CNS. (A,B) Cells isolated from 4 week T. gondii-infected mice were gated on CD45+CD11b+Ly6C+Ly6G+ neutrophils (C), and their CXCR4 and CD62-L expression was determined. The neutrophil granulocyte subsets CXCR4+CD62-Llo and CXCR4+CD62-Lhi were studied for their CRAMP, IFN-γ and ROS expression. (D,F,H) Representative histograms show CRAMP, IFN-γ, and ROS expression of CXCR4+CD62-Lhi (black filled) and CXCR4+CD62-Llo (gray filled) neutrophils as compared to the corresponding isotype control (black or gray, not filled). Bars mark the cells positive for the particular markers. Numbers above the bars represent percentage of cells positive for the marker of the respective population: CXCR4+CD62-Lhi (black) and CXCR4+CD62-Llo (gray). (E,G,I) Bar graphs represent the MFI of the respective fluorochrome for a particular marker, MFI ± SD (n = 4) (CXCR4+CD62-Lhi (black) and CXCR4+CD62-Llo (gray)). The numbers in the representative contour plots are % of the parent population. Data are representative of 2 independent experiments with n = 4 mice per experiment. Significant differences (**p < 0.01) in the bar graphs were determined using the Mann-Whitney test.

References

    1. Abdallah D. S. A., Egan C. E., Butcher B. A., Denkers E. Y. (2011). Mouse Neutrophils are professional antigen- presenting cells programmed to instruct Th1 and Th17 T-cell differentiation. Int. Immunol. 23, 317–326. 10.1093/intimm/dxr007 - DOI - PMC - PubMed
    1. Bardoel B. W., Kenny E. F., Sollberger G., Zychlinsky A. (2014). The balancing act of neutrophils. Cell Host Microbe 15, 526–536. 10.1016/j.chom.2014.04.011 - DOI - PubMed
    1. Barragan A. (2002). Transepithelial migration of Toxoplasma gondii is linked to parasite motility and virulence. J. Exp. Med. 195, 1625–1633. 10.1084/jem.20020258 - DOI - PMC - PubMed
    1. Beyrau M., Bodkin J. V., Nourshargh S. (2012). Neutrophil heterogeneity in health and disease: a revitalized avenue in inflammation and immunity. Open. Biol. 2:120134. 10.1098/rsob.120134 - DOI - PMC - PubMed
    1. Biswas A., Bruder D., Wolf S. A., Mack M., Heimesaat M. M., Dunay I. R. (2015). Ly6C (high) monocytes control cerebral Toxoplasmosis. J. Immunol. 194, 3223–3235. 10.4049/jimmunol.1402037 - DOI - PubMed

Publication types

MeSH terms