. 2017 Jun 28;2(3):e00169-17.
doi: 10.1128/mSphere.00169-17. eCollection 2017 May-Jun.

Bacterial Community Composition and Dynamics Spanning Five Years in Freshwater Bog Lakes

Affiliations

Bacterial Community Composition and Dynamics Spanning Five Years in Freshwater Bog Lakes

Alexandra M Linz et al. mSphere. .

Erratum in

Abstract

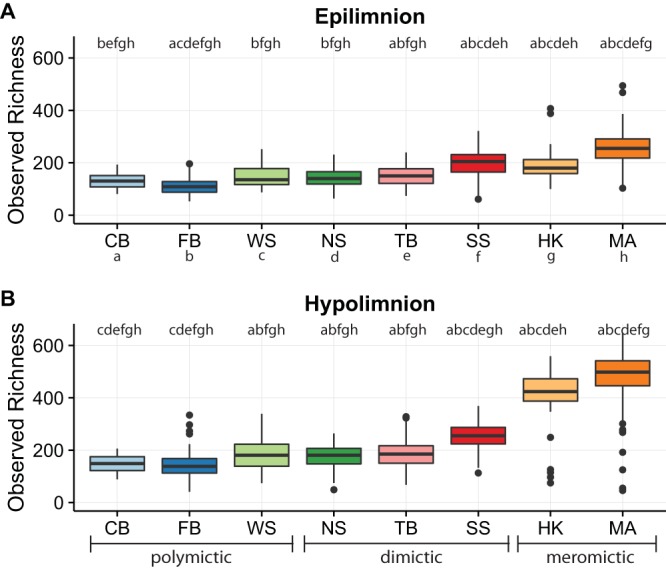
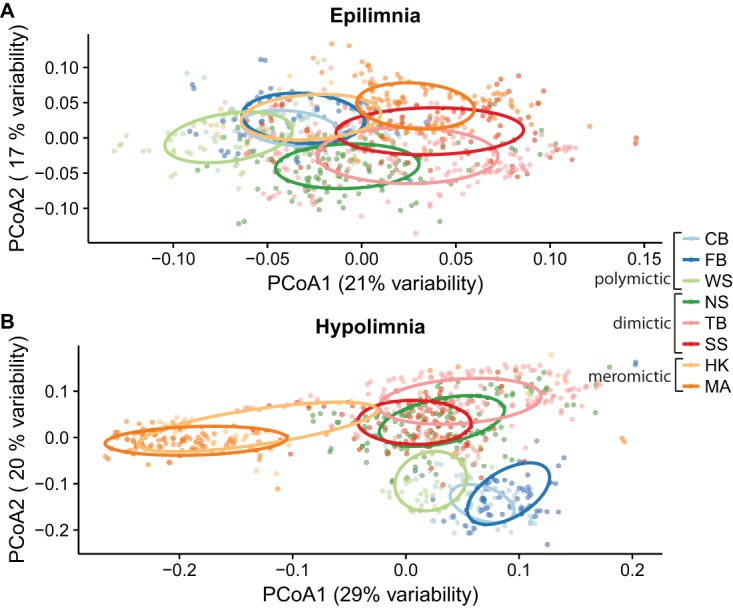
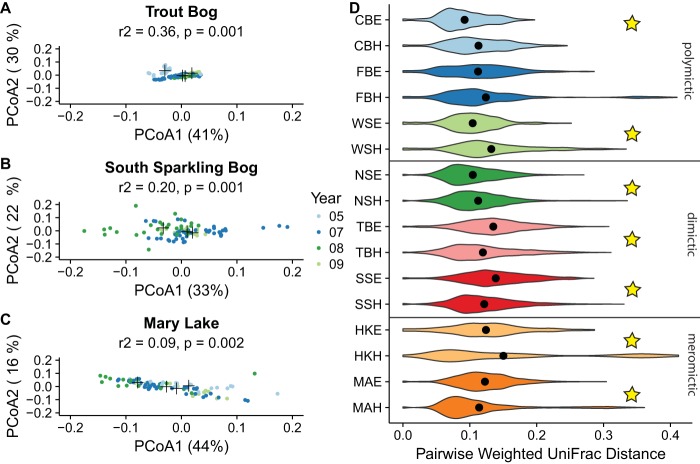
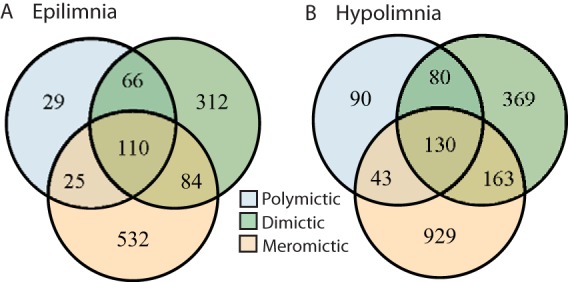
Bacteria play a key role in freshwater biogeochemical cycling, but long-term trends in freshwater bacterial community composition and dynamics are not yet well characterized. We used a multiyear time series of 16S rRNA gene amplicon sequencing data from eight bog lakes to census the freshwater bacterial community and observe annual and seasonal trends in abundance. The sites that we studied encompassed a range of water column mixing frequencies, which we hypothesized would be associated with trends in alpha and beta diversity. Each lake and layer contained a distinct bacterial community, with distinct levels of richness and indicator taxa that likely reflected the environmental conditions of each lake type sampled, including Actinobacteria in polymictic lakes (i.e., lakes with multiple mixing events per year), Methylophilales in dimictic lakes (lakes with two mixing events per year, usually in spring and fall), and "Candidatus Omnitrophica" in meromictic lakes (lakes with no recorded mixing events). The community present during each year at each site was also surprisingly unique. Despite unexpected interannual variability in community composition, we detected a core community of taxa found in all lakes and layers, including Actinobacteria tribe acI-B2 and Betaprotobacteria lineage PnecC. Although trends in abundance did not repeat annually, each freshwater lineage within the communities had a consistent lifestyle, defined by persistence, abundance, and variability. The results of our analysis emphasize the importance of long-term multisite observations, as analyzing only a single year of data or one lake would not have allowed us to describe the dynamics and composition of these freshwater bacterial communities to the extent presented here. IMPORTANCE Lakes are excellent systems for investigating bacterial community dynamics because they have clear boundaries and strong environmental gradients. The results of our research demonstrate that bacterial community composition varies by year, a finding which likely applies to other ecosystems and has implications for study design and interpretation. Understanding the drivers and controls of bacterial communities on long time scales would improve both our knowledge of fundamental properties of bacterial communities and our ability to predict community states. In this specific ecosystem, bog lakes play a disproportionately large role in global carbon cycling, and the information presented here may ultimately help refine carbon budgets for these lakes. Finally, all data and code in this study are publicly available. We hope that this will serve as a resource for anyone seeking to answer their own microbial ecology questions using a multiyear time series.

Keywords: 16S rRNA; freshwater; microbial communities; microbial ecology; time series.


Figures

FIG 1
FIG 1
Richness by layer and lake. Lakes listed on the x axis are arranged by depth (see Table 1 for lake abbreviations and depth measurements). Significance (represented by letters for each lake above their box plot; the letters identifying each lake are below the x axis in panel A) was tested using a Wilcoxon signed-rank test with a Bonferroni correction for multiple pairwise comparisons, reported in Table S1. (A) Epilimnion. (B) Hypolimnion.
FIG 2
FIG 2
Principal-coordinate analysis of samples by layer. Weighted UniFrac distance values were used to perform principal-coordinate analysis on epilimnion (A) and hypolimnion (B) samples. The percentage of variance explained by the first two axes is reported in the axis labels. In both layers, samples cluster significantly by lake and mixing regime as tested using PERMANOVA (Table S2). (See Table 1 for lake abbreviations.) Data represented by ellipses indicating the clustering of each lake were calculated on the basis of standard errors using a 95% confidence interval. Differences in bacterial community composition between lakes and mixing regimes are more pronounced in hypolimnia than epilimnia. Additional plots of this ordination colored by other factors are shown in Fig. S5.
FIG 3
FIG 3
Interannual variability and dispersion by lake. (A to C) Principal-coordinate analysis using weighted UniFrac as the distance metric was used to measure the amount of interannual variation in the three lake hypolimnia with the longest time series (Trout Bog [A], South Sparkling Bog [B], and Mary Lake [C]). Additional ordinations of lake epilimnia are provided as supplemental figures (Fig. S5). Black crosses indicated the centroid for each year. All hypolimnia showed significant clustering by year by PERMANOVA (Table S2). Six outliers in Mary Lake from 2007 are not shown, as their coordinates lie outside the range specified for consistency between plots; these points were included in the PERMANOVA significance test. (D) Pairwise weighted UniFrac distance values within each lake and layer, including all samples. Stars indicate significant differences between layers at P = <0.05 by a Wilcoxon signed-rank test with a Bonferroni correction for multiple pairwise comparisons. 05, 2005; 07, 2007; 08, 2008; 09, 2009; CBE, Crystal Bog epilimnia; CBH, Crystal Bog hypolimnia; FBE, Forestry Bog epilimnia; FBH, Forestry Bog hypolimnia; WSE, West Sparkling Bog epilimnia; WSH, West Sparkling Bog hypolimnia; NSE, North Sparkling Bog epilimnia; NSH, North Sparkling Bog hypolimnia; TBE, Trout Bog epilimnia; TBH, Trout Bog hypolimnia; SSE, South Sparkling Bog epilimnia; SSH, South Sparkling Bog hypolimnia; HKE, Hell's Kitchen epilimnia; HKH, Hell's Kitchen hypolimnia; MAE, Mary Lake epilimnia; MAH, Mary Lake hypolimnia.
FIG 4
FIG 4
Numbers of unique and shared OTUs by mixing regime. To better understand how shared-community memberships differ by mixing regime, we quantified the numbers of shared and unique OTUs in each category. An OTU needed only to appear in one sample at any abundance to be considered present in a category. We found that in both the epilimnion (A) and hypolimnion (B) layers, meromictic lakes had the highest numbers of unique OTUs and polymictic lakes had the lowest. Meromictic and dimictic lakes shared the most OTUs, while meromictic and polymictic lakes shared the fewest.
FIG 5
FIG 5
Traits of freshwater lineages. These well-defined freshwater groups showed similar levels of persistence, variance, and abundance in every lake, including Crystal Bog (A), Trout Bog (B), South Sparkling Bog (C), and Mary Lake (D), despite differing abundance patterns. Data from epilimnia with at least 2 years of undisturbed sampling are shown here. Mean abundance values represent the average percentages of reads attributed to each lineage when that lineage was present. Variability was measured as the coefficient of variation (CV). Persistence (shaded color) was defined as the proportion of samples containing each lineage. Additional plots calculated by year can be found in Fig. S7.

References

    1. Shade A, Caporaso JG, Handelsman J, Knight R, Fierer N. 2013. A meta-analysis of changes in bacterial and archaeal communities with time. ISME J 7:1493–1506. doi: 10.1038/ismej.2013.54. - DOI - PMC - PubMed
    1. Faust K, Lahti L, Gonze D, de Vos WM, Raes J. 2015. Metagenomics meets time series analysis: unraveling microbial community dynamics. Curr Opin Microbiol 25:56–66. doi: 10.1016/j.mib.2015.04.004. - DOI - PubMed
    1. Jones SE, Cadkin TA, Newton RJ, McMahon KD. 2012. Spatial and temporal scales of aquatic bacterial beta diversity. Front Microbiol 3:318. doi: 10.3389/fmicb.2012.00318. - DOI - PMC - PubMed
    1. Mitsch WJ, Bernal B, Nahlik AM, Mander Ü, Zhang L, Anderson CJ, Jørgensen SE, Brix H. 2013. Wetlands, carbon, and climate change. Landscape Ecol 28:583–597. doi: 10.1007/s10980-012-9758-8. - DOI
    1. McMahon KW, McCarthy MD, Sherwood OA, Larsen T, Guilderson TP. 2015. Millennial-scale plankton regime shifts in the subtropical North Pacific Ocean. Science 350:1530–1533. doi: 10.1126/science.aaa9942. - DOI - PubMed