. 2018 May;80(5):1404-1433.
doi: 10.1007/s11538-017-0294-1. Epub 2017 Jul 5.

Three-Dimensional Spatiotemporal Modeling of Colon Cancer Organoids Reveals that Multimodal Control of Stem Cell Self-Renewal is a Critical Determinant of Size and Shape in Early Stages of Tumor Growth

Affiliations

Three-Dimensional Spatiotemporal Modeling of Colon Cancer Organoids Reveals that Multimodal Control of Stem Cell Self-Renewal is a Critical Determinant of Size and Shape in Early Stages of Tumor Growth

Huaming Yan et al. Bull Math Biol. 2018 May.

Abstract

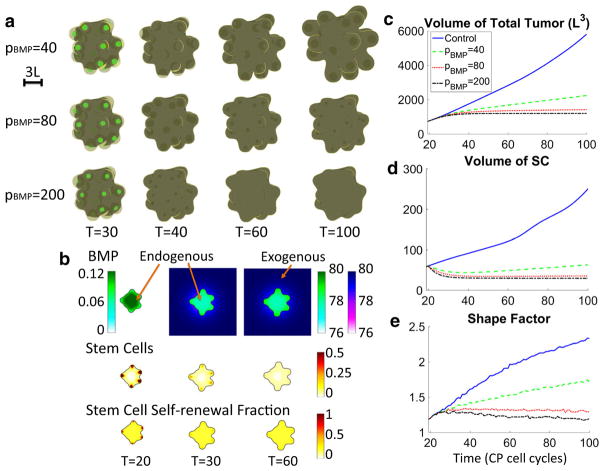
We develop a three-dimensional multispecies mathematical model to simulate the growth of colon cancer organoids containing stem, progenitor and terminally differentiated cells, as a model of early (prevascular) tumor growth. Stem cells (SCs) secrete short-range self-renewal promoters (e.g., Wnt) and their long-range inhibitors (e.g., Dkk) and proliferate slowly. Committed progenitor (CP) cells proliferate more rapidly and differentiate to produce post-mitotic terminally differentiated cells that release differentiation promoters, forming negative feedback loops on SC and CP self-renewal. We demonstrate that SCs play a central role in normal and cancer colon organoids. Spatial patterning of the SC self-renewal promoter gives rise to SC clusters, which mimic stem cell niches, around the organoid surface, and drive the development of invasive fingers. We also study the effects of externally applied signaling factors. Applying bone morphogenic proteins, which inhibit SC and CP self-renewal, reduces invasiveness and organoid size. Applying hepatocyte growth factor, which enhances SC self-renewal, produces larger sizes and enhances finger development at low concentrations but suppresses fingers at high concentrations. These results are consistent with recent experiments on colon organoids. Because many cancers are hierarchically organized and are subject to feedback regulation similar to that in normal tissues, our results suggest that in cancer, control of cancer stem cell self-renewal should influence the size and shape in similar ways, thereby opening the door to novel therapies.

Keywords: Brain tumors; Cancer stem cells; Cancer therapies; Feedback regulation; Mathematical modeling.


Figures

Fig. 1
Fig. 1
Schematic of the model. The self-renewal of stem cells (SCs) and committed progenitor cells (CPs) is controlled by positive and negative feedback factors. SCs produce self-renewal promoters (e.g., Wnt) that increase the self-renewal of SCs and CPs. The factors may be inhibited (e.g., by Dkk), which leads to pattern formation of SCs. Terminally differentiated cells (TDs) produce negative feedback factors (e.g., BMPs among the TGF-β superfamily) that reduce the self-renewal of SCs and CPs
Fig. 2
Fig. 2
3D colon tumor growth. a Time evolution of tumor cells. SCs (red, ϕSC = 0.3 surface), CPs (green, ϕCP = 0.25 surface), TDs (yellow, ϕTD = 0.35 surface) and dead cells (black, ϕD = 0.12 surface). At early stages, SC clusters emerge near the tumor boundary. Later, fingers develop into multifocal tumors, while SC clusters stay at the fingertips. b 2D slices of SCs near the center of the tumor. SC clusters begin to emerge at T = 7. At late times, SC clusters leave the slice plane. c 2D slices of self-renewal promoter CW at z = −1. Spot patterns of CW form at T = 7 and are colocalized with SC clusters. d Time evolution of crypt organoid growth from Sato et al. (2011a). Red arrow: granule-containing Paneth cells at budding sites where new crypt forms; green: Lgr5-GFP SCs; asterisk and dotted oval: autofluorescence. Scale bar 50μm. Reprinted with permission
Fig. 3
Fig. 3
Effects of different SC mitosis rate, λmSC. a Time evolution of total tumor volumes. Insets show SCs (red), CPs (green), TDs (yellow) and dead cells (black). Larger λmSC increases tumor volume. Minimal SC mitosis ( λmSC=0.1) stabilizes tumor growth. b Time evolution of SC volume fractions. Insets show SCs (red) inside the tumor (blue). Larger λmSC reduces SC fractions, since SCs are distributed sparsely at fingertips, but increases the volume of SCs, see d. c Tumor shape factors (Eq. (18)). Insets show tumor shape (yellow). Fingers are increasingly pronounced with larger λmSC. Minimal values of λmSC prevent finger development, and the tumor shape is nearly spherical. d Minimal SC mitosis ( λmSC=0.1) still results in slowly increasing volume of SCs
Fig. 4
Fig. 4
Effects of different positive feedback gain, χ0. a Time evolution of total tumor volumes. Insets show SCs (red), CPs (green), TDs (yellow) and dead cells (black). b Time evolution of SC volume fractions. Insets show SCs (red) and tumor (blue). c Tumor shape factors. Insets show tumor shape (yellow). Higher χ0 generally increases tumor volume and SC fraction. Moderate positive feedback (χ0 = 1, 2 or 5) increases the sizes of SC clusters. Fingers are more pronounced, and the shape factor is larger. Excessive positive feedback (χ0 = 10) yields a number of larger SC clusters that split during development. The tumor develops multiple smaller fingers rather than several pronounced fingers. The shape factor is greatly increased. SC volume fractions stabilize at late stages, which indicates that the values are controlled by χ0. d 2D slices of SCs at z = −1 showing splitting SC clusters
Fig. 5
Fig. 5
Effects of different negative feedback gain, ψ0. a Time evolution of total tumor volumes. Insets show SCs (red), CPs (green), TDs (yellow) and dead cells (black). b Time evolution of SC volume fractions. Insets show SCs (red) and tumor (blue). c Tumor shape factors. Insets show tumor shape (yellow). Increasing ψ0 from 0.1 to 2 effectively reduces tumor volume and shape factor. Excessive negative feedback (ψ0 = 10) stabilizes tumor growth, which is also observed in Fig. 3 when λmSC=0.1. However, the fingers and tumor shape factor continue to grow here. Higher ψ0 reduces the numbers and sizes of SC clusters. At late stages, SC fractions tend to converge to about 20% for all cases, regardless of different tumor volumes. d Large negative feedback (ψ0 = 10) still results in slowly increasing volume of SCs
Fig. 6
Fig. 6
Effects of different necrosis rate, λN . a Time evolution of total tumor volumes. Insets show SCs (red), CPs (green), TDs (yellow) and dead cells (black). b Time evolution of SC volume fractions. Insets show SCs (red) and tumor (blue). c Tumor shape factors. Insets show tumor shape (yellow). d Time evolution of dead cell volume fractions. Insets show dead cells (black) and tumor (blue). Larger λN reduces tumor size as necrosis removes viable cells. Dead cell fractions are consequently increased. SCs are closer to tumor boundary where nutrients are sufficient, and SC proliferation is powered by CW patterning, which is less affected by necrosis. In contrast, CPs and TDs are turned into DCs that eventually undergo lysis. As a result, SC volume fraction is increased. Excessive necrosis results in multifocal tumors, since cells at finger necks are killed (e.g., T = 80 and T = 100 when λN = 0.4. Tumor shape factors are not significantly changed. At earlier times, larger necrosis slightly increases the shape factor due to smaller volumes and more developed fingers. However, at later times, tumors with smaller necrosis have larger shape factors because fingers start to develop
Fig. 7
Fig. 7
Effects of different lysis rate, λL . a Time evolution of total tumor volumes. Insets show SCs (red), CPs (green), TDs (yellow) and dead cells (black). b Time evolution of SC volume fractions. Insets show SCs (red) and tumor (blue). c Tumor shape factors. Insets show tumor shape (yellow). d Time evolution of dead cell volume fractions. Insets show dead cells (black) and tumor (blue). Higher levels of λL reduce tumor size and dead cell fractions by removing dead cells. SC volume fractions are increased, since SC proliferation is not affected and the overall tumor volume is smaller. Different lysis rates hardly affect numbers and sizes of SC clusters. As a result, tumor shape factors are only slightly reduced by lysis
Fig. 8
Fig. 8
Base case of organoid growth. SC and CP mitosis rate is increased in Fig. 2, and dead cells are not removed by lysis (see Table 2). The organoid begins with the same shape but 100% SCs. a Time evolution of SCs (red), CPs (green), TDs (yellow) and dead cells (black). Similar pattern formation of SC clusters in Fig. 2 is observed at early stages. Later, the organoid grows much larger in size, while SC clusters develop fingers. However, these fingers do not develop into multifocal organoids since (dead) cells at finger necks are not removed. b 2D slices of SCs at z = 0. SC clusters begin to emerge at T = 5 (earlier than T = 7 in Fig. 2). c 2D slices of self-renewal promoter CW at z = 0. Spot patterns of CW form at T = 5 and are colocalized with SC clusters
Fig. 9
Fig. 9
Effects of BMP treatment on organoids. a Time evolution of organoids treated by increasing amounts of BMP. No SC is plotted since the volume fraction drops below the 30% level for isosurfaces. b 2D slices of BMP, SCs and SC self-renewal probability p0 at z = 0. Exogenous BMP effectively removes SC clusters near the organoid boundary by reducing p0 below 0.5. c Time evolution of total organoid volumes; d Volume of SCs and e shape factors. BMP treatments force SCs to differentiate and remove SC clusters. Consequently, finger development is suppressed and the shape factor decreases. Large amounts of BMP stabilize organoid volume as well as the shape factor. The SCs are not extinct because the division rate at the tumor center is small. See Fig. S9D in Supplemental Materials
Fig. 10
Fig. 10
Effects of inhibiting Wnt secretion. a Time evolution of SCs with decreasing diffusivity of Wnt. b 2D slices of SCs and Wnt at z = 0. c Time evolution of total organoid volumes. d Volume of SCs. The SCs are not extinct due to small division rate at the tumor center. See Fig. S15 in Supplemental Materials. e Top: Axin2-LacZ crypts in ENR medium; bottom: adding Wnt secretion inhibitor (porcupine inhibitor) IWP1 results in a nearly spherical shape, in contrast to pronounced crypt formation in the top panel (Sato et al. 2011a). Reprinted with permission
Fig. 11
Fig. 11
Effects of HGF treatment on organoids. a Time evolution of organoids with increasing effects of HGF (λHGF)on Wnt production. b Time evolution of total organoid volumes. c SC fractions and d shape factors. e 2D slices of SCs at the center of the tumor for different λHGF. Small λHGF promotes pattern formation. A number of new SC clusters form at the organoid boundary. Existing SC clusters split as they grow. Together, they increase the shape factor. Intermediate λHGF increases the size of SC clusters, which later develop into stripes on the boundary. Large λHGF significantly increase the size of SC clusters but suppresses finger development, and the organoid grows in compact shape. Note that the response of organoid shape factors to HGF at late times is non-monotone, see Fig. S12A in Supplemental Materials
Fig. 12
Fig. 12
Effects of Wnt treatment on organoids. a Time evolution of organoids treated by increasing amounts of Wnt. b Time evolution of total organoid volumes. c SC fractions and d shape factors. e 2D slices of SCs at the center of the tumor for different amounts of Wnt. Small amounts of Wnt promote SC pattern formation and result in more SC clusters. With intermediate Wnt delivery, SC clusters grow into annulus that later split into multiple clusters. Consequently, the shape factor increases. Large amounts of Wnt significantly increase SC cluster size, and SCs cover the organoid boundary similar to large λHGF in Fig. 11. Organoid shape is more compact. The effects of Wnt treatments, including the non-monotone response of organoid shape factors, are similar to those of HGF treatments (see also Figs. S12 and S13 in Supplemental Materials)

Similar articles

Cited by

References

    1. Abdullah LN, Chow EKH. Mechanisms of chemoresistance in cancer stem cells. Clin Transl Med. 2013;2(1):3. doi: 10.1186/2001-1326-2-3. - DOI - PMC - PubMed
    1. Aoki K, Taketo MM. Adenomatous polyposis coli (APC): a multi-functional tumor suppressor gene. J Cell Sci. 2007;120(19):3327–3335. doi: 10.1242/jcs.03485. - DOI - PubMed
    1. Barker N. Adult intestinal stem cells: critical drivers of epithelial homeostasis and regeneration. Nat Rev Mol Cell Biol. 2014;15(1):19–33. doi: 10.1038/nrm3721. - DOI - PubMed
    1. Barker N, Ridgway RA, van Es JH, van de Wetering M, Begthel H, van den Born M, Danenberg E, Clarke AR, Sansom OJ, Clevers H. Crypt stem cells as the cells-of-origin of intestinal cancer. Nature. 2009;457(7229):608–611. doi: 10.1038/nature07602. - DOI - PubMed
    1. Bearer EL, Lowengrub J, Frieboes HB, Chuang YL, Jin F, Wise SM, Ferrari M, Agus DB, Cristini V. Multiparameter computational modeling of tumor invasion. Cancer Res. 2009;69(10):4493–4501. doi: 10.1158/0008-5472.CAN-08-3834. - DOI - PMC - PubMed

Publication types

LinkOut - more resources