

A deep feature fusion methodology for breast cancer diagnosis demonstrated on three imaging modality datasets
- PMID: 28681390
- PMCID: PMC5646225
- DOI: 10.1002/mp.12453
A deep feature fusion methodology for breast cancer diagnosis demonstrated on three imaging modality datasets
Abstract
Background: Deep learning methods for radiomics/computer-aided diagnosis (CADx) are often prohibited by small datasets, long computation time, and the need for extensive image preprocessing.
Aims: We aim to develop a breast CADx methodology that addresses the aforementioned issues by exploiting the efficiency of pre-trained convolutional neural networks (CNNs) and using pre-existing handcrafted CADx features.
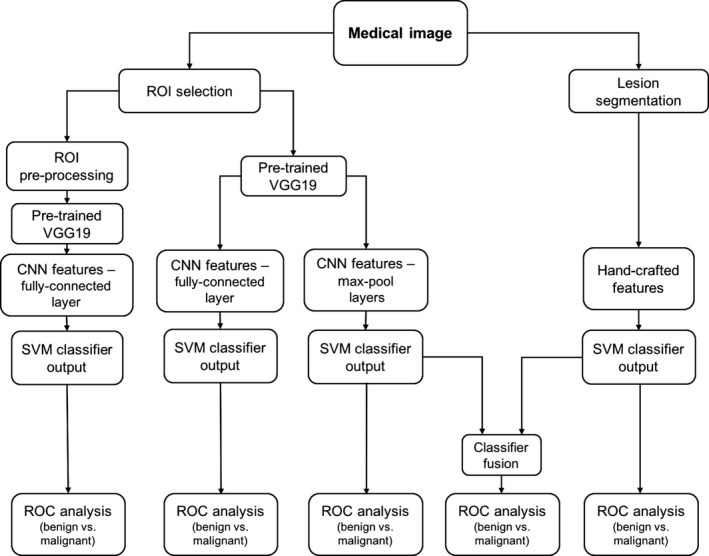
Materials & methods: We present a methodology that extracts and pools low- to mid-level features using a pretrained CNN and fuses them with handcrafted radiomic features computed using conventional CADx methods. Our methodology is tested on three different clinical imaging modalities (dynamic contrast enhanced-MRI [690 cases], full-field digital mammography [245 cases], and ultrasound [1125 cases]).
Results: From ROC analysis, our fusion-based method demonstrates, on all three imaging modalities, statistically significant improvements in terms of AUC as compared to previous breast cancer CADx methods in the task of distinguishing between malignant and benign lesions. (DCE-MRI [AUC = 0.89 (se = 0.01)], FFDM [AUC = 0.86 (se = 0.01)], and ultrasound [AUC = 0.90 (se = 0.01)]).
Discussion/conclusion: We proposed a novel breast CADx methodology that can be used to more effectively characterize breast lesions in comparison to existing methods. Furthermore, our proposed methodology is computationally efficient and circumvents the need for image preprocessing.
Keywords: breast cancer; deep learning; feature extraction.
© 2017 American Association of Physicists in Medicine.
Figures


Similar articles
-
Discriminating solitary cysts from soft tissue lesions in mammography using a pretrained deep convolutional neural network.Med Phys. 2017 Mar;44(3):1017-1027. doi: 10.1002/mp.12110. Med Phys. 2017. PMID: 28094850
-
A computer-aided diagnosis system for breast DCE-MRI at high spatiotemporal resolution.Med Phys. 2016 Jan;43(1):84. doi: 10.1118/1.4937787. Med Phys. 2016. PMID: 26745902
-
A deep learning methodology for improved breast cancer diagnosis using multiparametric MRI.Sci Rep. 2020 Jun 29;10(1):10536. doi: 10.1038/s41598-020-67441-4. Sci Rep. 2020. PMID: 32601367 Free PMC article.
-
Convolutional neural networks for computer-aided detection or diagnosis in medical image analysis: An overview.Math Biosci Eng. 2019 Jul 15;16(6):6536-6561. doi: 10.3934/mbe.2019326. Math Biosci Eng. 2019. PMID: 31698575 Review.
-
Involvement of Machine Learning for Breast Cancer Image Classification: A Survey.Comput Math Methods Med. 2017;2017:3781951. doi: 10.1155/2017/3781951. Epub 2017 Dec 31. Comput Math Methods Med. 2017. PMID: 29463985 Free PMC article. Review.
Cited by
-
The Integration of Radiomics and Artificial Intelligence in Modern Medicine.Life (Basel). 2024 Oct 1;14(10):1248. doi: 10.3390/life14101248. Life (Basel). 2024. PMID: 39459547 Free PMC article. Review.
-
A deep survival interpretable radiomics model of hepatocellular carcinoma patients.Phys Med. 2021 Feb;82:295-305. doi: 10.1016/j.ejmp.2021.02.013. Epub 2021 Mar 10. Phys Med. 2021. PMID: 33714190 Free PMC article.
-
Current Status and Future Perspectives of Artificial Intelligence in Magnetic Resonance Breast Imaging.Contrast Media Mol Imaging. 2020 Aug 28;2020:6805710. doi: 10.1155/2020/6805710. eCollection 2020. Contrast Media Mol Imaging. 2020. PMID: 32934610 Free PMC article. Review.
-
Metabolomics by NMR Combined with Machine Learning to Predict Neoadjuvant Chemotherapy Response for Breast Cancer.Cancers (Basel). 2022 Oct 15;14(20):5055. doi: 10.3390/cancers14205055. Cancers (Basel). 2022. PMID: 36291837 Free PMC article.
-
Cross-organ, cross-modality transfer learning: feasibility study for segmentation and classification.IEEE Access. 2020;8:210194-210205. doi: 10.1109/access.2020.3038909. Epub 2020 Nov 18. IEEE Access. 2020. PMID: 33680628 Free PMC article.
References
-
- Giger ML, Karssemeijer N, Schnabel JA. Breast image analysis for risk assessment, detection, diagnosis, and treatment of cancer. Annu Rev Biomed Eng. 2013;15:327–357. - PubMed
-
- Zhang W, Doi K, Giger ML, Wu Y, Nishikawa RM, Schmidt R. A Computerized detection of clustered microcalcifications in digital mammograms using a shift‐invariant artificial neural network. Med Phys. 1994;21:517–524. - PubMed
-
- Lo SCB, Chan HP, Lin JS, Li H, Freedman MT, Mun SK. Artificial convolution neural network for medical image pattern recognition. Neural Netw. 1995;8:1201–1214.
-
- Yosinski J, Clune J, Bengio Y, Lipson H. How transferable are features in deep neural networks? Adv Neural Inf Process Syst. 2014;27:3320–3328.
-
- Donahue J, Jia Y, Vinyals O, et al. DeCAF: A Deep Convolutional Activation Feature for Generic Visual Recognition. in Proceedings of The 31st International Conference on Machine Learning 647–655; 2014.
MeSH terms
Grants and funding
LinkOut - more resources
Full Text Sources
Other Literature Sources
Medical
