. 2017 Dec;5(4):480-492.
doi: 10.1002/iid3.184. Epub 2017 Jul 6.

Human monocytes downregulate innate response receptors following exposure to the microbial metabolite n-butyrate

Affiliations

Human monocytes downregulate innate response receptors following exposure to the microbial metabolite n-butyrate

Felix Lasitschka et al. Immun Inflamm Dis. 2017 Dec.

Abstract

Introduction: Hyporesponsiveness of human lamina propria immune cells to microbial and nutritional antigens represents one important feature of intestinal homeostasis. It is at least partially mediated by low expression of the innate response receptors CD11b, CD14, CD16 as well as the cystine-glutamate transporter xCT on these cells. Milieu-specific mechanisms leading to the down-regulation of these receptors on circulating monocytes, the precursor cells of resident macrophages, are mostly unknown.

Methods: Here, we addressed the question whether the short chain fatty acid n-butyrate, a fermentation product of the mammalian gut microbiota exhibiting histone deacetylase inhibitory activity, is able to modulate expression of these receptors in human circulating monocytes.

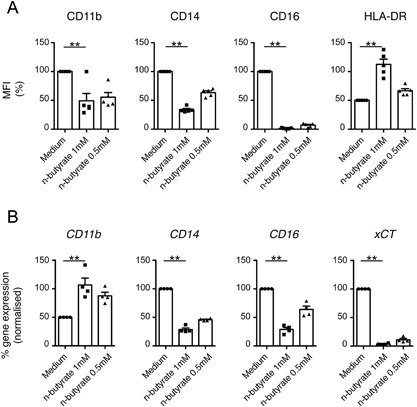
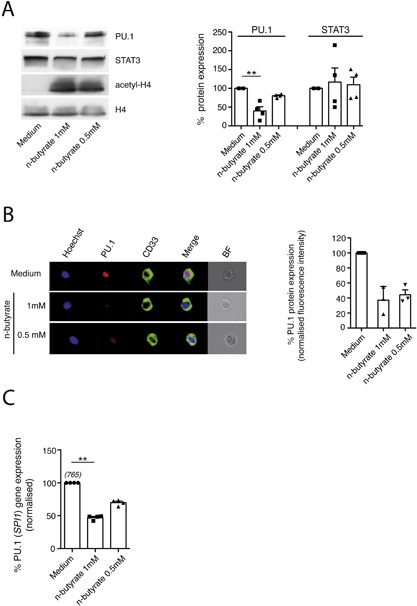
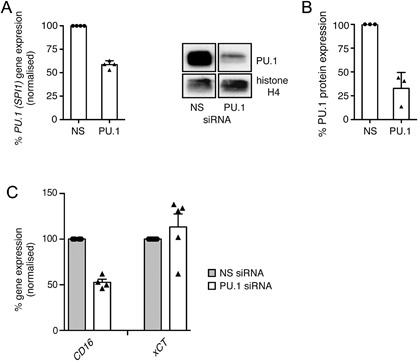
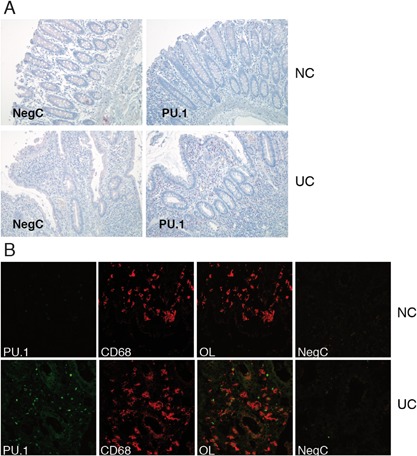
Results: Exposure to n-butyrate resulted in the downregulation of CD11b, CD14, as well as CD16 surface expression on circulating monocytes. XCT transcript levels in circulating monocytes were also reduced following exposure to n-butyrate. Importantly, treatment resulted in the downregulation of protein and gene expression of the transcription factor PU.1, which was shown to be at least partially required for the expression of CD16 in circulating monocytes. PU.1 expression in resident macrophages in situ was observed to be substantially lower in healthy when compared to inflamed colonic mucosa.

Conclusions: In summary, the intestinal microbiota may support symbiosis with the human host organism by n-butyrate mediated downregulation of protein and gene expression of innate response receptors as well as xCT on circulating monocytes following recruitment to the lamina propria. Downregulation of CD16 gene expression may at least partially be caused at the transcriptional level by the n-butyrate mediated decrease in expression of the transcription factor PU.1 in circulating monocytes.

Keywords: Human; inflammation; monocytes/macrophages; mucosa.


Figures

Figure 1
Figure 1
N‐butyrate downregulates expression of innate response receptors as well as the cysteine‐glutamate transporter xCT in primary human PBMO. PBMC were cultured in the absence or presence of different concentrations of n‐butyrate (1 mM, 0.5 mM). (A) After 24 h of culture, PBMC were harvested, stained with the appropriate antibodies, and subject to flow cytometric analysis. A gate was set on CD45+ lineage (CD3/CD19/CD20/CD56) CD33+ HLA‐DR+ annexin V PBMO in order to determine surface expression levels of CD11b, CD14, CD16 as well as HLA‐DR specifically on this cell population. Results are presented as % mean fluorescence intensity (MFI) of untreated control (medium). Shown is the mean ± SEM as well as individual data points of 5 independent experiments. (B) After 4 h of culture, expression of the genes encoding CD11b, CD14, CD16, and xCT was determined by qPCR. Normalized transcript levels in n‐butyrate treated PBMO were presented as % expression of untreated control (medium). Shown is the mean ± SEM as well as individual data points of 3–4 independent experiments.
Figure 2
Figure 2
Exposure to n‐butyrate results in downregulation of PU.1 expression in primary human PBMO. PBMO were cultured in the absence or presence of different concentrations of n‐butyrate (1 mM, 0.5 mM). (A) After 24 h of culture in the presence of the pan‐caspase inhibitor z‐VAD‐fmk, protein expression of PU.1, STAT3 and histone H4 (loading control) as well as the acetylation state of histone H4 (acetyl‐H4) was determined in PBMO lysates by Western blotting using PU.1, STAT3, histone H4, and acetylated histone H4 specific antibodies (left panel). Corresponding densitometric quantification of protein expression levels was performed as described in Materials and Methods (right panel). Shown are the means ± SEM as well as individual data points of 5 independent experiments. (B) Cells were stained for Hoechst 33342, CD33, annexin V, and PU.1 and analyzed by InFlow microscopy. At least 10,000 images were collected and gating was performed to generate a set of single, in‐focus cell images. A region was created on CD33+ annexin V PBMO. Left panel: Representative images of PU.1 in annexin V PBMO (−/+ n‐butyrate) were selected and are shown with the overlay images of PU.1, Hoechst 33342 and CD33 (termed merge) in the 4th column. BF: bright field. Right panel: PU.1 expression (measured as fluorescence intensity) in annexin V untreated PBMO (Medium) was set to 100%. PU.1 expression levels in n‐butyrate (1 mM, 0.5 mM) treated PBMO was calculated as % expression of untreated control. Shown are the means ± SEM as well as individual data points of 3 independent experiments. (C) After 4 h of culture, expression of the gene encoding PU.1 (SPI1) was determined by qPCR. Normalized transcript levels in n‐butyrate (1 mM, 0.5 mM) treated PBMO were presented as % expression of untreated control (medium). Shown are the means ± SEM as well as individual data points of 3–4 independent experiments. Numbers in brackets indicate the mean transcript numbers (normalized to PPIB) of 3–4 independent experiments.
Figure 3
Figure 3
PU.1 knock‐down results in reduced CD16 receptor gene expression in PBMO. PBMO were transfected with PU.1‐specific (PU.1) or non‐silencing (NS) siRNA. (A) After 24 h, PU.1 gene expression levels were analyzed by qPCR. (B) After 24 h, protein expression of PU.1 and histone H4 (loading control) was determined in PBMO lysates by Western blotting using PU.1 and histone H4 specific antibodies (left panel). Corresponding densitometric quantification of PU.1 protein expression levels was performed as described in Materials and Methods (right panel). Shown are the means ± SEM as well as individual data points of 3–4 independent experiments. (C) Transcript levels of CD11b, CD14, CD16, and xCT in siRNA‐transfected PBMO were analyzed by qPCR and expressed as percentage based on the level in nonsilencing (NS) siRNA‐transfected cells. Shown are mean transcript numbers ± SEM as well as individual data points of 4 independent experiments.
Figure 4
Figure 4
In situ expression of the transcription factor PU.1 in normal and inflamed colon mucosa. (A) Tissue sections of normal (NC) and inflamed colonic mucosa (UC) were subject to immunostaining for PU.1 (red staining). The result of 1 representative experiment out of 3 is shown. Negative control (NegC): rabbit IgG was employed as first antibody. Paraformaldehyde‐saponin procedure, alkaline phosphatase; magnification, ×30. (B) Immunofluorescence staining of PU.1 (green), and CD68 (red) in normal colonic mucosa (NC) and a case of inflamed colon in ulcerative colitis (UC). The result of 1 representative experiment out of 3 is shown. OL, overlay; magnification, ×40.

References

    1. Hooper, L. V. , and Macpherson A. J.. 2010. Immune adaptations that maintain homeostasis with the intestinal microbiota. Nat. Rev. Immunol. 10:159–169. - PubMed
    1. Qiao, L. , Braunstein J., Golling M., Schurmann G., Autschbach F., Moller P., and Meuer S.. 1996. Differential regulation of human T cell responsiveness by mucosal versus blood monocytes. Eur. J. Immunol. 26:922–927. - PubMed
    1. Rogler, G. , Hausmann M., Vogl D., Aschenbrenner E., Andus T., Falk W., Andreesen R., Scholmerich J., and Gross V.. 1998. Isolation and phenotypic characterization of colonic macrophages. Clin. Exp. Immunol. 112:205–215. - PMC - PubMed
    1. Smythies, L. E. , Sellers M., Clements R. H., Mosteller‐Barnum M., Meng G., Benjamin W. H., Orenstein J. M., and Smith P. D.. 2005. Human intestinal macrophages display profound inflammatory anergy despite avid phagocytic and bacteriocidal activity. J. Clin. Invest. 115:66–75. - PMC - PubMed
    1. Medzhitov, R. 2008. Origin and physiological roles of inflammation. Nature 454:428–435. - PubMed

Publication types

MeSH terms