

Correlation between human ether-a-go-go-related gene channel inhibition and action potential prolongation
- PMID: 28681507
- PMCID: PMC5573420
- DOI: 10.1111/bph.13942
Correlation between human ether-a-go-go-related gene channel inhibition and action potential prolongation
Abstract
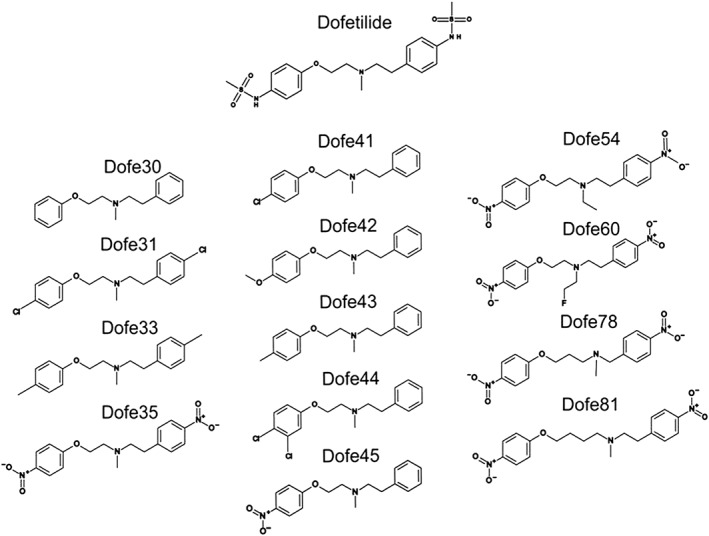
Background and purpose: Human ether-a-go-go-related gene (hERG; Kv 11.1) channel inhibition is a widely accepted predictor of cardiac arrhythmia. hERG channel inhibition alone is often insufficient to predict pro-arrhythmic drug effects. This study used a library of dofetilide derivatives to investigate the relationship between standard measures of hERG current block in an expression system and changes in action potential duration (APD) in human-induced pluripotent stem cell-derived cardiomyocytes (hiPSC-CMs). The interference from accompanying block of Cav 1.2 and Nav 1.5 channels was investigated along with an in silico AP model.
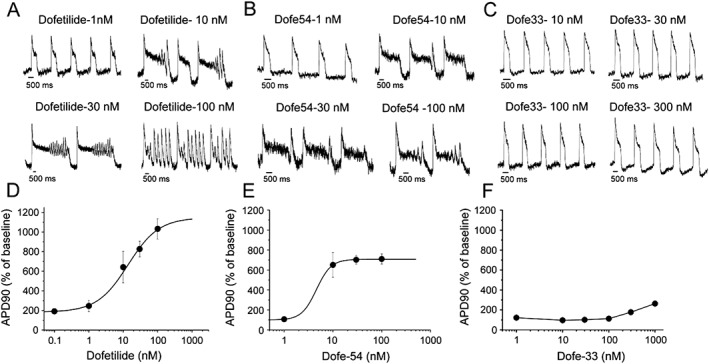
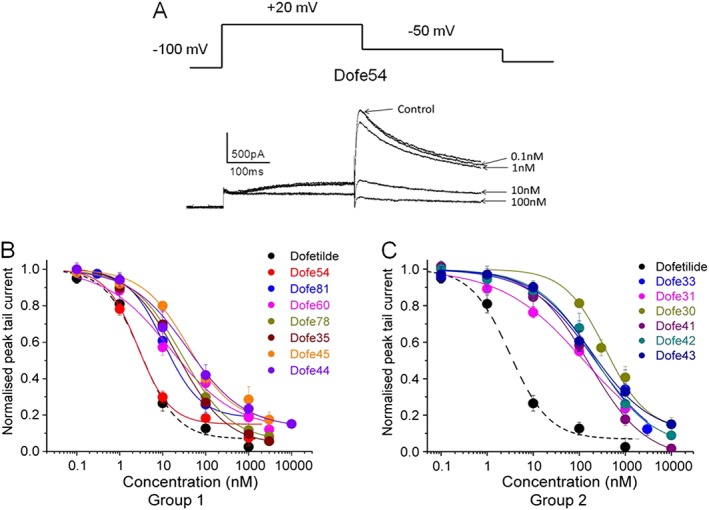
Experimental approach: Drug-induced changes in APD were assessed in hiPSC-CMs using voltage-sensitive dyes. The IC50 values for dofetilide and 13 derivatives on hERG current were estimated in an HEK293 expression system. The relative potency of each drug on APD was estimated by calculating the dose (D150 ) required to prolong the APD at 90% (APD90 ) repolarization by 50%.
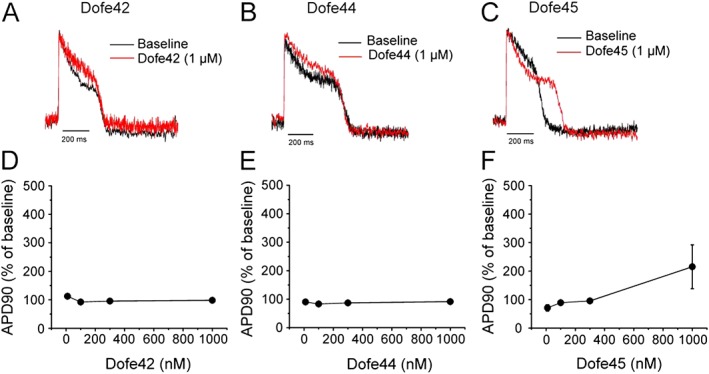
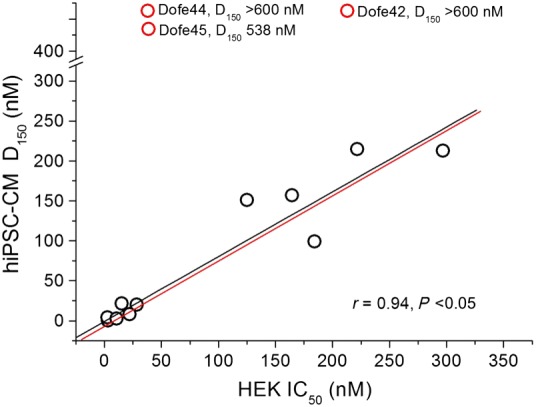
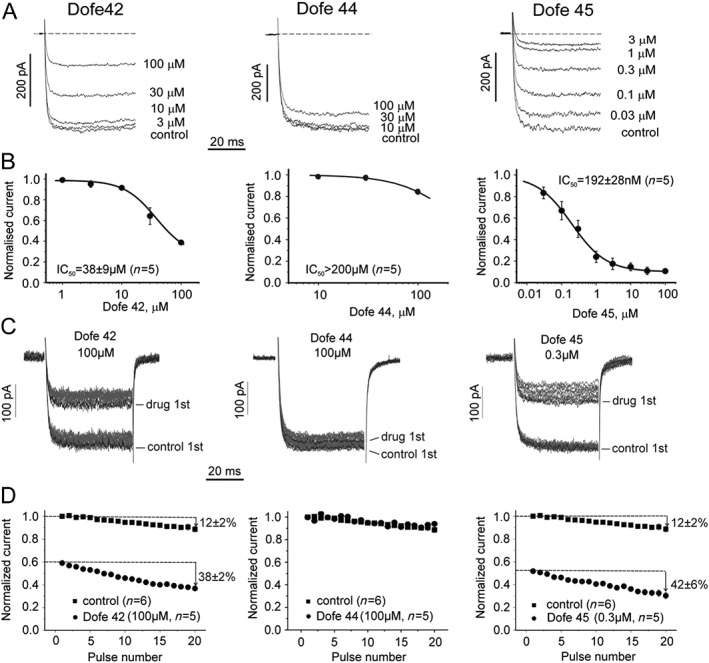
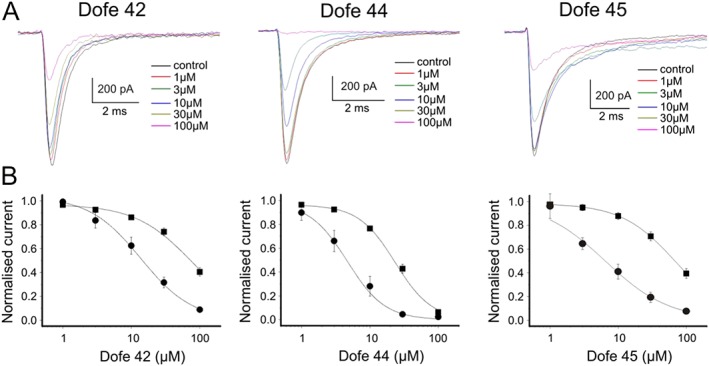
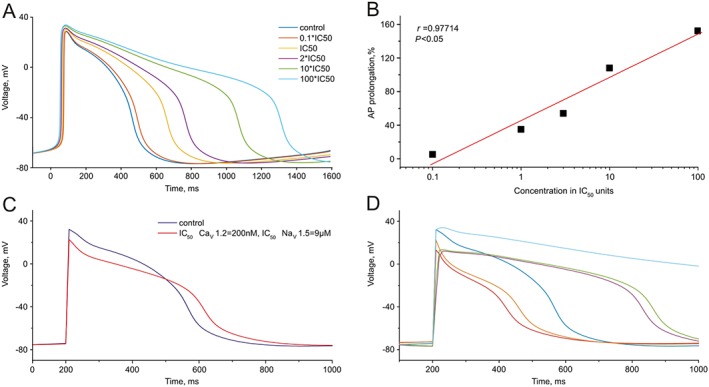
Key results: The D150 in hiPSC-CMs was linearly correlated with IC50 of hERG current. In silico simulations supported this finding. Three derivatives inhibited hERG without prolonging APD, and these compounds also inhibited Cav 1.2 and/or Nav 1.5 in a channel state-dependent manner. Adding Cav 1.2 and Nav 1.2 block to the in silico model recapitulated the direction but not the extent of the APD change.
Conclusions and implications: Potency of hERG current inhibition correlates linearly with an index of APD in hiPSC-CMs. The compounds that do not correlate have additional effects including concomitant block of Cav 1.2 and/or Nav 1.5 channels. In silico simulations of hiPSC-CMs APs confirm the principle of the multiple ion channel effects.
© 2017 The Authors. British Journal of Pharmacology published by John Wiley & Sons Ltd on behalf of British Pharmacological Society.
Figures
Similar articles
-
Mechanisms of zolpidem-induced long QT syndrome: acute inhibition of recombinant hERG K(+) channels and action potential prolongation in human cardiomyocytes derived from induced pluripotent stem cells.Br J Pharmacol. 2013 Mar;168(5):1215-29. doi: 10.1111/bph.12002. Br J Pharmacol. 2013. PMID: 23061993 Free PMC article.
-
Comparative pharmacology of guinea pig cardiac myocyte and cloned hERG (I(Kr)) channel.J Cardiovasc Electrophysiol. 2004 Nov;15(11):1302-9. doi: 10.1046/j.1540-8167.2004.04099.x. J Cardiovasc Electrophysiol. 2004. PMID: 15574182
-
Targeted activation of human ether-à-go-go-related gene channels rescues electrical instability induced by the R56Q+/- long QT syndrome variant.Cardiovasc Res. 2023 Nov 25;119(15):2522-2535. doi: 10.1093/cvr/cvad155. Cardiovasc Res. 2023. PMID: 37739930 Free PMC article.
-
The cardiac hERG/IKr potassium channel as pharmacological target: structure, function, regulation, and clinical applications.Curr Pharm Des. 2006;12(18):2271-83. doi: 10.2174/138161206777585102. Curr Pharm Des. 2006. PMID: 16787254 Review.
-
[HERG K+ channel, the target of anti-arrhythmias drugs].Yao Xue Xue Bao. 2007 Jul;42(7):687-91. Yao Xue Xue Bao. 2007. PMID: 17882949 Review. Chinese.
Cited by
-
Towards chamber specific heart-on-a-chip for drug testing applications.Adv Drug Deliv Rev. 2020;165-166:60-76. doi: 10.1016/j.addr.2019.12.002. Epub 2020 Jan 7. Adv Drug Deliv Rev. 2020. PMID: 31917972 Free PMC article.
-
Contractility measurements for cardiotoxicity screening with ventricular myocardial slices of pigs.Cardiovasc Res. 2023 Nov 15;119(14):2469-2481. doi: 10.1093/cvr/cvad141. Cardiovasc Res. 2023. PMID: 37934066 Free PMC article.
-
Identification of New Rofecoxib-Based Cyclooxygenase-2 Inhibitors: A Bioinformatics Approach.Pharmaceuticals (Basel). 2020 Aug 26;13(9):209. doi: 10.3390/ph13090209. Pharmaceuticals (Basel). 2020. PMID: 32858871 Free PMC article.
References
-
- Ellis S, Williams M, Ways N, Brenner R, Sharp AH, Leung AT et al. (1988). Sequence and expression of mRNAs encoding the alpha 1 and alpha 2 subunits of a DHP‐sensitive calcium channel. Science 241: 1661–1664. - PubMed
MeSH terms
Substances
Grants and funding
LinkOut - more resources
Full Text Sources
Other Literature Sources
Miscellaneous
