. 2018 Jan;36(1):138-148.
doi: 10.1002/jor.23647. Epub 2017 Aug 14.

Growth plate expression profiling: Large and small breed dogs provide new insights in endochondral bone formation

Affiliations

Growth plate expression profiling: Large and small breed dogs provide new insights in endochondral bone formation

Michelle Teunissen et al. J Orthop Res. 2018 Jan.

Abstract

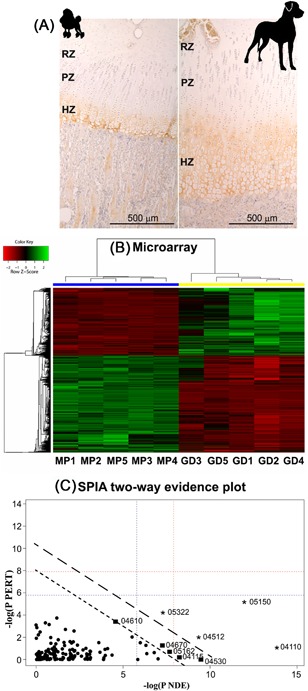
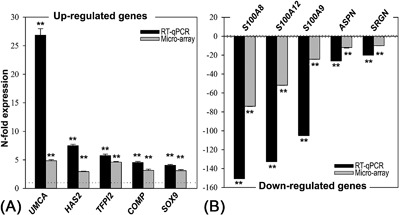
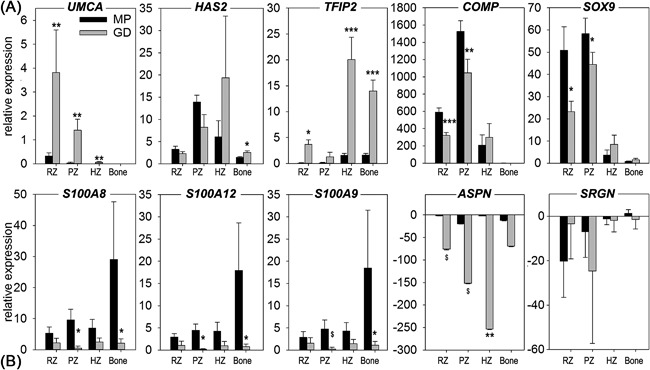
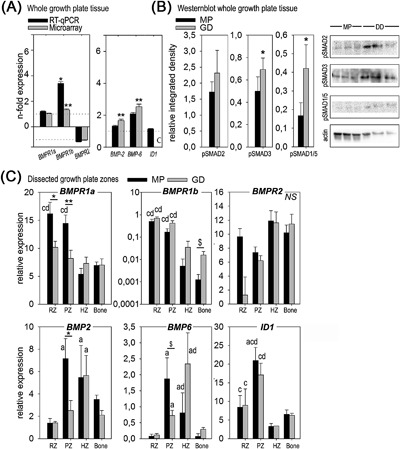
The difference in the adult height of mammals, and hence in endochondral bone formation, is not yet fully understood and may serve to identify targets for bone and cartilage regeneration. In line with this hypothesis, the intra-species disparity between the adult height of Great Danes and Miniature Poodles was investigated at a transcriptional level. Microarray analysis of the growth plate of five Great Danes and five Miniature Poodles revealed 2,981 unique genes that were differentially expressed, including many genes with an unknown role in skeletal development. A signaling pathway impact analysis indicated activation of the cell cycle, extracellular matrix receptor interaction and the tight junction pathway, and inhibition of pathways associated with inflammation and the complement cascade. In additional validation steps, the gene expression profile of the separate growth plate zones for both dog breeds were determined. Given that the BMP signaling is known for its crucial role in skeletal development and fracture healing, and BMP-2 is used in orthopaedic and spine procedures for bone augmentation, further investigations concentrated on the BMP pathway.The canonical BMP-2 and BMP-6 signaling pathway was activated in the Great Danes compared to Miniature Poodles. In conclusion, investigating the differential expression of genes involved in endochondral bone formation in small and large breed dogs, could be a game changing strategy to provide new insights in growth plate development and identify new targets for bone and cartilage regeneration. © 2017 The Authors. Journal of Orthopaedic Research® published by Wiley Periodicals, Inc. on behalf of the Orthopaedic Research Society. J Orthop Res 36:138-148, 2018.

Keywords: BMP pathway; canine; endochondral bone formation; growth plate; microarray.


Figures

Figure 1
Figure 1
Microarray analysis design. (A) Representative histological images of the growth plate of the Miniature Poodle and the Great Dane. Collagen type X immunostaining distinguishes the reserve and proliferative (RZ and PZ, respectively) from the hypertrophic zone (HZ). (B) The microarray heat map shows genes that were up‐regulated (green) and down‐regulated (red) in Great Danes relative to Miniature Poodles and was normalized by centring the mean for every gene. Clustering of the genes is displayed by the lines on the left side. On the upper side clustering of the canine samples is shown for the Great Danes (GD, yellow) and Miniature Poodles (MP, blue). (C) Signaling pathway impact analysis (SPIA) two‐way evidence plot. The global probability value is calculated by combining the probability value of the number of differentially expressed (DE) genes in the pathway (NDE) and the probability value (pPERT) of the total perturbation accumulation in the pathway. The ‐log (pNDE) and ‐log (pPERT) are plotted against each other. The uninterrupted lines are the thresholds (long = p < 0.01, short = p < 0.05). The dots with corresponding identity numbers indicate the pathways investigated in the microarray analysis as described in Table 1.
Figure 2
Figure 2
RT‐qPCR validation of the microarray analysis from the top five up‐regulated (A) and down‐regulated (B) genes. Relative gene expression in Great Danes is given in black bars (RT‐qPCR) and gray bars (microarray) as mean ± SD. Data for Miniature Poodles are set as 1 and −1 for every gene (dotted line); Significant differential regulation of the Great Dane compared with the Miniature Poodle is given (**p < 0.01).
Figure 3
Figure 3
Validation of the dissection of the growth plates by RT‐qPCR. Relative gene expression in Miniature Poodles (MP, black bars) and Great Danes (GD, gray bars) is given for the reserve (RZ), proliferative (PZ), and hypertrophic zone (HZ), and for Bone as mean ± SD. For each dog breed, the significant differences (p < 0.05) between growth plate zones are indicated.
Figure 4
Figure 4
Validation of the top five up‐ and down‐regulated genes in the dissected growth plates by RT‐qPCR. Relative gene expression in Miniature Poodles (MP, black bars) and Great Danes (GD, gray bars) is given for the reserve (RZ), proliferative (PZ), and hypertrophic zone (HZ) and for Bone as mean ± SD. For ASPN and SRGN, the downregulation is expressed in negative numbers (employing the formula −1/relative expression), due to limited expression in relation to other transcripts. $ p = 0.05–0.1; *p < 0.05; **p < 0.01; ***p < 0.001 indicate significant difference between dog breeds within the same growth plate zone or bone.
Figure 5
Figure 5
Validation of the canonical BMP signaling pathway. (A) For the whole growth plate tissue relative gene expression in Great Danes (GD) is given in black bars (RT‐qPCR) and gray bars (microarray) as mean ± SD. Data for Miniature Poodles (MP) are set as 1 and −1 for every gene (dotted line). *p < 0.05 and **p < 0.01 GD versus MP. One of the genes measured with RT‐qPCR (ID1) was not annotated in the microarray (C). (B) Integrated density of phosphorylated SMAD2, SMAD3, and SMAD1/5 determined by Western blot in the whole growth plate tissue of MP (black bars) and GD (gray bars) with representative blots. *p < 0.05 (C) Relative gene expression in the canonical BMP signaling pathway in MP (black bars) and GD (gray bars) is given for the reserve (RZ), proliferative (PZ), and hypertrophic zone (HZ), and for Bone as mean ± SD. Within each dog breed the significant differences (p < 0.05) between the given growth plate zone and the RZ, PZ, HZ, and Bone is indicated with a, b, c, and d, respectively. Differences within each growth plate between dog breeds are given with $ p = 0.05–0.1; *p < 0.05; and **p < 0.01.

References

    1. Mackie EJ, Tatarczuch L, Mirams M. 2011. The skeleton: a multi‐functional complex organ: the growth plate chondrocyte and endochondral ossification. J Endocrinol 211:109–121. - PubMed
    1. Vortkamp A, Pathi S, Peretti GM, et al. 1998. Recapitulation of signals regulating embryonic bone formation during postnatal growth and in fracture repair. Mech Dev 71:65–76. - PubMed
    1. Scotti C, Tonnarelli B, Papadimitropoulos A, et al. 2010. Recapitulation of endochondral bone formation using human adult mesenchymal stem cells as a paradigm for developmental engineering. Proc Natl Acad Sci USA 107:7251–7256. - PMC - PubMed
    1. Gawlitta D, Farrell E, Malda J, et al. 2010. Modulating endochondral ossification of multipotent stromal cells for bone regeneration. Tissue Eng B Rev 16:385–395. - PubMed
    1. Dimitriou R, Jones E, McGonagle D, et al. 2011. Bone regeneration: current concepts and future directions. BMC Med 9:66. - PMC - PubMed

Publication types

Substances