Line Detection as an Inverse Problem: Application to Lung Ultrasound Imaging
- PMID: 28682247
- PMCID: PMC6051490
- DOI: 10.1109/TMI.2017.2715880
Line Detection as an Inverse Problem: Application to Lung Ultrasound Imaging
Abstract
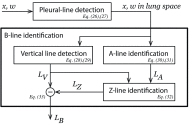
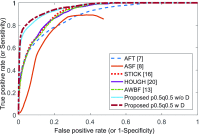
This paper presents a novel method for line restoration in speckle images. We address this as a sparse estimation problem using both convex and non-convex optimization techniques based on the Radon transform and sparsity regularization. This breaks into subproblems, which are solved using the alternating direction method of multipliers, thereby achieving line detection and deconvolution simultaneously. We include an additional deblurring step in the Radon domain via a total variation blind deconvolution to enhance line visualization and to improve line recognition. We evaluate our approach on a real clinical application: the identification of B-lines in lung ultrasound images. Thus, an automatic B-line identification method is proposed, using a simple local maxima technique in the Radon transform domain, associated with known clinical definitions of line artefacts. Using all initially detected lines as a starting point, our approach then differentiates between B-lines and other lines of no clinical significance, including Z-lines and A-lines. We evaluated our techniques using as ground truth lines identified visually by clinical experts. The proposed approach achieves the best B-line detection performance as measured by the F score when a non-convex [Formula: see text] regularization is employed for both line detection and deconvolution. The F scores as well as the receiver operating characteristic (ROC) curves show that the proposed approach outperforms the state-of-the-art methods with improvements in B-line detection performance of 54%, 40%, and 33% for [Formula: see text], [Formula: see text], and [Formula: see text], respectively, and of 24% based on ROC curve evaluations.
Figures


References
-
- Lichtenstein D. A., Mezière G. A., Lagoueyte J.-F., Biderman P., Goldstein I., and Gepner A., “A-lines and B-lines: Lung ultrasound as a bedside tool for predicting pulmonary artery occlusion pressure in the critically ill,” Chest, vol. 136, no. 4, pp. 1014–1020, 2009. - PubMed
-
- Allinovi M., Saleem M., Romagnani P., Nazerian P., and Hayes W., “Lung ultrasound: A novel technique for detecting fluid overload in children on dialysis,” Nephrol. Dialysis Transplantation, vol. 32, no. 3, pp. 541–547, 2017. - PubMed
-
- Nicolò P. D., Magnoni G., and Granata A., “Lung ultrasound in hemodialysis: A card to be played?” Blood Purif, vol. 44, no. 1, pp. 1–7, 2017. - PubMed
Publication types
MeSH terms
Grants and funding
LinkOut - more resources
Full Text Sources
Other Literature Sources
Molecular Biology Databases

