

Impact of PET and MRI threshold-based tumor volume segmentation on patient-specific targeted radionuclide therapy dosimetry using CLR1404
- PMID: 28682793
- PMCID: PMC6771923
- DOI: 10.1088/1361-6560/aa716d
Impact of PET and MRI threshold-based tumor volume segmentation on patient-specific targeted radionuclide therapy dosimetry using CLR1404
Abstract
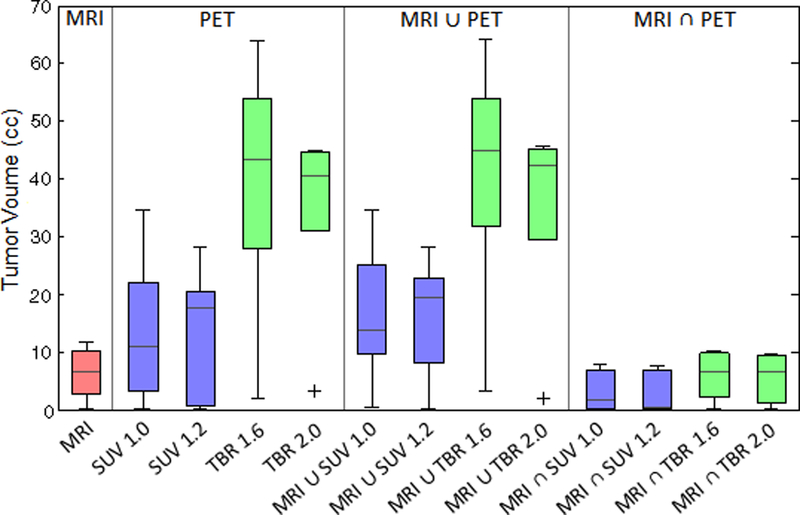
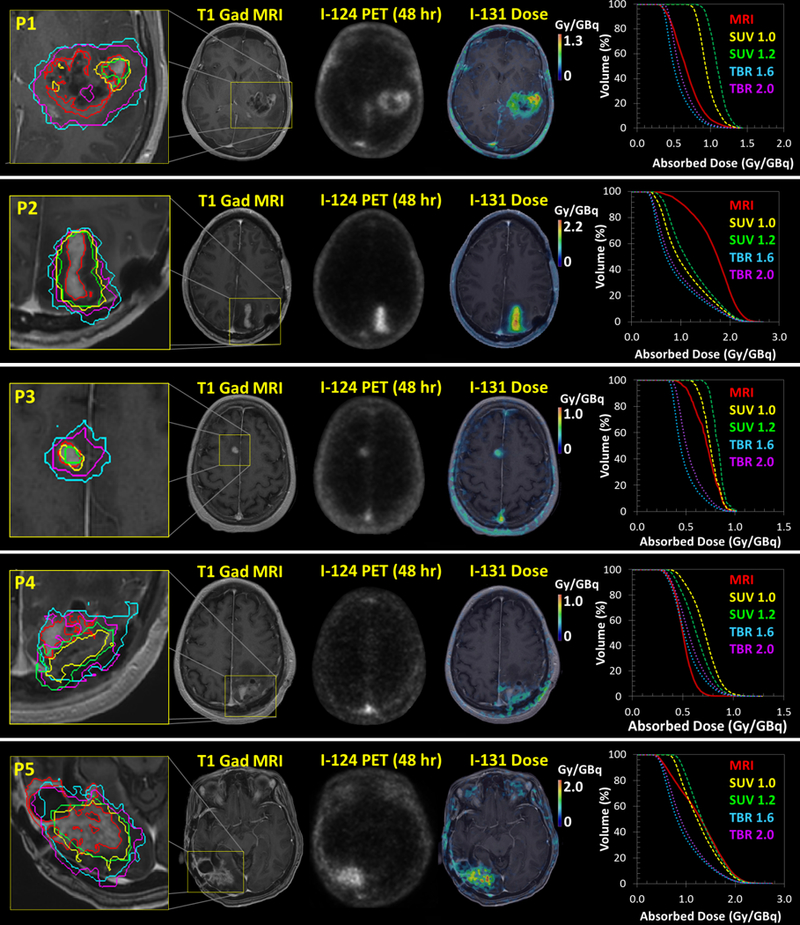
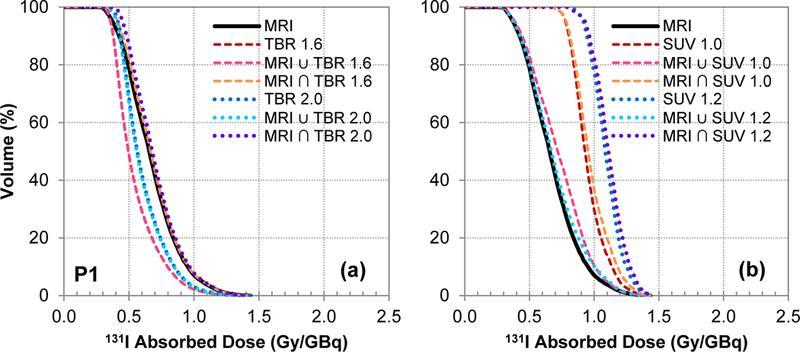
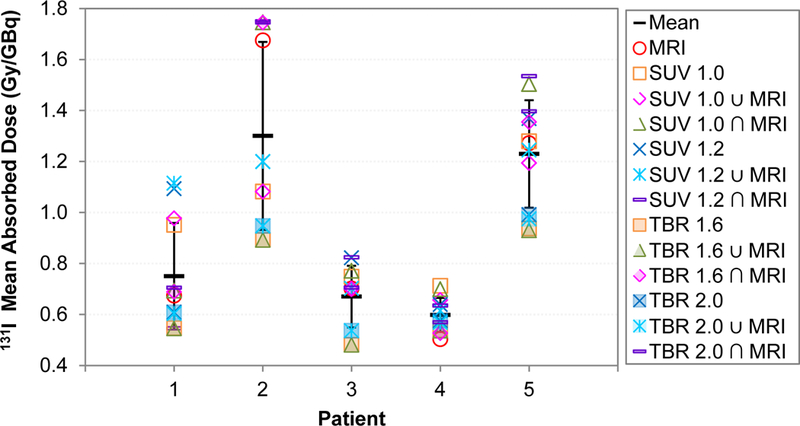
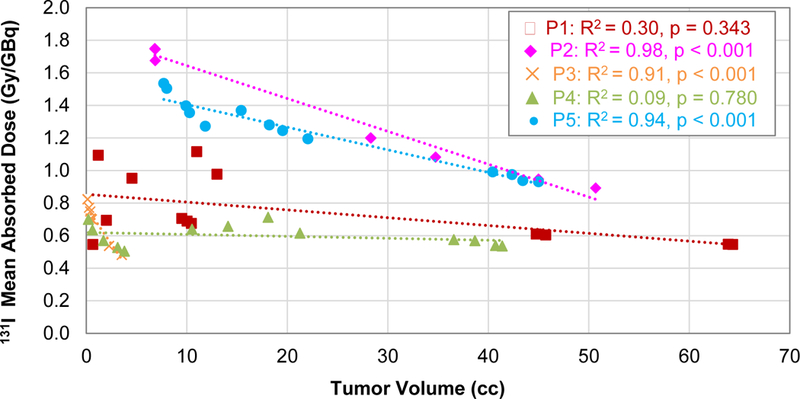
Variations in tumor volume segmentation methods in targeted radionuclide therapy (TRT) may lead to dosimetric uncertainties. This work investigates the impact of PET and MRI threshold-based tumor segmentation on TRT dosimetry in patients with primary and metastatic brain tumors. In this study, PET/CT images of five brain cancer patients were acquired at 6, 24, and 48 h post-injection of 124I-CLR1404. The tumor volume was segmented using two standardized uptake value (SUV) threshold levels, two tumor-to-background ratio (TBR) threshold levels, and a T1 Gadolinium-enhanced MRI threshold. The dice similarity coefficient (DSC), jaccard similarity coefficient (JSC), and overlap volume (OV) metrics were calculated to compare differences in the MRI and PET contours. The therapeutic 131I-CLR1404 voxel-level dose distribution was calculated from the 124I-CLR1404 activity distribution using RAPID, a Geant4 Monte Carlo internal dosimetry platform. The TBR, SUV, and MRI tumor volumes ranged from 2.3-63.9 cc, 0.1-34.7 cc, and 0.4-11.8 cc, respectively. The average ± standard deviation (range) was 0.19 ± 0.13 (0.01-0.51), 0.30 ± 0.17 (0.03-0.67), and 0.75 ± 0.29 (0.05-1.00) for the JSC, DSC, and OV, respectively. The DSC and JSC values were small and the OV values were large for both the MRI-SUV and MRI-TBR combinations because the regions of PET uptake were generally larger than the MRI enhancement. Notable differences in the tumor dose volume histograms were observed for each patient. The mean (standard deviation) 131I-CLR1404 tumor doses ranged from 0.28-1.75 Gy GBq-1 (0.07-0.37 Gy GBq-1). The ratio of maximum-to-minimum mean doses for each patient ranged from 1.4-2.0. The tumor volume and the interpretation of the tumor dose is highly sensitive to the imaging modality, PET enhancement metric, and threshold level used for tumor volume segmentation. The large variations in tumor doses clearly demonstrate the need for standard protocols for multimodality tumor segmentation in TRT dosimetry.
Figures
Similar articles
-
Pretreatment CLR 124 Positron Emission Tomography Accurately Predicts CLR 131 Three-Dimensional Dosimetry in a Triple-Negative Breast Cancer Patient.Cancer Biother Radiopharm. 2019 Feb;34(1):13-23. doi: 10.1089/cbr.2018.2568. Epub 2018 Oct 23. Cancer Biother Radiopharm. 2019. PMID: 30351218 Free PMC article.
-
[124I]CLR1404 PET/CT in High-Grade Primary and Metastatic Brain Tumors.Mol Imaging Biol. 2020 Apr;22(2):434-443. doi: 10.1007/s11307-019-01362-1. Mol Imaging Biol. 2020. PMID: 31183841 Free PMC article.
-
Targeted Molecular Radiotherapy of Pediatric Solid Tumors Using a Radioiodinated Alkyl-Phospholipid Ether Analog.J Nucl Med. 2018 Feb;59(2):244-250. doi: 10.2967/jnumed.117.193748. Epub 2017 Jul 26. J Nucl Med. 2018. PMID: 28747518 Free PMC article.
-
Intensity threshold based solid tumour segmentation method for Positron Emission Tomography (PET) images: A review.Heliyon. 2020 Oct 27;6(10):e05267. doi: 10.1016/j.heliyon.2020.e05267. eCollection 2020 Oct. Heliyon. 2020. PMID: 33163642 Free PMC article. Review.
-
Targeted radionuclide therapy: frontiers in theranostics.Front Biosci (Landmark Ed). 2017 Jun 1;22(10):1750-1759. doi: 10.2741/4569. Front Biosci (Landmark Ed). 2017. PMID: 28410143 Review.
Cited by
-
Automated lung tumor delineation on positron emission tomography/computed tomography via a hybrid regional network.Med Phys. 2023 Jan;50(1):274-283. doi: 10.1002/mp.16001. Epub 2022 Oct 13. Med Phys. 2023. PMID: 36203393 Free PMC article.
-
Pretreatment CLR 124 Positron Emission Tomography Accurately Predicts CLR 131 Three-Dimensional Dosimetry in a Triple-Negative Breast Cancer Patient.Cancer Biother Radiopharm. 2019 Feb;34(1):13-23. doi: 10.1089/cbr.2018.2568. Epub 2018 Oct 23. Cancer Biother Radiopharm. 2019. PMID: 30351218 Free PMC article.
-
Radiotherapy Target Volume Definition in Newly Diagnosed High-Grade Glioma Using 18F-FET PET Imaging and Multiparametric MRI: An Inter Observer Agreement Study.Tomography. 2022 Aug 16;8(4):2030-2041. doi: 10.3390/tomography8040170. Tomography. 2022. PMID: 36006068 Free PMC article.
-
Interrelation between Spectral Online Monitoring and Postoperative T1-Weighted MRI in Interstitial Photodynamic Therapy of Malignant Gliomas.Cancers (Basel). 2021 Dec 27;14(1):120. doi: 10.3390/cancers14010120. Cancers (Basel). 2021. PMID: 35008284 Free PMC article.
-
Low-Dose Radiation Potentiates the Propagation of Anti-Tumor Immunity against Melanoma Tumor in the Brain after In Situ Vaccination at a Tumor outside the Brain.Radiat Res. 2021 Jun 1;195(6):522-540. doi: 10.1667/RADE-20-00237.1. Radiat Res. 2021. PMID: 33826741 Free PMC article.
References
-
- 2013. ZEVALIN [package insert]. In: SPECTRUM PHARMACEUTICALS, I. (ed.). Irvine, CA.
-
- AGNOSTINELLI 2003. Geant4—a simulation toolkit. Nuclear Instruments and Methods in Physics Research Section A: Accelerators, Spectrometers, Detectors and Associated Equipment, 506, 250–303.
-
- AMRO H, WILDERMAN SJ, DEWARAJA YK & ROBERSON PL 2010. Methodology to incorporate biologically effective dose and equivalent uniform dose in patient-specific 3-dimensional dosimetry for non-Hodgkin lymphoma patients targeted with 131I-tositumomab therapy. Journal of Nuclear Medicine, 51, 654–659. - PMC - PubMed
-
- PINCHUK ANATOLYN, RAMPY MARKA, LONGINO MARCA, SKINNER RWSCOTT, GROSS MILTOND, WEICHERT JAMEYP AND & COUNSELL† RE 2006. Synthesis and Structure−Activity Relationship Effects on the Tumor Avidity of Radioiodinated Phospholipid Ether Analogues. J. Med. Chem, 49, 2155–2165. - PubMed
-
- AVRIL N, BENSE S, ZIEGLER SI & DOSE J 1997. Breast imaging with fluorine-18-FDG PET: quantitative image analysis. The Journal of nuclear medicine, 38, 1186. - PubMed
MeSH terms
Substances
Grants and funding
LinkOut - more resources
Full Text Sources
Other Literature Sources
Medical