. 2017 Jul 6;12(7):e0180154.
doi: 10.1371/journal.pone.0180154. eCollection 2017.

High-throughput electrophysiological assays for voltage gated ion channels using SyncroPatch 768PE

Affiliations

High-throughput electrophysiological assays for voltage gated ion channels using SyncroPatch 768PE

Tianbo Li et al. PLoS One. .

Abstract

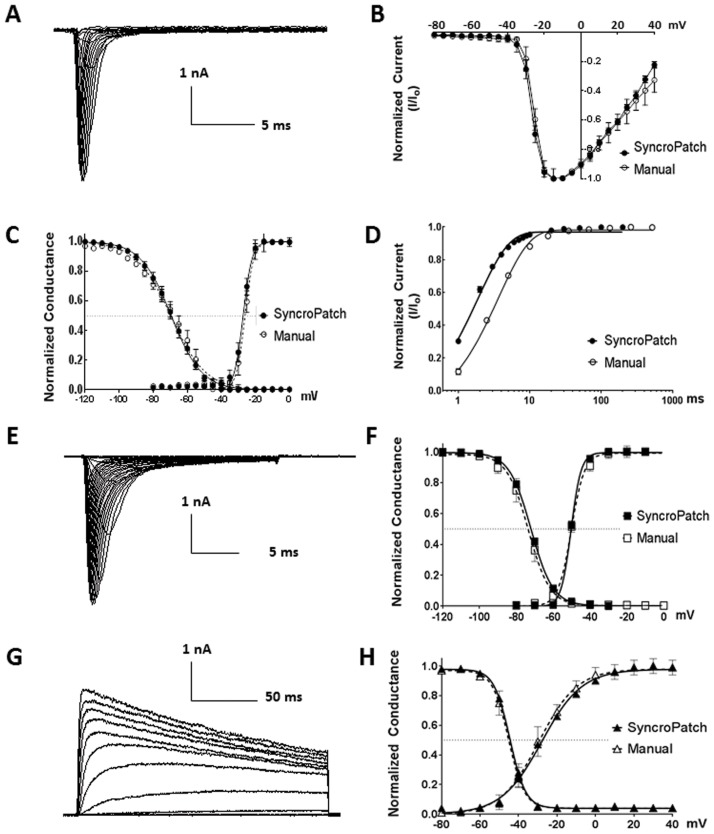
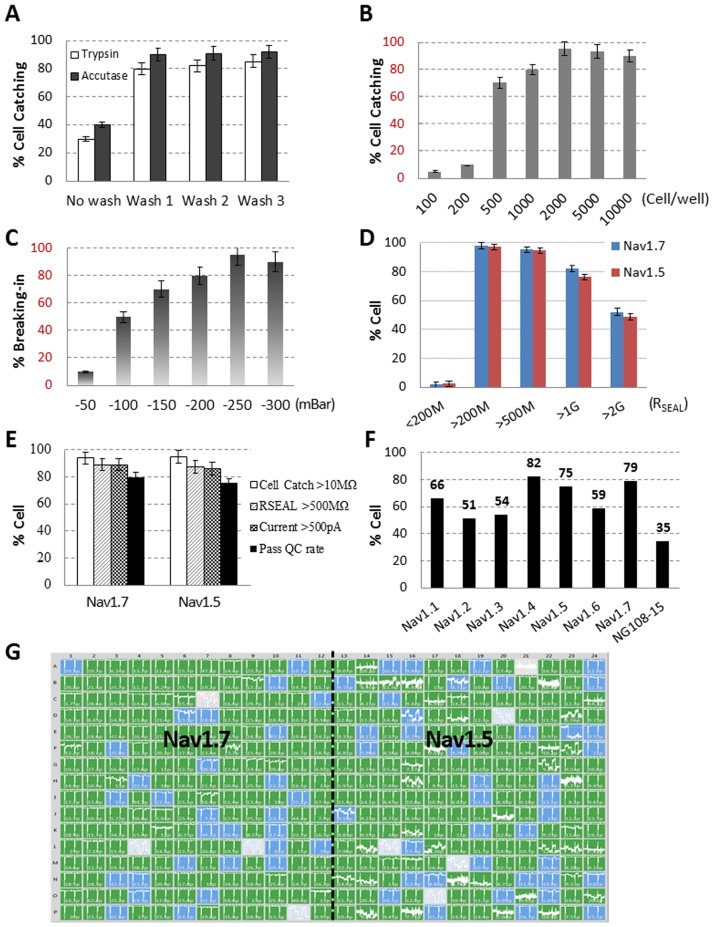
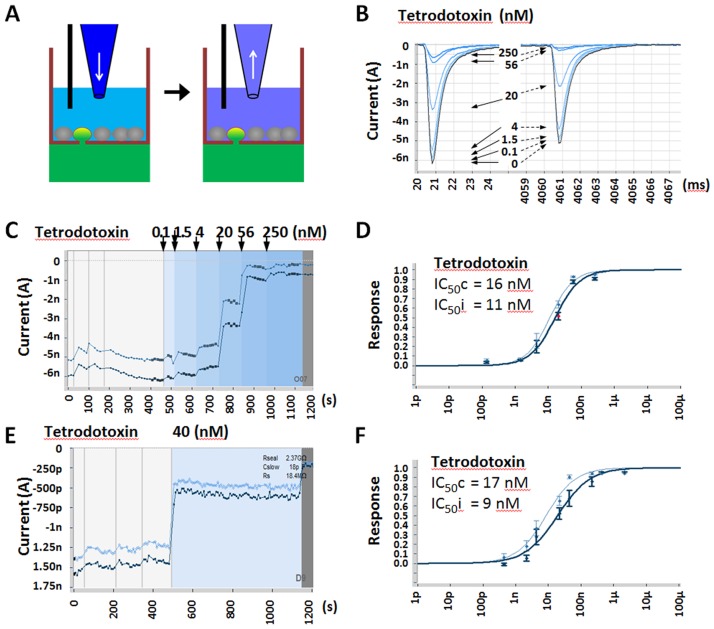
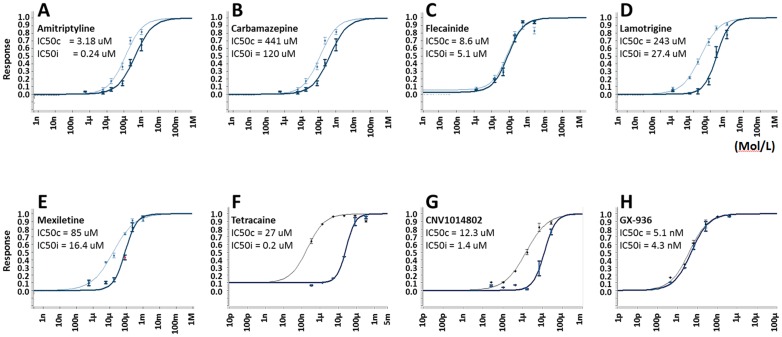
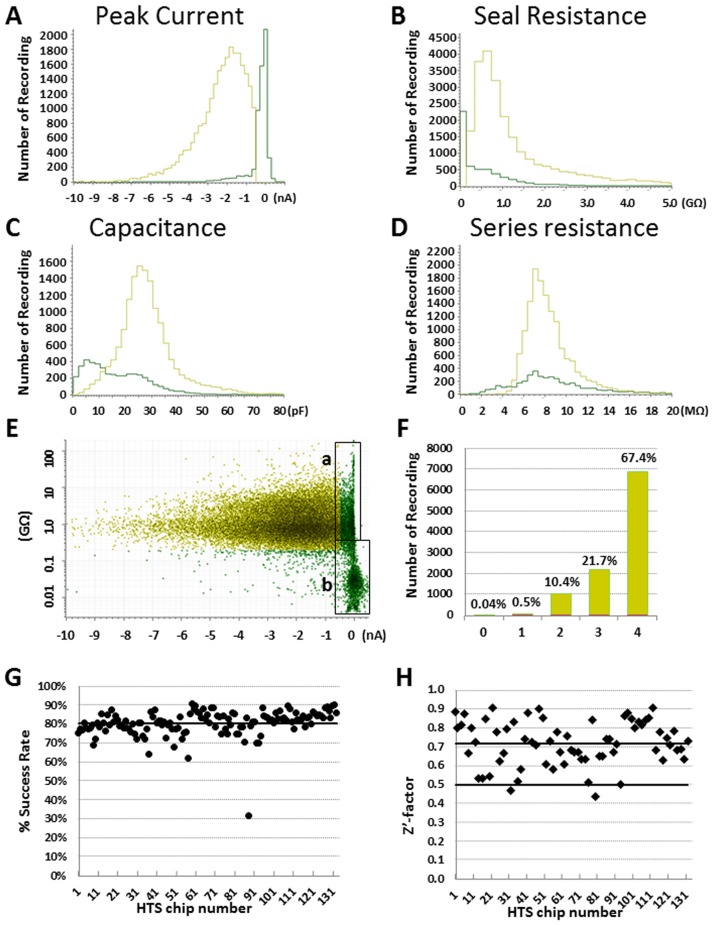
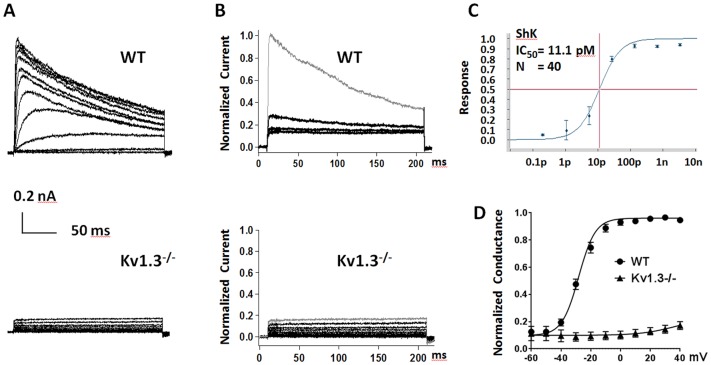
Ion channels regulate a variety of physiological processes and represent an important class of drug target. Among the many methods of studying ion channel function, patch clamp electrophysiology is considered the gold standard by providing the ultimate precision and flexibility. However, its utility in ion channel drug discovery is impeded by low throughput. Additionally, characterization of endogenous ion channels in primary cells remains technical challenging. In recent years, many automated patch clamp (APC) platforms have been developed to overcome these challenges, albeit with varying throughput, data quality and success rate. In this study, we utilized SyncroPatch 768PE, one of the latest generation APC platforms which conducts parallel recording from two-384 modules with giga-seal data quality, to push these 2 boundaries. By optimizing various cell patching parameters and a two-step voltage protocol, we developed a high throughput APC assay for the voltage-gated sodium channel Nav1.7. By testing a group of Nav1.7 reference compounds' IC50, this assay was proved to be highly consistent with manual patch clamp (R > 0.9). In a pilot screening of 10,000 compounds, the success rate, defined by > 500 MΩ seal resistance and >500 pA peak current, was 79%. The assay was robust with daily throughput ~ 6,000 data points and Z' factor 0.72. Using the same platform, we also successfully recorded endogenous voltage-gated potassium channel Kv1.3 in primary T cells. Together, our data suggest that SyncroPatch 768PE provides a powerful platform for ion channel research and drug discovery.


Conflict of interest statement

Competing Interests: All authors are paid employees of Genentech, Inc., which is the funder of the reported studies. This does not alter the authors' adherence to PLoS ONE policies on sharing data and materials.

Figures

Fig 1
Fig 1. Comparison of SyncroPatch APC and manual patch clamp (MPC) by characterizing Nav1.7, Nav1.5 and Kv1.3.
(A) Representative Nav1.7 current traces from APC. The currents were elicited by 20 ms test pulses (-80 to 40 mV in 5 mV increment) from a holding potential at -120 mV. (B) Overlay of Nav1.7 IV relationship curves from APC and MPC. The peaks of the IV from both systems were -10 mV. (C) Superimposition of steady-state activation and inactivation curves of Nav1.7 from APC and MPC. Inactivation currents were elicited by 20 ms test pulses at -10 mV, after 500 ms conditioning prepulses ranged from—120 to 0 mV with 5 mV increments. The smooth curves are Boltzmann fits with activation V½ and slope factors (k) from APC -27.3 ± 0.9 mV and 2.6 ± 0.2 mV/e-fold potential change; and from MPC -26.1 ± 1.6 mV and 2.4 ± 0.3 mV/e-fold potential change. For inactivation the V½ and k values are -69.4 ± 0.4 mV and 8.9 ± 0.3 mV/e-fold potential change from APC and -69.7 ± 0.7 mV and 8.3 ± 0.6 mV/e-fold potential change from MPC. (D) Peak current (elicited by -10 mV 20 ms) was plotted as a function of inter-stimulus interval (prepulse and holding Vm at -120mV) ranging from 1 ms to 1,000 ms, and fitted with one phase decay exponential equation to obtain the recovery time constant, τ = 1.85 ± 0.1 and 3.65 ± 0.2 ms from APC and MPC, respectively. (E) Representative Nav1.5 current traces from APC. (F) Superimposition of Nav1.5 steady-state activation and inactivation curves from APC and MPC. The smooth curves are Boltzmann fits with activation V½ and slope factors (k) are -50.3 ± 0.5 mV and 2.7 ± 1.0 mV/e-fold potential change from APC; and are -50.1 ± 0.4 mV and 3.5 ± 0.5 mV/e-fold potential change from MPC. For inactivation the V½ and k values are -72 ± 0.4 mV and 5.9 ± 0.4 mV/e-fold potential change from APC; and are -73.5 ± 0.7 mV and 5.8 ± 0.6 mV/e-fold potential change from MPC. (G) Representative Kv1.3 current traces from APC. (H) Superimposition of Kv1.3 steady-state activation and inactivation curves from APC and MPC. The smooth curves are Boltzmann fits with activation V½ and slope factors (k) are -27.9 ± 1.0 mV and 8.5 ± 0.4 mV/e-fold potential change from APC; and are -29.4 ± 1.6 mV and 7.9 ± 1.4 mV/e-fold potential change from MPC. For inactivation the V½ and k values are -44.5 ± 0.5 mV and 4.1 ± 0.4 mV/e-fold potential change from APC; and are -45.2 ± 0.5 mV and 4.2 ± 0.4 mV/e-fold potential change from MPC. Note that all normalized data were shown as mean ± SEM, with data points in APC n = 290 ~ 384 and MPC n = 4 ~ 10.
Fig 2
Fig 2. SyncroPatch cell patching success rate optimization.
(A) Cell harvesting with accutase brought better cell catching rate than Trypsin, and 1 time cell washing with PBS significantly improved cell catching rate; (B) Increasing Cell number up to 2000 per well reached the best cell catching rate; (C) The best cell membrane breaking-in pressure for our tested Nav1.7 and Nav1.5 cell lines were at -250 mBar; (D) The distribution of RSEAL from optimized Nav1.7 and Nav1.5 recordings; (E) Under optimized cell patching parameters, SyncroPatch CHO-Nav1.7 and CHL-Nav1.5 cell patching success rate by each criterion and all criteria. Note that all comparison experiments were done by fixing other parameters at the optimized condition and varying the experimental parameter only; (F) Under optimized APC parameters, voltage gated sodium current recording success rate from Nav1.1, Nav1.2, Nav1.3, Nav1.4, Nav1.5, Nav1.6, Nav1.7 and NG108-15 cell line was 66%, 51%, 54%, 82%, 75%, 59%, 79% and 35%, respectively; (G) A representative SyncroPatch recording of CHO-Nav1.7 (left half chip) and CHL-Nav1.5 (right half chip) in a 384 well chip. The RSEAL in each well was indicated as less than 200 MΩ in gray, between 200 MΩ and 1 GΩ in blue, and bigger than 1 GΩ in green by using SyncroPatch PatchControl software; All data shown as mean ± SD, with data points in SyncroPatch n = 200~384.
Fig 3
Fig 3. SyncroPatch Nav1.7 recording from optimized conditions with two-state voltage protocol.
(A) Voltage protocol to elicit Nav1.7 currents from closed (-120 mV) and inactivated (-40 mV) states. (B) Representative single sweep Nav1.7 current under described voltage protocol. The closed and inactivated state elicited peak currents were auto selected between red and green cursors. (C) The same representative recording current time plot shows steady closed state (dark blue) and inactivated state (light blue) peak currents through the whole experiment, including 3 times external solution washing (W1, W2 and W3) and 10 mins after applying 0.2% DMSO external solution.
Fig 4
Fig 4. SyncroPatch hNav1.7 dose response study by using multiple and single concentration per well methods.
(A) Chamber configuration and compound solution addition and removal to achieve increasing compound concentrations in a single well. (B) Representative Nav1.7 current traces from closed and inactivated states at before (highlighted) and after sequential increasing Tetrodotoxin (TTX) concentrations from 0, 0.1, 1.5, 4, 20, 56 to 250 nM. (C) The same representative recording peak current time plot shows Nav1.7 closed state (dark blue) and inactivated state (light blue) inhibition by increasing concentration of TTX, with TTX concentration changes indicated by background colors. (D) TTX dose–response curves for Nav1.7 closed state (dark blue) and inactivated state (light blue) using 6 concentrations per well protocol. (E) (F) Same experiment as (C) (D) by using single dose per well protocol.
Fig 5
Fig 5. Dose response of reference sodium channel blockers on hNav1.7.
Data were obtained using SyncroPatch multiple concentration per well method. (A-H) Amitriptyline, Carbamazepine, Flecainide, Lamotrigine, Mexiletine, Tetracaine, CNV1014802 and GX-936 respectively. IC50 at closed state (IC50c, bold line) and inactivated state (IC50i, thin line) were calculated by fitting to four-parameter Hill equation; all data shown as mean (n = 12~24).
Fig 6
Fig 6. Quality analysis of 10,000 compounds Nav1.7 pilot screening.
Total 42,272 data points were analyzed, including n = 4 for each compound and 0.2% DMSO negative controls. Each parameter’s binned mean values were plotted with frequency N numbers in histograms for (A) peak current, (B) seal resistance, (C) capacitance, (D) series resistance. In each graph, yellow color line represents QC passed tests, and green color line represents QC failed tests by all criteria; (E) Scatter plot of baseline signal and seal resistance of each recording. Green color data points are QC failed recordings from all criteria. Box (a) shows data failed by peak current criterion due to low Nav1.7 expression. Box (b) shows data failed by both peak current and seal resistance criteria. (F) Histogram of compounds with 0 to 4 valid data points from 4 repeats. The percentage of having 4, 3, 2, 1, and 0 QC passed recordings were 67.4%, 21.7%, 10.4%, 0.5% and 0.04%, respectively. (G) Scatter plot of percentage success rate for each chip, and the median success rate 79% is indicated with a solid line. (H) Scatter plot of Z’-factor for each chip with DMSO controls. The median Z’-factor is indicated by a solid black line at 0.72.
Fig 7
Fig 7. SyncroPatch APC endogenous voltage-gated potassium channel Kv1.3 from primary T cells.
(A) Representative Kv1.3 currents from WT and Kcna3-/- T cells. Currents were elicited by depolarizing voltage steps from −60 mV to +40 mV (10 mV increments, with −80 mV membrane holding potential) every 30 seconds; (B) Normalized WT and Kcna3-/- T cell K+ currents from before (gray) and after Shk 1nM inhibition (black). 89% WT T cell K+ current was blocked by Shk 1nM, and no Shk sensitive current was detected in Kcna3-/- T cells; (C) Dose response curve for Kv1.3 inhibition by ShK, with IC50 = 11.1pM. Data was generated using SyncroPatch APC platform with n = 40; (D) The conductance-voltage curves from WT and Kcna3-/- T cells were fitted with Boltzmann function and the V½ act. -28.1±1 mV was detected from WT T cells. Data are presented as the means ± SEM, with WT T cells (black dot) n = 40 and Kcna3-/- T cells (black triangle) n = 50.

References

    1. Overington JP, Al-Lazikani B, Hopkins AL. How many drug targets are there? Nat Rev Drug Discov 2006;5:993–6. doi: 10.1038/nrd2199 - DOI - PubMed
    1. Cox JJ, Reimann F, Nicholas AK, Thornton G, Roberts E, Springell K, et al. An SCN9A channelopathy causes congenital inability to experience pain. Nature 2006;444:894–8. doi: 10.1038/nature05413 - DOI - PMC - PubMed
    1. Dib-Hajj SD, Yang Y, Black J a, Waxman SG. The Na(V)1.7 sodium channel: from molecule to man. Nat Rev Neurosci 2013;14:49–62. doi: 10.1038/nrn3404 - DOI - PubMed
    1. Fertleman CR, Baker MD, Parker KA, Moffatt S, Elmslie F V., Abrahamsen B, et al. SCN9A Mutations in Paroxysmal Extreme Pain Disorder: Allelic Variants Underlie Distinct Channel Defects and Phenotypes. Neuron 2006;52:767–74. doi: 10.1016/j.neuron.2006.10.006 - DOI - PubMed
    1. Estacion M, Harty TP, Choi JS, Tyrrell L, Dib-Hajj SD, Waxman SG. A sodium channel gene SCN9A polymorphism that increases nociceptor excitability. Ann Neurol 2009;66:862–6. doi: 10.1002/ana.21895 - DOI - PubMed

MeSH terms

Substances

LinkOut - more resources