. 2017 Jul 5;26(1):243-255.e6.
doi: 10.1016/j.cmet.2017.06.002.

CRY1/2 Selectively Repress PPARδ and Limit Exercise Capacity

Affiliations

CRY1/2 Selectively Repress PPARδ and Limit Exercise Capacity

Sabine D Jordan et al. Cell Metab. .

Abstract

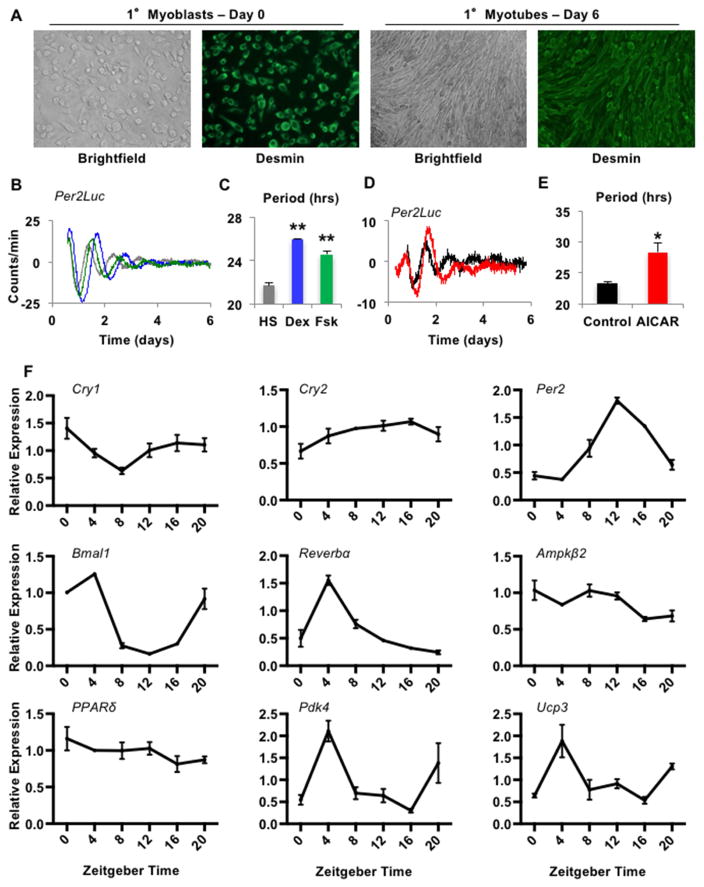
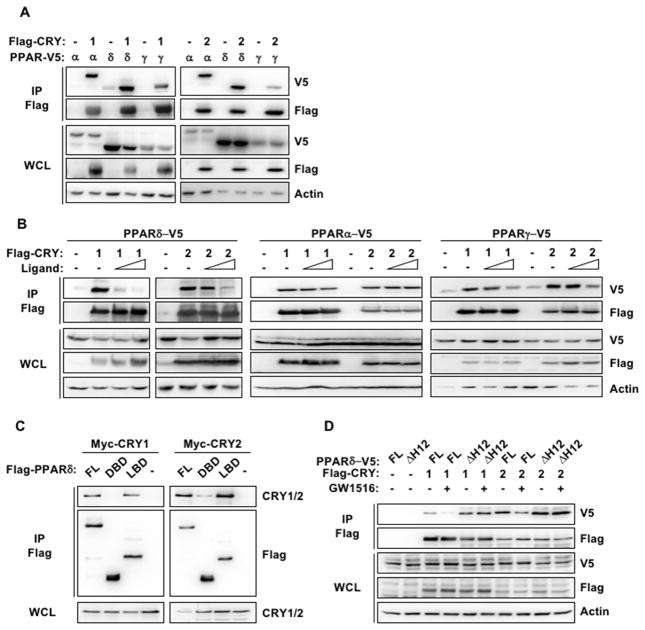
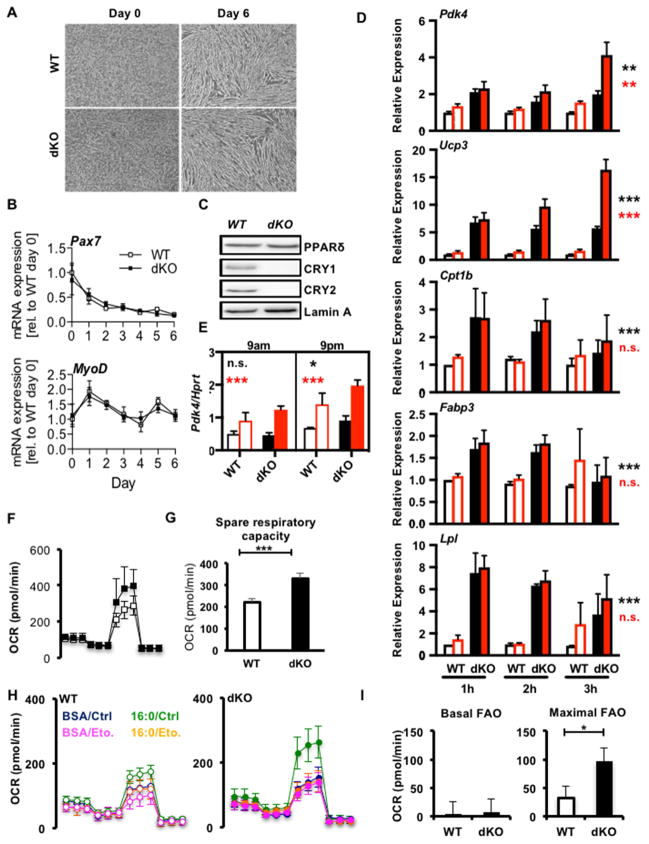
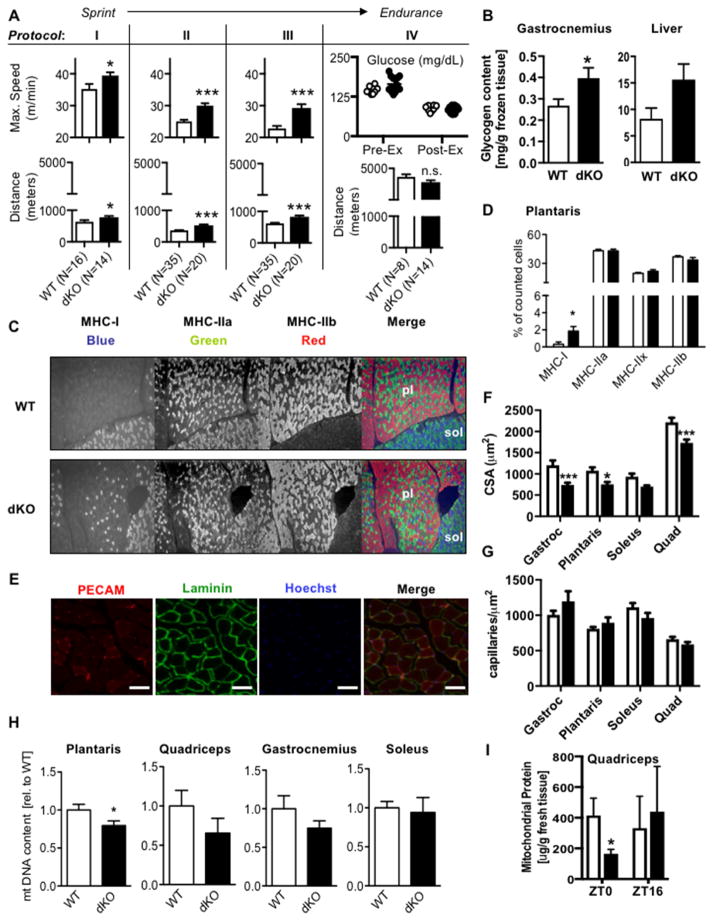
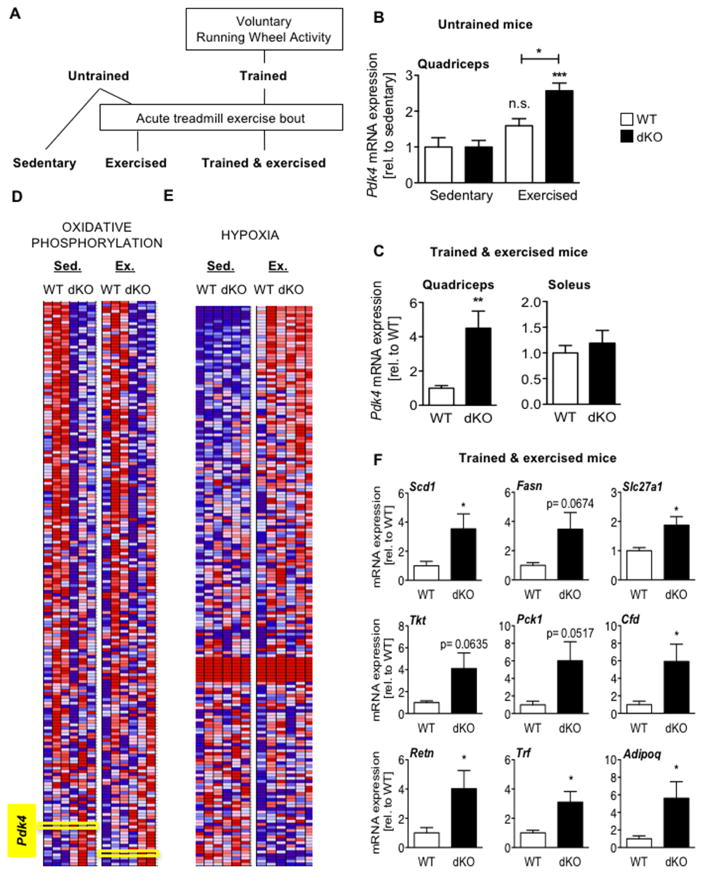
Cellular metabolite balance and mitochondrial function are under circadian control, but the pathways connecting the molecular clock to these functions are unclear. Peroxisome proliferator-activated receptor delta (PPARδ) enables preferential utilization of lipids as fuel during exercise and is a major driver of exercise endurance. We show here that the circadian repressors CRY1 and CRY2 function as co-repressors for PPARδ. Cry1-/-;Cry2-/- myotubes and muscles exhibit elevated expression of PPARδ target genes, particularly in the context of exercise. Notably, CRY1/2 seem to repress a distinct subset of PPARδ target genes in muscle compared to the co-repressor NCOR1. In vivo, genetic disruption of Cry1 and Cry2 enhances sprint exercise performance in mice. Collectively, our data demonstrate that CRY1 and CRY2 modulate exercise physiology by altering the activity of several transcription factors, including CLOCK/BMAL1 and PPARδ, and thereby alter energy storage and substrate selection for energy production.

Keywords: CRY1; CRY2; PPAR; beta oxidation; circadian; clock; cryptochrome; exercise; muscle; sprint.


Figures

Figure 1
Figure 1. Muscle cell clocks are influenced by AMPK activation. See also Figure S1
(A) Representative images of myoblasts (MBs) and myotubes (MTs). (B,D) Luciferase activity in Per2Luc MTs stimulated with horse serum (HS, grey), dexamethasone (Dex, blue) or forskolin (Fsk, green) (B) or in the absence (black) or presence (red) of AICAR after dexamethasone (D). (C,E) Average period of rhythms measured as in (B,D). (F) Expression of the indicated transcripts measured by quantitative PCR (qPCR) in quadriceps collected at the indicated zeitgeber times (time after lights on, ZT), normalized to Hprt. (C,E) show mean ± s.e.m. for 4–8 samples per group. *p ≤ 0.05, ** p ≤ 0.01. (F) shows mean ± s.e.m. for 3 samples per condition, each measured in triplicate.
Figure 2
Figure 2. Cryptochromes exhibit co-repressor-like interactions with PPARδ
Proteins detected by immunoblot (IB) following FLAG IP from lysates of 293T cells expressing the indicated plasmids and treated with PPAR ligands or vehicle (-). WCL whole cell lysate, FL full length PPARδ, DBD DNA binding domain, LBD ligand binding domain, ΔH12 helix 12 deleted.
Figure 3
Figure 3. Cryptochromes suppress PPARδ in a cell-intrinsic manner. See also Figure S2
(A) Representative images of MBs differentiated into MTs. (B,D,E) Relative expression of indicated transcripts in WT (open symbols) or dKO (filled symbols) cells during differentiation (B) or after treatment with vehicle (DMSO, black) or 100nM GW1516 (GW, red) (D) or at the indicated times, 3 hours after treatment with vehicle (DMSO, black) or GW (red) following three days of stimulation with AICAR at 9am (E). Data represent mean ± s.e.m of experimental triplicates. (C) Proteins detected by IB in nuclear extracts from MTs of indicated genotypes. (F) Oxygen consumption rate (OCR) in MTs treated sequentially with oligomycin (oligo), FCCP, and rotenone+antimycin A (R/AA). (G) Spare respiratory capacity calculated from (F). (H) OCR in WT (left) and dKO (right) MTs in the presence or absence of exogenous palmitate (16:0) and etomoxir (Eto.). (I) Fatty acid oxidation (FAO) calculated from (H). Data represent mean ± s.e.m of three experiments each done in triplicate (D), or 3, 15 or 6–9 replicates in a representative experiment (E, F–G, or H–I). *p ≤ 0.05, ** p ≤ 0.01, ***p ≤ 0.001 by 2-way (D) or 3-way (E) ANOVA or t-test (G, I). In (D,E) black and red asterisks represent effects of genotype or treatment respectively.
Figure 4
Figure 4. Deletion of Cry1 and Cry2 increases exercise capacity. See also Figures S3 and S4
(A) Maximum speed or initial and final blood glucose (top) and total distance (bottom) in male mice. (B) Glycogen content in gastrocnemius and liver (N=5 each). (C) Representative plantaris (pl) and soleus (sol) muscle staining. (D) Quantification of fiber types in plantaris (N=7 each). (E) Representative vasculature stains. Scale bars, 50 μm. (F,G) Quantification of fiber cross-sectional area (CSA, F) and capillary density (G) (N=3 mice each, five sections per mouse). (H) Relative amount of mitochondrial DNA in the indicated muscles (N=7–18). (I) Protein content in isolated mitochondria relative to tissue weight in quadriceps (N=3 each). Data represent mean ± s.e.m. * P < 0.05, *** P < 0.001 vs. WT by t-test.
Figure 5
Figure 5. Cryptochromes limit exercise-induced activation of PPARδ. See also Figure S5
(A) Experimental flow chart. (B,C,F) Expression of indicated transcripts in quadriceps of untrained sedentary or exercised mice (N=7–8 each). n.s. not significant, *p ≤ 0.05, ***p ≤ 0.001 vs sedentary control or as indicated. (C) Pdk4 expression in the indicated muscle groups of trained mice after exercise. Data represent mean ± s.e.m of 7–8 mice per genotype. **p ≤ 0.01 vs WT. (D–E) Heat maps showing relative expression (red high, blue low) detected by deep sequencing of RNA isolated from mice as described in (B). (F) Relative expression in quadriceps of trained mice after exercise. Data represent mean ± s.e.m of 7–8 mice per genotype. *p ≤ 0.05 vs WT.

References

    1. Abe T, Kitaoka Y, Kikuchi DM, Takeda K, Numata O, Takemasa T. High-intensity interval training-induced metabolic adaptation coupled with an increase in Hif-1alpha and glycolytic protein expression. Journal of applied physiology. 2015;119:1297–1302. - PubMed
    1. Adamovich Y, Ladeuix B, Golik M, Koeners MP, Asher G. Rhythmic Oxygen Levels Reset Circadian Clocks through HIF1alpha. Cell metabolism. 2017;25:93–101. - PubMed
    1. Ahmadian M, Suh JM, Hah N, Liddle C, Atkins AR, Downes M, Evans RM. PPARgamma signaling and metabolism: the good, the bad and the future. Nature medicine. 2013;19:557–566. - PMC - PubMed
    1. Andrews JL, Zhang X, McCarthy JJ, McDearmon EL, Hornberger TA, Russell B, Campbell KS, Arbogast S, Reid MB, Walker JR, et al. CLOCK and BMAL1 regulate MyoD and are necessary for maintenance of skeletal muscle phenotype and function. Proceedings of the National Academy of Sciences of the United States of America. 2010;107:19090–19095. - PMC - PubMed
    1. Bae K, Lee K, Seo Y, Lee H, Kim D, Choi I. Differential effects of two period genes on the physiology and proteomic profiles of mouse anterior tibialis muscles. Molecules and cells. 2006;22:275–284. - PubMed