. 2017 Jul 5;26(1):267-277.e2.
doi: 10.1016/j.cmet.2017.06.007.

Mice under Caloric Restriction Self-Impose a Temporal Restriction of Food Intake as Revealed by an Automated Feeder System

Affiliations

Mice under Caloric Restriction Self-Impose a Temporal Restriction of Food Intake as Revealed by an Automated Feeder System

Victoria A Acosta-Rodríguez et al. Cell Metab. .

Abstract

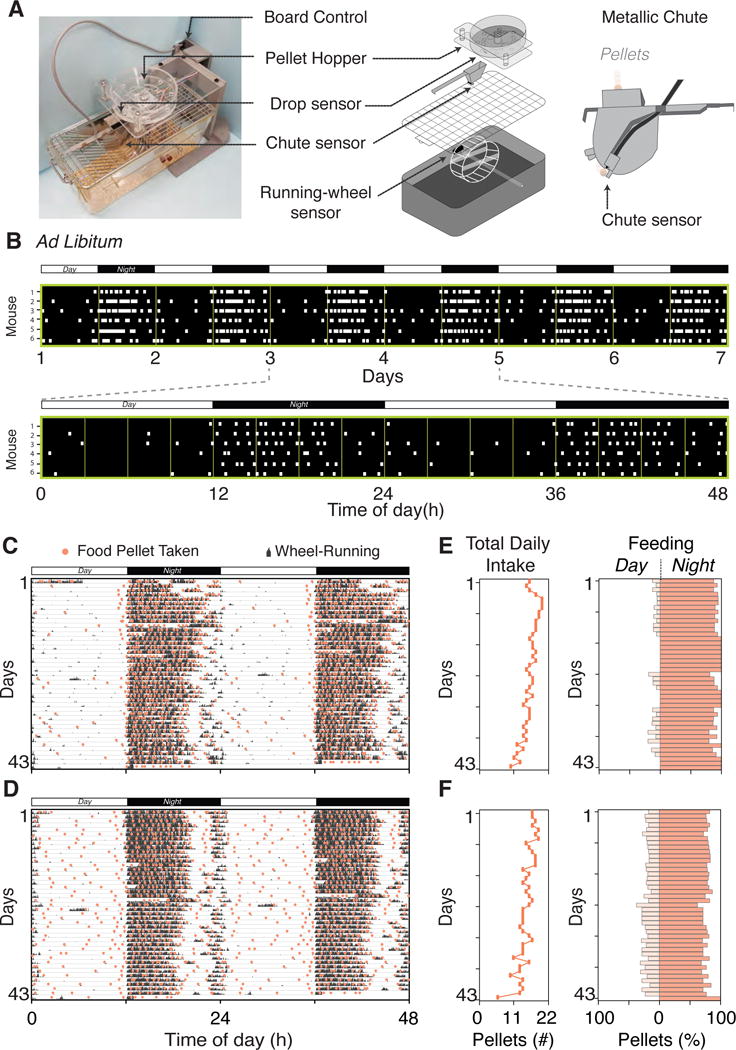
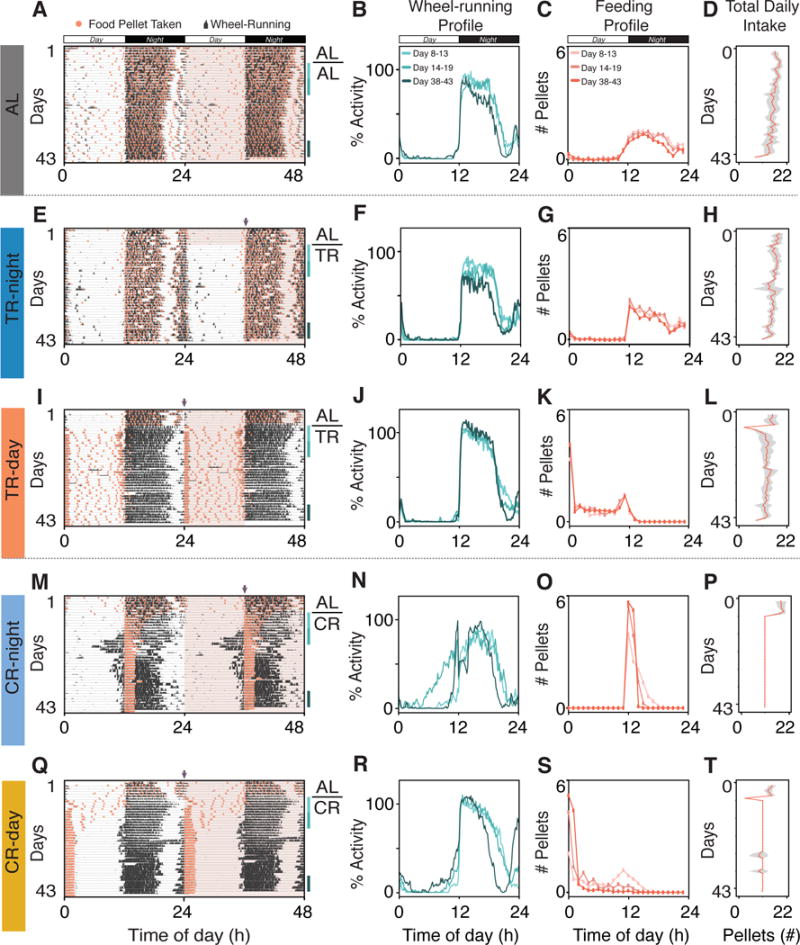
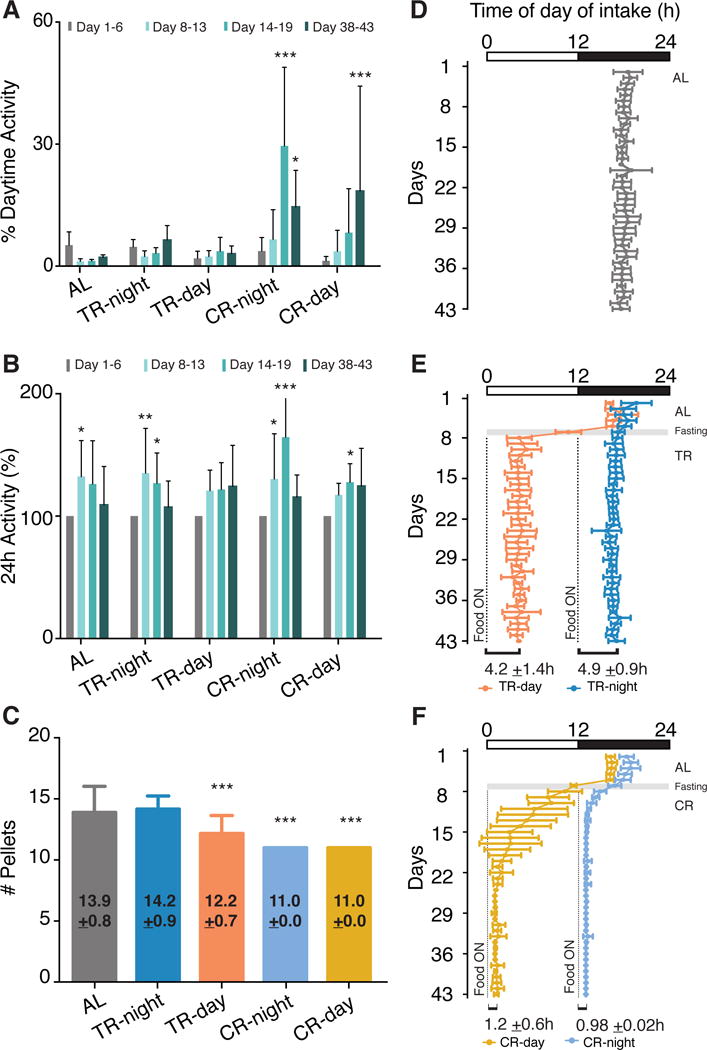
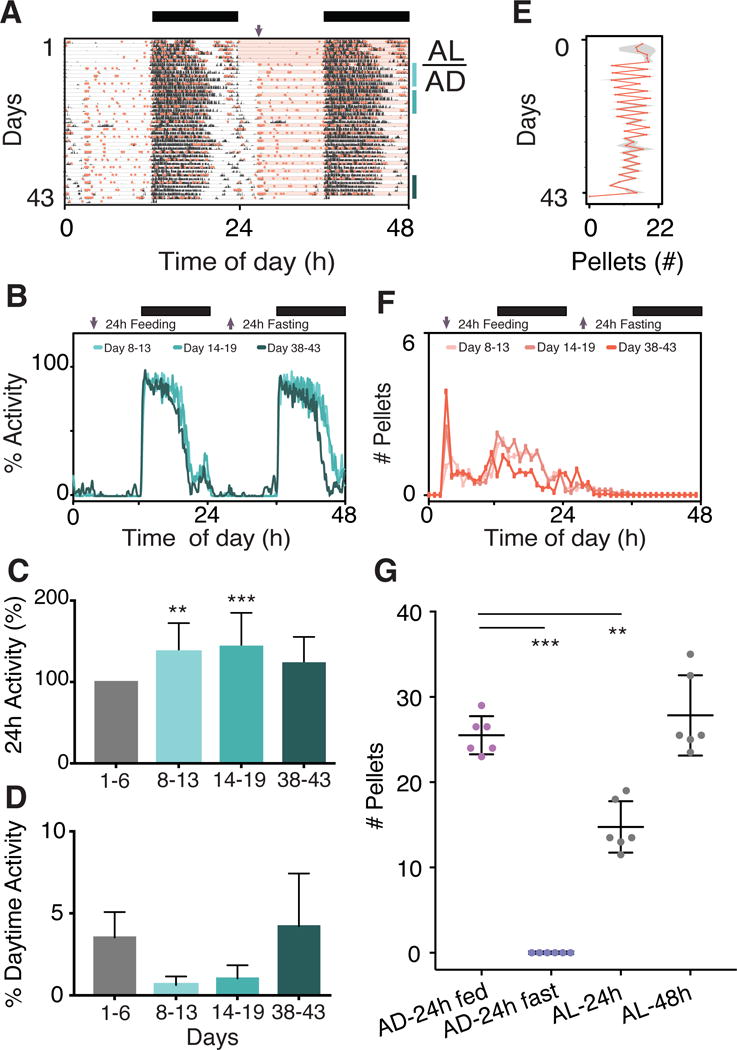
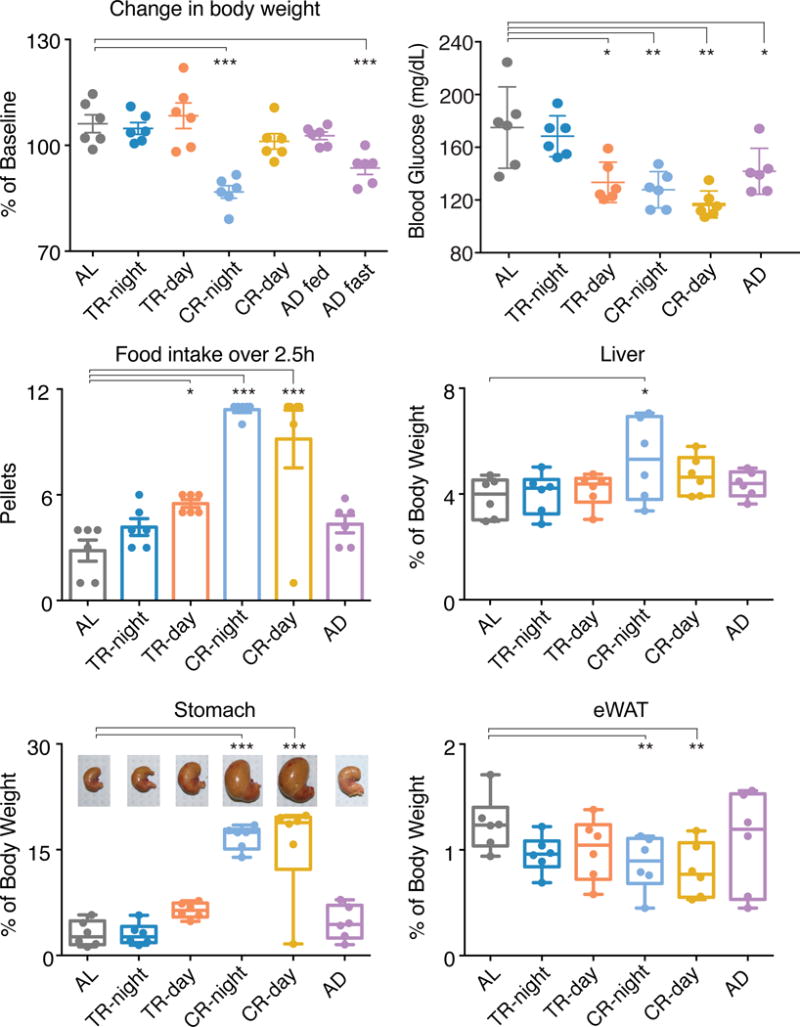
Caloric restriction (CR) extends lifespan in mammals, yet the mechanisms underlying its beneficial effects remain unknown. The manner in which CR has been implemented in longevity experiments is variable, with both timing and frequency of meals constrained by work schedules. It is commonplace to find that nocturnal rodents are fed during the daytime and meals are spaced out, introducing prolonged fasting intervals. Since implementation of feeding paradigms over the lifetime is logistically difficult, automation is critical, but existing systems are expensive and not amenable to scale. We have developed a system that controls duration, amount, and timing of food availability and records feeding and voluntary wheel-running activity in mice. Using this system, mice were exposed to temporal or caloric restriction protocols. Mice under CR self-imposed a temporal component by consolidating food intake and unexpectedly increasing wheel-running activity during the rest phase, revealing previously unrecognized relationships among feeding, metabolism, and behavior.

Keywords: alternate day feeding; automated feeder system; body weight; caloric restriction; circadian rhythm; feeding pattern; intermittent fasting; mouse; temporal restriction; wheel-running activity.


Figures

Figure 1
Figure 1. Automated Feeder System Reveals Individual Differences in Ingestive Behavior Patterns
(A) Automated feeder unit that simultaneously monitors wheel-running and feeding behavior aided by sensors. (B) Real-time pellet consumption recordings for C57BL/6J mice (n=6) fed ad libitum over 6 days (upper panel) or 2 days (bottom panel). White squares indicate a single pellet taken (0.315g/pellet, 3.35Kcal/g of diet). Note: mouse #5 is also shown in (C and E); whereas mouse #4 is also shown in (D and F). (C–D) Double plotted actograms overlaying wheel-running (black histograms) and feeding (pink dots) behaviors. Isogenic C57BL/6J mice consume less (C) or more (D) pellets during the rest phase even under ad libitum food access. See more examples in Figure S3A. (E–F) Total food intake (left panel) and day/night feeding distribution (right panel). Despite similarities in the total intake, one mouse consumes ~7% (E), whereas the other consumes ~23% (F) during the daytime. Bar across the top of the graph indicates the light/dark cycle.
Figure 2
Figure 2. Imposed Feeding Paradigms Alter Wheel-Running Activity, Food Intake Patterns and Total Food Consumption
Behavioral recording and quantification of food intake and wheel running for C57BL/6J mice. Each row represents one feeding condition programmed after one week of baseline recording under ad libitum feeding: (A–D) AL: ad libitum. (E–H) TR-night: 12h food access during the night. (I–L) TR-day: 12h food access during the day. (M–P) CR-night: 30% caloric restriction with 24h food access starting at the beginning of the night. (Q–T) CR-day: 30% caloric restriction with 24h food access starting at the beginning of the day. From left to right, each column shows the following mouse behavior parameters: (First column) Representative double-plotted actograms. Pink shading represents time of food availability and purple arrows indicate food onset. Bars on right side show recording days used for analysis; from 8 to 13 (light blue), 14 to 19 (aqua) and 38 to 43 (dark green), respectively. The LD cycle is shown in the bar across the top. (Second column) Average 24h wheel-running activity profiles, normalized to maximum wheel counts recorded during baseline (n=6). CR increases daytime activity. The LD cycle is shown in the bar across the top. (Third column) Average 24h pattern of food intake (n=6). TR-night resembles AL intake pattern, whereas TR-day condition shows bimodal distribution of food intake during the daytime. CR condition results in consolidation of food intake to within 2h regardless of time of day food is presented. The LD cycle is shown in the bar across the top. Each pellet weighs 0.315g with energy intake equal to 3.35Kcal/g of diet. (Fourth column) Total daily intake per group (n=6; Shading represents ± SD). See also data for individual mice plotted in Figures S3A–S3E and S4A–S4E.
Figure 3
Figure 3. The Timing and Amount of Food Intake and Wheel-Running Activity is Influenced by Imposed Feeding Paradigm
(A) Percentage of wheel-running activity occurring in the light is increased in both CR conditions. Significant difference from baseline condition (gray bar) is determined by ANOVA with Bonferroni’s correction where * p < 0.05, ** p < 0.01, and *** p < 0.001. Data are represented as mean ± SD (n=6). (B) Total wheel-running activity increases transiently over the course of the experiment for all mice except those in TR-day. Activity is normalized to total activity recorded during baseline (gray) for each feeding condition. Significant difference from AL condition (gray bar) is determined by ANOVA with Bonferroni’s correction where * p < 0.05, ** p < 0.01, and *** p < 0.001. Data are represented as mean ± SD (n=6). (C) Total amount of pellets consumed per day for mice in each of the feeding conditions during the last week of recording. TR leads to a decrease in total pellet consumption only when restricted to the day. Significant difference from AL condition (gray bar) is determined by ANOVA with Bonferroni’s correction where *** p < 0.001. Data are represented as mean ± SD (n=6). (D–F) Time required to consume 50% of total daily food intake for mice with free food availability for 1 week followed by: (D) AL; (E) TR; (F) CR. TR-day mice rapidly shift ingestive behavior according to the imposed feeding schedule. CR mice shorten their food intake to within the first hour after food on. Notably, CR-day (light orange) fed mice take longer to consolidate their intake than CR-night (light blue). Gray shading indicates 12h fasting prior to the temporal restriction paradigm. Dotted line denotes the time at which the food is made available. Bar across top indicates LD cycle. Data are represented as mean ± SD (n=6).
Figure 4
Figure 4. Food Intake and Wheel-Running Activity in Mice Provided with an Alternate Day (AD) Feeding
(A) Representative double-plotted actogram of a mouse in the AD condition. Pink shading represents time of food availability and purple arrows indicate food onset. Bars on right side show recording days used for analysis; from 8 to 13 (light-blue), 14 to 19 (aqua) and 38 to 43 (dark green), respectively. The LD cycle is shown in the bar across the top. (B) Average 48h wheel-running activity profiles, normalized to maximum wheel counts recorded during baseline (n=6). The graph is plotted over 48 hours showing both the feeding (left) and fasting (right) days, with increased activity duration on fasting days. Arrows indicate food on and food off. The LD cycle is shown in the bar across the top. (C) Total activity increases transiently over the course of the experiment for AD fed mice. Activity is normalized to total activity recorded during baseline (gray). Significant difference from baseline (gray bar) is determined by ANOVA with Bonferroni’s correction where ** p < 0.01, and *** p < 0.001. Data are represented as mean ± SD (n=6). (D) AD condition does not alter percentage of wheel-running activity occurring in the light. Significant difference from baseline condition (gray bar) is determined by ANOVA with Bonferroni’s correction where * p < 0.05, ** p < 0.01, and *** p < 0.001. Data are represented as mean ± SD (n=6). (E) The mean total pellets (± SD) consumed per day by mice in the AD condition (n=6). Fluctuations in number of pellets taken per day reflect fasting versus feeding days, although feeding windows span two 24h periods. Each pellet weighs 0.315g with energy intake equal to 3.35Kcal/g of diet. (F) Average 48h pattern of food intake for AD mice (n=6) shows a sharp peak of food intake once food becomes available on feeding day. The graph is plotted over 48 hours showing both the feeding (left) and fasting (right) days. Arrows indicate food on and food off. The LD cycle is shown in the bar across the top. (G) In 24h of food access, AD mice consume as much food as AL mice do over 48h. Significant difference determined by ANOVA with Bonferroni’s correction with *** p < 0.001. Data are represented as mean ± SD (n=6). See also data for individual mice plotted in Figures S3F and S4F.
Figure 5
Figure 5. Effects of Imposed Feeding Condition on Body Weight, Blood Glucose Level, Acute Food Intake and Peripheral Tissues
(A) CR during the night decreases body weight, whereas CR during the day does not. Mice in the AD conditions were weighed on two consecutive days – fed and fasted, showing alternate days of weight gain and loss. (B) Blood glucose levels are lower for mice with reduced food intake. An average of glucose levels measured at 4 time points for each mouse was used to determine the mean (± SD) per feeding condition (n=6). (C) Mice in the CR condition consume significantly more food within the first 2.5h of food availability on the final day of the experiment. This correlates with the pattern of food consumption shown in Figure 2 -third column. With 0.315g/pellet and 3.35Kcal/g of diet, 11 pellets are equivalent to 11 Kcal. See also Figure S5D. (D–F) Liver (D), stomach (E) and eWAT (F) weights as a percentage of total body weight measured for mice in each of the feeding conditions. Pictures of stomachs from representative mice are shown. See also Figure S5D for stomach size at the time of tissue collection. Significant difference from AL condition (gray) is determined by ANOVA with Bonferroni’s correction where * p < 0.05, ** p < 0.01, and *** p < 0.001. Data are represented as mean ± SD (n=6).

References

    1. Adamovich Y, Rousso-Noori L, Zwighaft Z, Neufeld-Cohen A, Golik M, Kraut-Cohen J, Wang M, Han X, Asher G. Circadian clocks and feeding time regulate the oscillations and levels of hepatic triglycerides. Cell Metab. 2014;19:319–330. - PMC - PubMed
    1. Anson RM, Guo Z, de Cabo R, Iyun T, Rios M, Hagepanos A, Ingram DK, Lane MA, Mattson MP. Intermittent fasting dissociates beneficial effects of dietary restriction on glucose metabolism and neuronal resistance to injury from calorie intake. Proc Natl Acad Sci U S A. 2003;100:6216–6220. - PMC - PubMed
    1. Anson RM, Jones B, de Cabod R. The diet restriction paradigm: a brief review of the effects of every-other-day feeding. Age (Dordr) 2005;27:17–25. - PMC - PubMed
    1. Arble DM, Bass J, Laposky AD, Vitaterna MH, Turek FW. Circadian timing of food intake contributes to weight gain. Obesity (Silver Spring) 2009;17:2100–2102. - PMC - PubMed
    1. Chaix A, Zarrinpar A, Miu P, Panda S. Time-restricted feeding is a preventative and therapeutic intervention against diverse nutritional challenges. Cell Metab. 2014;20:991–1005. - PMC - PubMed