. 2017 Jul 5;20(1):76-88.
doi: 10.1016/j.celrep.2017.06.023.

Silent Allosteric Modulation of mGluR5 Maintains Glutamate Signaling while Rescuing Alzheimer's Mouse Phenotypes

Affiliations

Silent Allosteric Modulation of mGluR5 Maintains Glutamate Signaling while Rescuing Alzheimer's Mouse Phenotypes

Laura T Haas et al. Cell Rep. .

Abstract

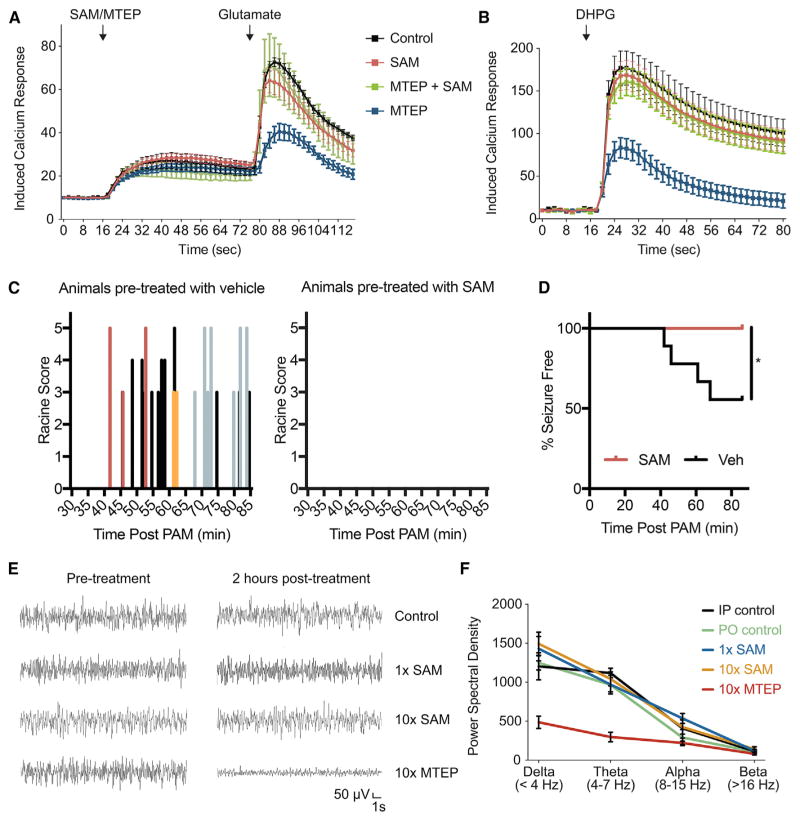
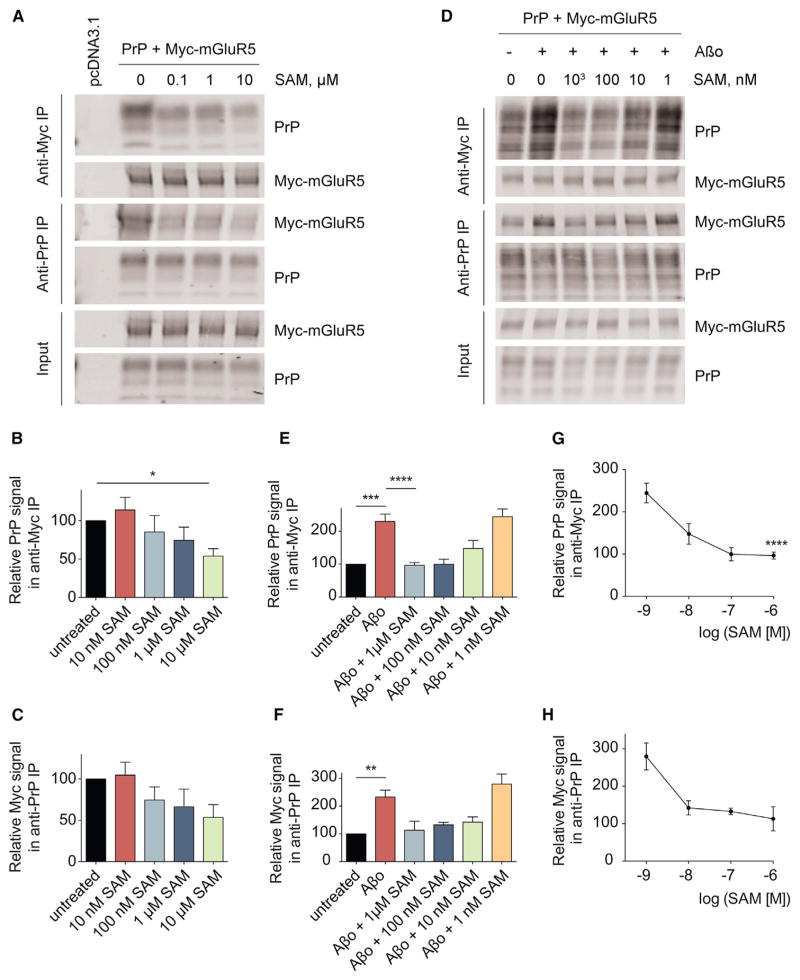
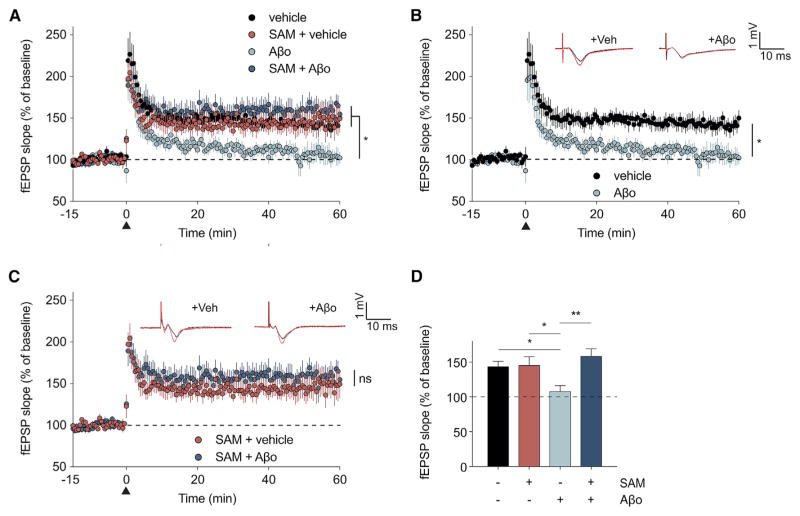
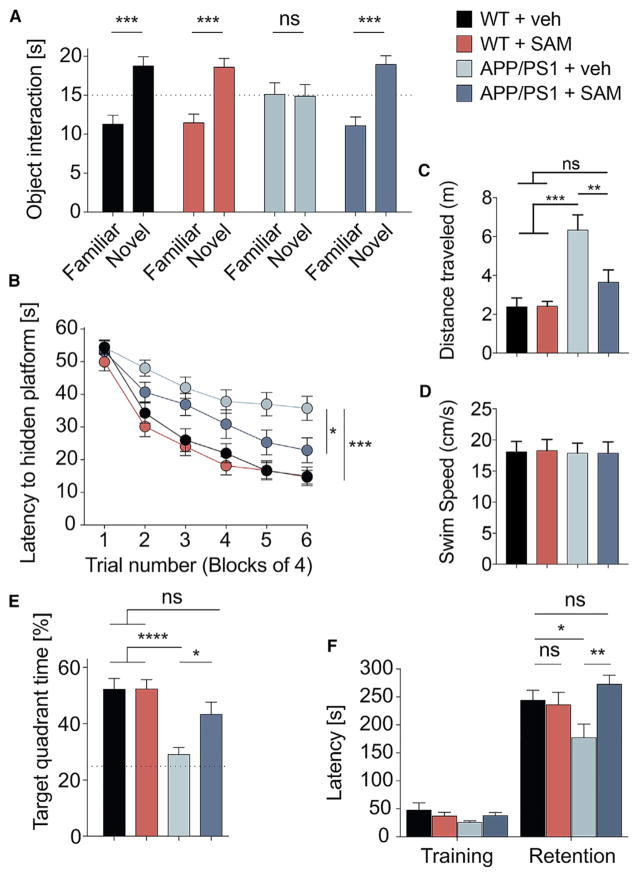
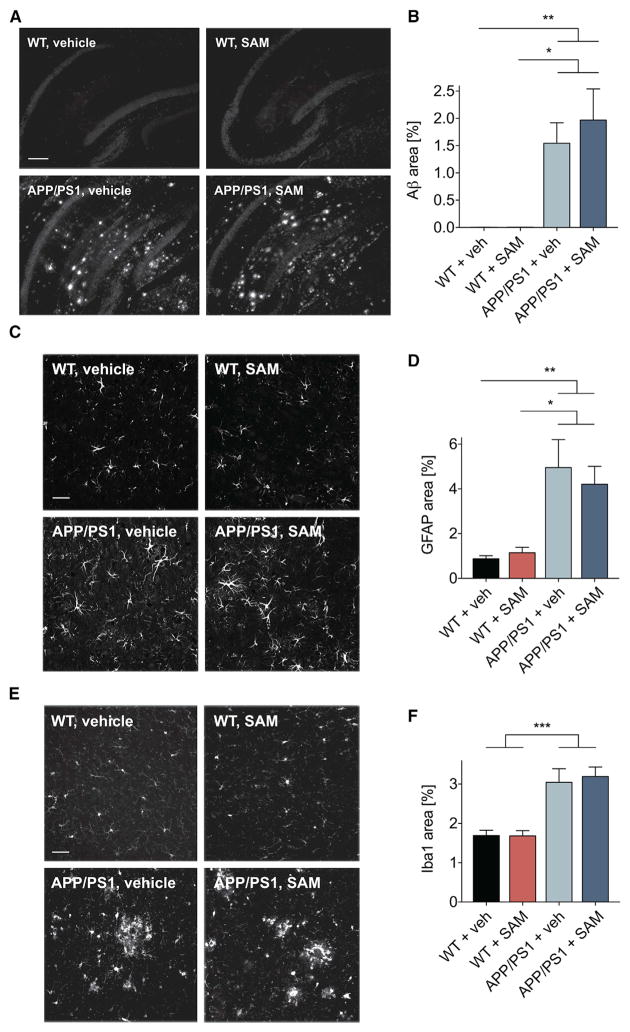
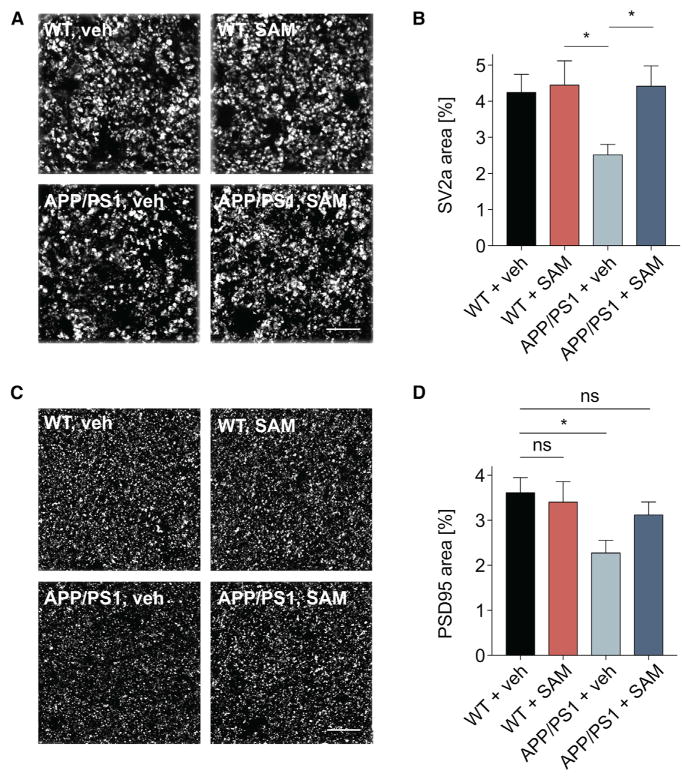
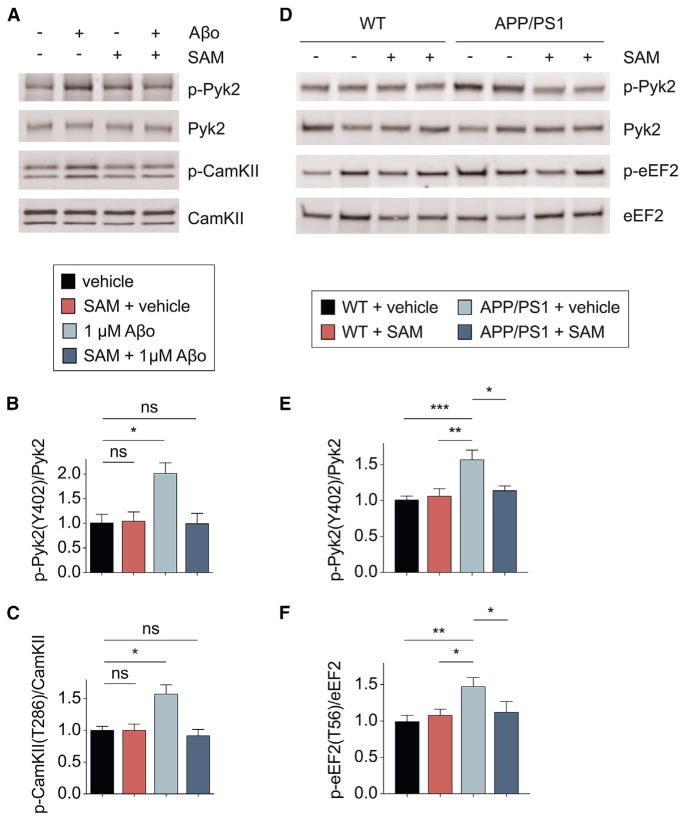
Metabotropic glutamate receptor 5 (mGluR5) has been implicated in Alzheimer's disease (AD) pathology. We sought to understand whether mGluR5's role in AD requires glutamate signaling. We used a potent mGluR5 silent allosteric modulator (SAM, BMS-984923) to separate its well-known physiological role in glutamate signaling from a pathological role in mediating amyloid-β oligomer (Aβo) action. Binding of the SAM to mGluR5 does not change glutamate signaling but strongly reduces mGluR5 interaction with cellular prion protein (PrPC) bound to Aβo. The SAM compound prevents Aβo-induced signal transduction in brain slices and in an AD transgenic mouse model, the APPswe/PS1ΔE9 strain. Critically, 4 weeks of SAM treatment rescues memory deficits and synaptic depletion in the APPswe/PS1ΔE9 transgenic mouse brain. Our data show that mGluR5's role in Aβo-dependent AD phenotypes is separate from its role in glutamate signaling and silent allosteric modulation of mGluR5 has promise as a disease-modifying AD intervention with a broad therapeutic window.

Keywords: Alzheimer; amyloid β; mGluR5; metabotropic glutamate receptor 5; oligomer; prion protein; silent allosteric modulator; transgenic mouse.


Figures

Figure 1
Figure 1. SAM BMS-984923 Does Not Interfere with Glutamate-Induced Calcium Signaling and Does Not Impair EEG Amplitude in Mice
(A) mGluR5-expressing HEK293T cells were incubated with a Ca2+-sensing dye and monitored by fluorometric imaging plate reader (FLIPR) calcium assay. Cells were treated with compounds after 16 s as indicated. After 76 s, 50 μM glutamate was added, and the change of intracellular Ca2+ concentration was recorded. Data are mean ± SEM from three individual experiments, where 15–17 wells of a 96-well plate were averaged per experiment. (B) DIV21 neurons were exposed to the SAM and/or MTEP for 20 min prior to recording the change of intracellular Ca2+ concentration in response to 50 μM DHPG at 18 s. Each line represents the induced mean ± SEM. The Ca2+ response was averaged from 18–20 wells of a 96-well plate. (C) Mice were treated with either 7.5 mg/kg SAM or vehicle by oral gavage 90 min prior to receiving 20 mg/kg PAM by intraperitoneal (i.p.) injection. Graphs depict the occurrence of seizure activity that scored 3 or greater on the Racine scale following PAM administration. Each group is comprised of eight animals, and differently colored lines represent different animals in the group. (D) Seizure-free survival of animals pretreated with either 7.5 mg/kg SAM or vehicle prior to receiving 20 mg/kg PAM by i.p. injection. A seizure event is defined as an episode scoring 3 or greater on the Racine scale (*p < 0.05 by log rank test). (E and F) Mice were treated with SAM/vehicle by oral gavage (PO) or MTEP/vehicle by i.p. injection. (E) Characteristic EEG traces reordered pre- and post-treatment. (F) Power spectral blot of EEG traces 2 hr after treatment. EEG waves are grouped into delta waves (<4 Hz), theta waves (4–7 Hz), alpha waves (8–15 Hz), and beta waves (>16 Hz). Two hours after receiving a 1 × (3.75 mg/kg) or 10 × (37.5 mg/kg) dose of the SAM, the EEG remained unchanged compared with vehicle-treated mice. Contrarily, 2 hr after receiving a 10 × dose of MTEP (75 mg/kg), the EEG amplitude in mice was strongly suppressed compared with vehicle-treated mice.
Figure 2
Figure 2. The SAM Reduces the Interaction of PrPC with mGluR5 in Membrane Fractions
(A) HEK293 cells were co-transfected with PrPC and Myc-mGluR5. Membrane fractions were prepared in the absence of detergent and incubated for 2 hr at 4°C with the indicated concentrations of the SAM. Membrane proteins were extracted by NP-40, and membrane extractions (input) and immunoprecipitates were immunoblotted with either anti-Myc or anti-PrPC. (B and C) Data are mean ± SEM from three independent experiments. (B) Quantification of the PrPC signal in anti-Myc immunoprecipitates after treatment is normalized to the signal of untreated samples. Co-immunoprecipitation of PrPC with Myc-mGluR5 is significantly reduced by 10 μM SAM (*p < 0.05 by one-way ANOVA with Fisher’s LSD post hoc pairwise comparisons). (C) Quantification of the Myc signal in anti-PrPC immunoprecipitates after treatment is normalized to the signal of untreated samples. (D) HEK293 cells were co-transfected with PrPC and Myc-mGluR5. Membrane fractions were pre-incubated for 2 hr at 4°C with the indicated concentrations of the SAM, followed by 1 μM Aβo for 30 min (monomer-equivalent concentration, estimated oligomer of 10 nM). NP-40 membrane extractions (input) and immunoprecipitates were immunoblotted with either anti-Myc or anti-PrPC. (E and F) Data are mean ± SEM from three independent experiments. (E) Quantification of the PrPC signal in anti-Myc immunoprecipitates after treatment is normalized to the signal of untreated samples. Aβos trigger a significant enhancement of the co-immunoprecipitation of PrPC with Myc-mGluR5 in membrane fractions, which can be significantly reversed by 1 μM SAM (***p < 0.001, ****p < 0.0001 by one-way ANOVA with Tukey’s post hoc multiple comparisons test). (F) Quantification of the Myc signal in anti-PrPC immunoprecipitates after treatment is normalized to the signal of untreated samples. Co-immunoprecipitation of Myc-mGluR5 with PrPC is significantly enhanced by Aβo (**p < 0.01 by one-way ANOVA with Tukey’s post hoc multiple comparisons test). (G) The data from Aβo-treated samples in (E) are replotted as a function of SAM concentration and compared to the values with no SAM added (****p < 0.0001 by one-way ANOVA with Tukey’s post hoc multiple comparisons test). (H) The data from Aβo-treated samples in (F) are replotted as a function of SAM concentration.
Figure 3
Figure 3. The SAM Prevents Aβo-Dependent Inhibition of CA1 LTP
(A–C) Field potentials were recorded from the CA1 region of adult wild-type brain slices. The slope of the field excitatory postsynaptic potential (fEPSP) is plotted as a function of time. Representative traces immediately before theta burst stimulation (TBS, denoted by an arrowhead at 0 min, black) and 60 min post-TBS (red) are superimposed (average, 5 sweeps) in each respective graph. Data are mean ± SEM of averaged slices per treatment group. Slices were pre-treated with or without 100 nM SAM for 2 hr, followed by vehicle or 1 μM Aβo (~5–10 nM oligomer) for 30 min prior to TBS. n = 6–11 slices per condition. (A) There is a significant difference between Aβo-treated slices compared with all other groups by repeated-measures ANOVA (RM-ANOVA (*p < 0.05). (B) Aβo treatment significantly inhibits LTP (*p < 0.05 by RM-ANOVA). (C) There is no significant difference between vehicle and Aβo treatment in SAM-pretreated slices (ns, p > 0.05 by RM-ANOVA). (D) For slices pre-treated with vehicle but not SMA, the subsequent addition Aβo significantly decreased the fEPSPs measured 40–60 min after TBS. Aβo did not alter LTP 40–60 min post-TBS in SAM-pre-treated slices (*p < 0.05, **p < 0.01 by one-way ANOVA, Dunnett’s multiple comparisons test). By two-way ANOVA, there was a significant interaction between SAM and Aβo treatment (p = 0.033).
Figure 4
Figure 4. The SAM Reverses Learning and Memory Deficits in APP/PS1 Transgenic Mice after 4 Weeks of Treatment
(A) Mice were familiarized to two identical objects and then exposed to one familiar and one novel object. Novel object recognition is plotted as the time mice spent interacting with a novel object compared with the time spent interacting with a familiar object. Data are mean ± SEM; n = 18–25 mice/group. Vehicle-treated APP/PS1 mice displayed no preference for either object (p > 0.05), whereas all other groups showed a distinct preference for the novel object (***p < 0.001 by two-way ANOVA with Sidak’s multiple comparisons test). The dashed line indicates an even amount of time spent with a familiar and novel object. (B) Spatial learning in the Morris water maze is plotted as the latency to a hidden platform after 4 weeks of treatment. Data are mean ± SEM of 21–28 mice/group. Performance was analyzed by two-way analysis of variance with RM-ANOVA over the last eight trials and showed a significant effect of genotype (p < 0.001), of treatment (p = 0.043), and of their interaction (p = 0.045). The vehicle-treated APP/PS1 group differed significantly from all other groups by one-way RM-ANOVA over the last eight trials with Tukey’s post hoc multiple comparisons test (*p < 0.05, ***p < 0.001), whereas all other comparisons were not significantly different (p > 0.05). (C) The distance traveled to reach the hidden platform from (B) are plotted for each group. Data are mean ± SEM of 21–28 mice/group. The distance traveled for the vehicle-treated APP/PS1 group differed significantly from all other groups by one-way ANOVA with Tukey’s post hoc multiple comparisons test (**p < 0.01, ***p < 0.005), whereas all other comparisons were not significantly different (p > 0.05). (D) The average swim speed during the last block of swim trials from (B) are plotted for each group. Data are mean ± SEM of 21–28 mice/group. (E) A 60-s probe trial test was performed 24 hr after completion of training in the Morris water maze. Plotted is the percent time spent in the quadrant where the platform was previously located. Data are mean ± SEM of 21–28 mice/group. Performance analyzed by two-way ANOVA showed a significant effect of genotype (p = 0.000), of treatment (p = 0.043), and of their interaction (p = 0.046). The vehicle-treated APP/PS1 group differed significantly from all other groups by one-way ANOVA with Tukey’s post hoc multiple comparisons test (*p < 0.05, ****p < 0.0001), whereas all other comparisons were not significantly different (p > 0.05). The dashed line represents chance performance. (F). Mice were trained to avoid a dark compartment in a passive avoidance paradigm. The latency of vehicle-treated APP/PS1 mice to enter the dark compartment in a retention test 5 min after training was significantly decreased compared with the wild-type (*p < 0.05 by one-way ANOVA with Tukey’s post hoc comparisons). The deficit in behavior of APP/PS1 mice was significantly rescued by SAM treatment (**p < 0.01), which enabled an indifferent latency to enter the dark compartment compared with wild-type mice (p > 0.05). Data are mean ± SEM, n = 21–27 mice/group.
Figure 5
Figure 5. Neither Aβ Plaque Load Nor Gliosis Are Altered by Treatment with the SAM
(A) Representative images of Aβ immunofluorescent staining of the hippocampus of wild-type and APP/PS1 mice treated with vehicle or the SAM. Scale bar, 200 μm. (B) Fractional area of Aβ immunoreactivity averaged from one image of the hippocampus and one image of the frontal cortex stained with anti-Aβ antibody 2454. A one-way ANOVA with Tukey’s post hoc comparisons shows that both APP/PS1 groups differ significantly from both wild-type groups (**p < 0.01; *p < 0.05). No difference was detected upon treatment with the SAM. Data are mean ± SEM from 11–14 mice/group. (C) Representative images of glial fibrillary acidic protein (GFAP) immunofluorescent staining of the frontal cortex of wild-type and APP/PS1 mice treated with vehicle or the SAM. Data are mean ± SEM from 12–14 mice/group. Scale bar, 20 μm. (D) Fractional area of immunoreactivity averaged from one image of the hippocampus and one image of the frontal cortex per mouse. One-way ANOVA with Tukey’s post hoc comparison test shows that both APP/PS1 groups differ significantly from wild-type mice (**p < 0.01, *p < 0.05). Treatment did not alter astrogliosis in either wild-type or APP/PS1 mice (p > 0.05). (E) Representative images of ionized calcium-binding adaptor molecule 1(Iba1) immunofluorescent staining of the frontal cortex of wild-type and APP/PS1 mice treated with vehicle or the SAM. Data are mean ± SEM of 12 mice/group. Scale bar, 20 μm. (F) Fractional area of immunoreactivity averaged from one image of the hippocampus and one image of the frontal cortex per mouse. One-way ANOVA with Tukey’s post hoc comparisons shows that both APP/PS1 groups differ significantly from both wild-type groups (***p < 0.001). Treatment did not alter microgliosis in either wild-type or APP/PS1 groups (p > 0.05).
Figure 6
Figure 6. The SAM Recovers Loss of Synaptic Markers in APP/PS1 Mice after 5 Weeks of Treatment
(A) Representative immunofluorescent images of the dentate gyrus of the indicated groups stained with SV2a. Scale bar, 12 μm. (B) Fractional area of immunoreactive puncta for SV2a in the dentate gyrus. One-way ANOVA with Tukey’s post hoc comparisons shows that the vehicle-treated APP/PS1 group differs significantly from the SAM-treated wild-type group as well as the SAM-treated APP/PS1 group (*p < 0.05). Data are mean ± SEM of 15–23 mice/group. (C) Representative immunofluorescent images of the dentate gyrus of the indicated groups, stained for PSD-95. Scale bar, 12 μm. (D) Fractional area of immunoreactive puncta for PSD-95 in the dentate gyrus of the indicated groups. Data are mean ± SEM of 16–23 mice/group. One-way ANOVA with Tukey’s post hoc comparisons shows that the vehicle-treated APP/PS1 group differs significantly from the vehicle-treated wild-type group (*p < 0.05), but the SAM-treated APP/PS1 group is rescued to wild-type levels (ns, p > 0.05).
Figure 7
Figure 7. The SAM Recovers Aβo-Induced Activation of Intracellular Signaling Molecules
(A) Representative immunoblots of RIPA-soluble extracts from brain slices incubated with Aβo or vehicle for 30 min and pre-incubated with SAM or vehicle for 2 hr. (B and C) Densitometric analysis of the immunoblots from (A) showing Aβo-induced activation of Pyk2 (B) and CaMKII (C), which was significantly reduced by pre-incubating brain slices with the SAM (*p < 0.05 by one-way ANOVA with Dunnett’s multiple comparisons test). Data are mean ± SEM of three independent experiments with the brain slices per condition each. (D) Representative immunoblots of RIPA-soluble brain lysates of mice treated with the SAM or vehicle for 5 weeks. Genotypes and treatment status are indicated above each lane, and each lane represents a separate mouse. (E and F) Densitometric analysis of the immunoblots from (D). Data are mean ± SEM of 22–26 mice/group. The ratio of phospho-Pyk2(Y402) to Pyk2 (E) as well as phospho-eEF2(T56) to eEF2 (F) in vehicle-treated APP/PS1 brain was significantly elevated compared with wild-type brain. This ratio was significantly reduced and normalized to wild-type levels in SAM-treated APP/PS1 mice (***p < 0.001, **p < 0.01, *p < 0.05; one-way ANOVA with Tukey post hoc comparisons).

Similar articles

Cited by

References

    1. Abou Farha K, Bruggeman R, Baljé-Volkers C. Metabotropic glutamate receptor 5 negative modulation in phase I clinical trial: potential impact of circadian rhythm on the neuropsychiatric adverse reactions do hallucinations matter? ISRN Psychiatry. 2014;2014:652750. - PMC - PubMed
    1. Ballatore C, Lee VM, Trojanowski JQ. Tau-mediated neurodegeneration in Alzheimer’s disease and related disorders. Nat Rev Neurosci. 2007;8:663–672. - PubMed
    1. Beraldo FH, Ostapchenko VG, Caetano FA, Guimaraes AL, Ferretti GD, Daude N, Bertram L, Nogueira KO, Silva JL, Westaway D, et al. Regulation of amyloid β oligomer binding to neurons and neurotoxicity by the prion protein-mGluR5 complex. J Biol Chem. 2016;291:21945–21955. - PMC - PubMed
    1. Berman DE, Dall’Armi C, Voronov SV, McIntire LB, Zhang H, Moore AZ, Staniszewski A, Arancio O, Kim TW, Di Paolo G. Oligomeric amyloid-beta peptide disrupts phosphatidylinositol-4,5-bisphosphate metabolism. Nat Neurosci. 2008;11:547–554. - PMC - PubMed
    1. Bhakar AL, Dölen G, Bear MF. The pathophysiology of fragile X (and what it teaches us about synapses) Annu Rev Neurosci. 2012;35:417–443. - PMC - PubMed

Publication types

MeSH terms