

Azidothymidine-triphosphate impairs mitochondrial dynamics by disrupting the quality control system
- PMID: 28683400
- PMCID: PMC5498287
- DOI: 10.1016/j.redox.2017.06.011
Azidothymidine-triphosphate impairs mitochondrial dynamics by disrupting the quality control system
Abstract
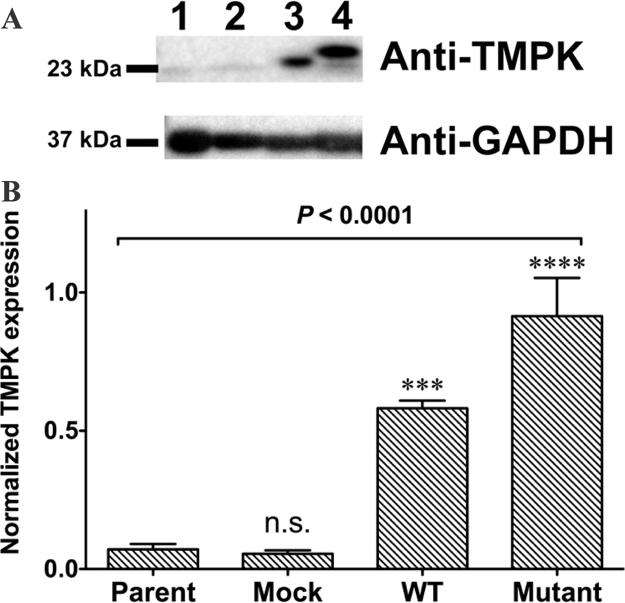
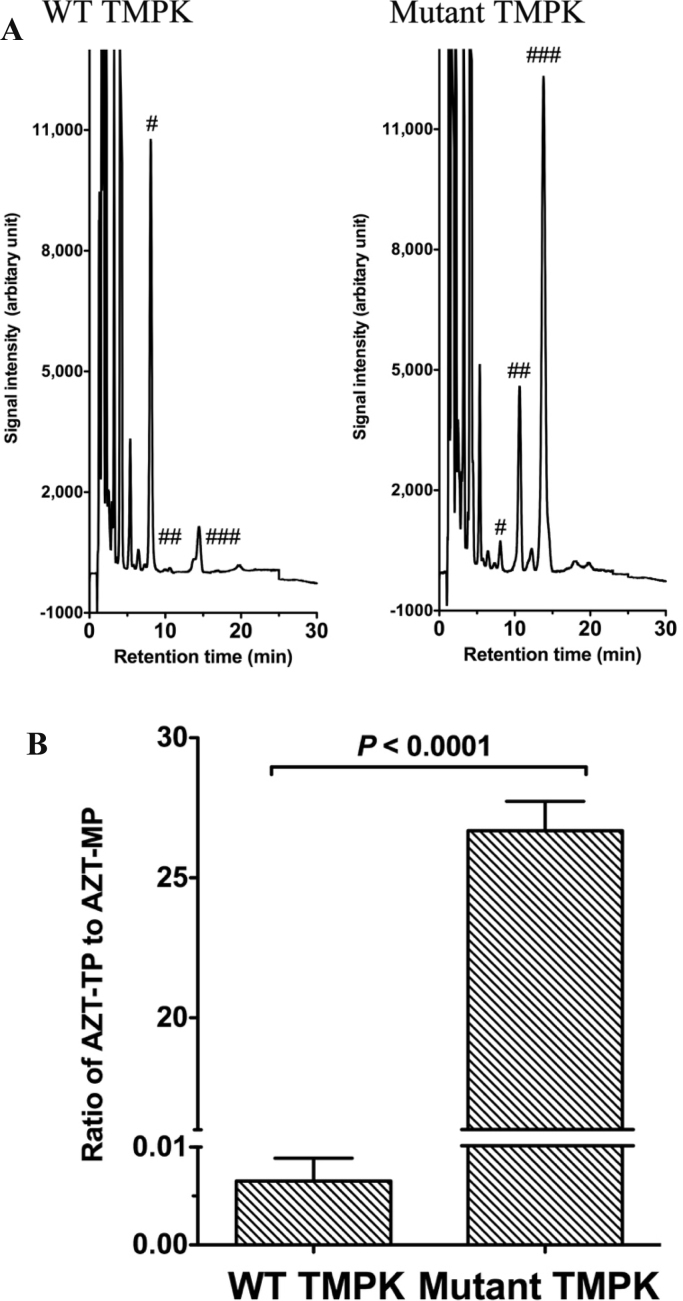
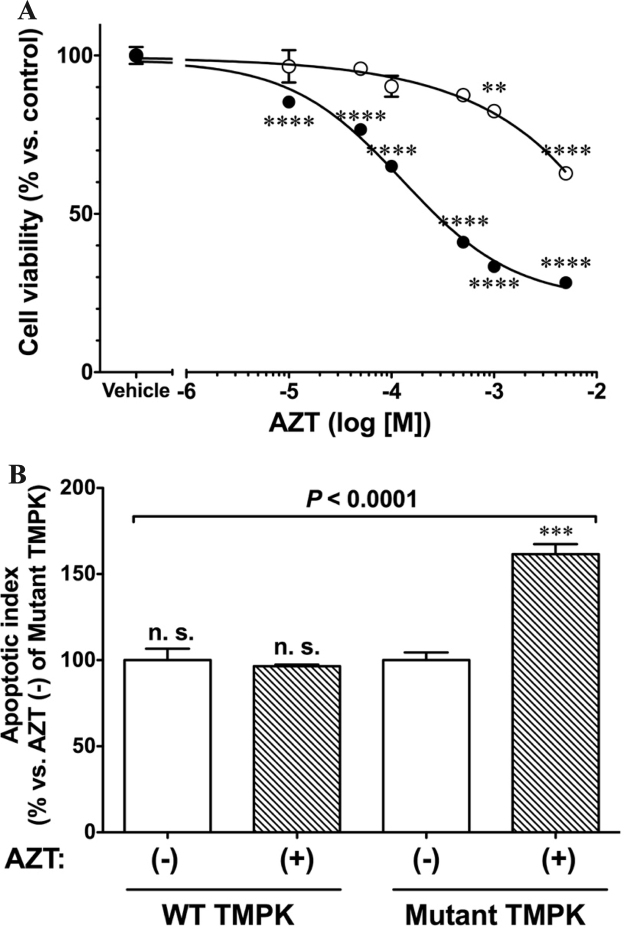
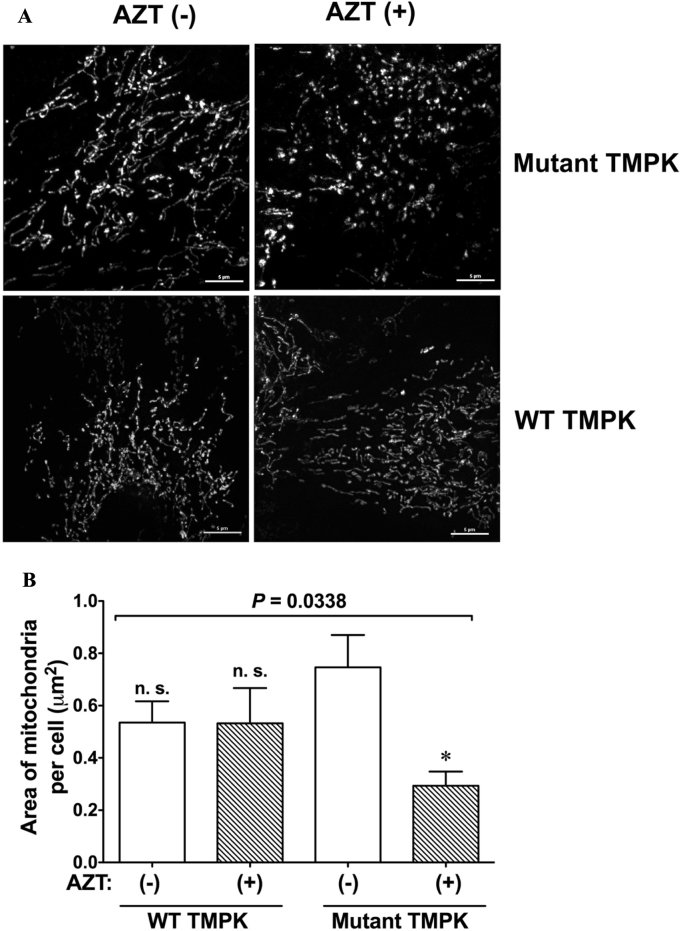
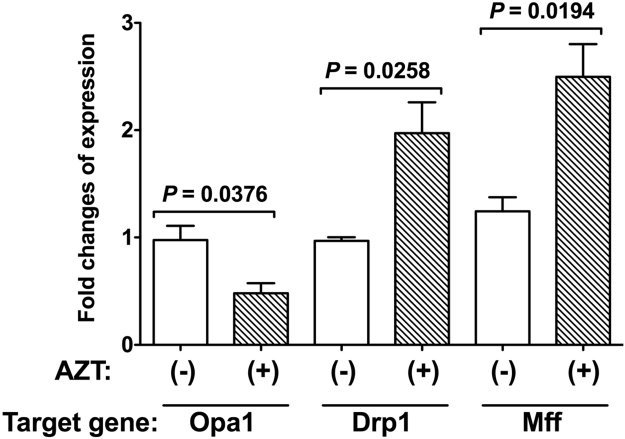
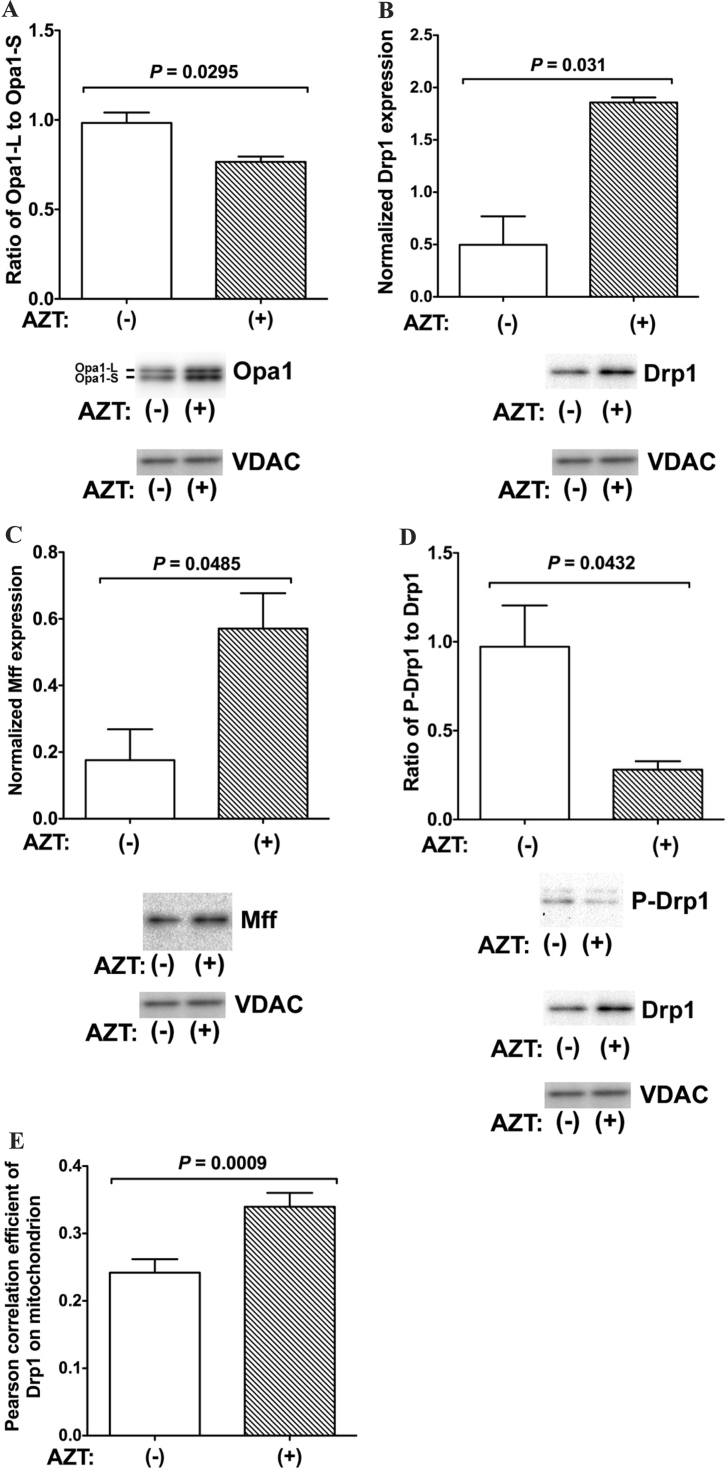
Highly active anti-retrovirus therapy (HAART) has been used to block the progression and symptoms of human immunodeficiency virus infection. Although it decreases morbidity and mortality, clinical use of HAART has also been linked to various adverse effects such as severe cardiomyopathy resulting from compromised mitochondrial functioning. However, the mechanistic basis for these effects remains unclear. Here, we demonstrate that a key component of HAART, 3ꞌ-azido-3ꞌ-deoxythymidine (AZT), particularly, its active metabolite AZT-triphosphate (AZT-TP), caused mitochondrial dysfunction, leading to induction of cell death in H9c2 cells derived from rat embryonic myoblasts, which serve as a model for cardiomyopathy. Specifically, treatment with 100µM AZT for 48h disrupted the mitochondrial tubular network via accumulation of AZT-TP. The mRNA expression of dynamin-related protein (Drp)1 and the Drp1 receptor mitochondrial fission factor (Mff) was upregulated whereas that of optic atrophy 1 (Opa1) was downregulated following AZT treatment. Increased mitochondrial translocation of Drp1, Mff upregulation, and decreased functional Opa1 expression induced by AZT impaired the balance of mitochondrial fission vs. fusion. These data demonstrate that AZT-TP causes cell death by altering mitochondrial dynamics.
Keywords: Cardiomyopathy; Metabolites; Mitochondrial dynamics; Mitochondrial function; Oxidative phosphorylation; Oxidative stress.
Copyright © 2017 The Authors. Published by Elsevier B.V. All rights reserved.
Figures
Similar articles
-
Phosphorylation of thymidine and AZT in heart mitochondria: elucidation of a novel mechanism of AZT cardiotoxicity.Cardiovasc Toxicol. 2004;4(2):155-67. doi: 10.1385/ct:4:2:155. Cardiovasc Toxicol. 2004. PMID: 15371631 Free PMC article.
-
3'-Azido-3'-deoxythymidine (AZT) inhibits thymidine phosphorylation in isolated rat liver mitochondria: a possible mechanism of AZT hepatotoxicity.Biochem Pharmacol. 2006 Apr 28;71(9):1342-8. doi: 10.1016/j.bcp.2006.01.003. Epub 2006 Feb 10. Biochem Pharmacol. 2006. PMID: 16472780 Free PMC article.
-
Oxidative insults disrupt OPA1-mediated mitochondrial dynamics in cultured mammalian cells.Redox Rep. 2018 Dec;23(1):160-167. doi: 10.1080/13510002.2018.1492766. Redox Rep. 2018. PMID: 29961397 Free PMC article.
-
Mechanisms of zidovudine-induced mitochondrial toxicity and myopathy.Pharmacology. 2008;82(2):83-8. doi: 10.1159/000134943. Epub 2008 May 27. Pharmacology. 2008. PMID: 18504416 Review.
-
The role of Drp1 adaptor proteins MiD49 and MiD51 in mitochondrial fission: implications for human disease.Clin Sci (Lond). 2016 Nov 1;130(21):1861-74. doi: 10.1042/CS20160030. Clin Sci (Lond). 2016. PMID: 27660309 Review.
Cited by
-
The role of autophagy in the progression of HIV infected cardiomyopathy.Front Cell Dev Biol. 2024 Jul 17;12:1372573. doi: 10.3389/fcell.2024.1372573. eCollection 2024. Front Cell Dev Biol. 2024. PMID: 39086659 Free PMC article. Review.
-
Environmental Chemical Exposures and Mitochondrial Dysfunction: a Review of Recent Literature.Curr Environ Health Rep. 2022 Dec;9(4):631-649. doi: 10.1007/s40572-022-00371-7. Epub 2022 Jul 28. Curr Environ Health Rep. 2022. PMID: 35902457 Free PMC article. Review.
-
The Essential Role of Mitochondrial Dynamics in Viral Infections.Int J Mol Sci. 2025 Feb 24;26(5):1955. doi: 10.3390/ijms26051955. Int J Mol Sci. 2025. PMID: 40076578 Free PMC article. Review.
-
ROS Chronicles in HIV Infection: Genesis of Oxidative Stress, Associated Pathologies, and Therapeutic Strategies.Curr Issues Mol Biol. 2024 Aug 14;46(8):8852-8873. doi: 10.3390/cimb46080523. Curr Issues Mol Biol. 2024. PMID: 39194740 Free PMC article. Review.
-
Advances in Cardiotoxicity Induced by Altered Mitochondrial Dynamics and Mitophagy.Front Cardiovasc Med. 2021 Sep 20;8:739095. doi: 10.3389/fcvm.2021.739095. eCollection 2021. Front Cardiovasc Med. 2021. PMID: 34616789 Free PMC article. Review.
References
-
- Detmer S.A., Chan D.C. Functions and dysfunctions of mitochondrial dynamics. Nat. Rev. Mol. Cell Biol. 2007;8:870–879. - PubMed
-
- Amati-Bonneau P., Milea D., Bonneau D., Chevrollier A., Ferre M., Guillet V., Gueguen N., Loiseau D., de Crescenzo M.A., Verny C., Procaccio V., Lenaers G., Reynier P. OPA1-associated disorders: phenotypes and pathophysiology. Int. J. Biochem. Cell Biol. 2009;41:1855–1865. - PubMed
-
- Nagpal M., Tayal V., Kumar S., Gupta U. Adverse drug reactions to antiretroviral therapy in AIDS patients at a tertiary care hospital in India: a prospective observational study. Indian J. Med. Sci. 2010;64:245–252. - PubMed
-
- Carr A., Miller J., Law M., Cooper D.A. A syndrome of lipoatrophy, lactic acidaemia and liver dysfunction associated with HIV nucleoside analogue therapy: contribution to protease inhibitor-related lipodystrophy syndrome. AIDS. 2000;14:F25–F32. - PubMed
MeSH terms
Substances
LinkOut - more resources
Full Text Sources
Other Literature Sources
Medical
Miscellaneous
