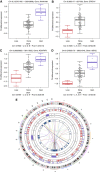
Comprehensive analysis of copy number aberrations in microsatellite stable colon cancer in view of stromal component
- PMID: 28683472
- PMCID: PMC5537504
- DOI: 10.1038/bjc.2017.208
Comprehensive analysis of copy number aberrations in microsatellite stable colon cancer in view of stromal component
Abstract
Background: Somatic copy number aberrations (CNAs) are common acquired changes in cancer cells having an important role in the progression of colon cancer (colorectal cancer, CRC). This study aimed to perform a characterisation of CNA and their impact in gene expression.
Methods: Copy number aberrations were inferred from SNP array data in a series of 99 CRC. Copy number aberration events were calculated and used to assess the association between copy number dosage, clinical and molecular characteristics of the tumours, and gene expression changes. All analyses were adjusted for the quantity of stroma in each sample, which was inferred from gene expression data.
Results: High heterogeneity among samples was observed; the proportion of altered genome ranged between 0.04 and 26.6%. Recurrent CNA regions with gains were frequent in chromosomes 7p, 8q, 13q, and 20, whereas 8p, 17p, and 18 cumulated losses. A significant positive correlation was observed between the number of somatic mutations and total CNA (Spearman's r=0.42, P=0.006). Approximately 37% of genes located in CNA regions changed their level of expression and the average partial correlation (adjusted for stromal content) with copy number was 0.54 (interquartile range 0.20 to 0.81). Altered genes showed enrichment in pathways relevant for CRC. Tumours classified as CMS2 and CMS4 by the consensus molecular subtyping showed higher frequency of CNA. Losses of one small region in 1p36.33, with gene CDK11B, were associated with poor prognosis. More than 66% of the recurrent CNA were validated in the The Cancer Genome Atlas (TCGA) data when analysed with the same procedure. Furthermore, 79% of the genes with altered expression in our data were validated in the TCGA.
Conclusions: Although CNA are frequent events in microsatellite stable CRC, few focal recurrent regions were found. These aberrations have strong effects on gene expression and contribute to deregulate relevant cancer pathways. Owing to the diploid nature of stromal cells, it is important to consider the purity of tumour samples to accurately calculate CNA events in CRC.
Conflict of interest statement
The authors declare no conflict of interest.
Figures


Similar articles
-
Integrated analysis of genome-wide copy number alterations and gene expression in microsatellite stable, CpG island methylator phenotype-negative colon cancer.Genes Chromosomes Cancer. 2013 May;52(5):450-66. doi: 10.1002/gcc.22043. Epub 2013 Jan 23. Genes Chromosomes Cancer. 2013. PMID: 23341073 Free PMC article.
-
Clinical omics analysis of colorectal cancer incorporating copy number aberrations and gene expression data.Cancer Inform. 2010 Jul 29;9:147-61. doi: 10.4137/cin.s3851. Cancer Inform. 2010. PMID: 20706620 Free PMC article.
-
Gene expression profiles of CMS2-epithelial/canonical colorectal cancers are largely driven by DNA copy number gains.Oncogene. 2019 Aug;38(33):6109-6122. doi: 10.1038/s41388-019-0868-5. Epub 2019 Jul 15. Oncogene. 2019. PMID: 31308487 Free PMC article.
-
Gene dysregulations driven by somatic copy number aberrations-biological and clinical implications in colon tumors: a paper from the 2009 William Beaumont Hospital Symposium on Molecular Pathology.J Mol Diagn. 2010 Sep;12(5):552-61. doi: 10.2353/jmoldx.2010.100098. Epub 2010 Aug 13. J Mol Diagn. 2010. PMID: 20709793 Free PMC article. Review.
-
Molecular pathological classification of colorectal cancer.Virchows Arch. 2016 Aug;469(2):125-34. doi: 10.1007/s00428-016-1956-3. Epub 2016 Jun 20. Virchows Arch. 2016. PMID: 27325016 Free PMC article. Review.
Cited by
-
Exploring TCGA database for identification of potential prognostic genes in stomach adenocarcinoma.Cancer Cell Int. 2020 Jun 23;20:264. doi: 10.1186/s12935-020-01351-3. eCollection 2020. Cancer Cell Int. 2020. PMID: 32581654 Free PMC article.
-
Data-driven analysis to identify prognostic immune-related biomarkers in BRAF mutated cutaneous melanoma microenvironment.Front Genet. 2022 Nov 30;13:1081418. doi: 10.3389/fgene.2022.1081418. eCollection 2022. Front Genet. 2022. PMID: 36531226 Free PMC article.
-
Cyclin B1 acts as a tumor microenvironment-related cancer promoter and prognostic biomarker in hepatocellular carcinoma.J Int Med Res. 2021 May;49(5):3000605211016265. doi: 10.1177/03000605211016265. J Int Med Res. 2021. PMID: 34044639 Free PMC article.
-
Data Mining of Prognostic Microenvironment-Related Genes in Clear Cell Renal Cell Carcinoma: A Study with TCGA Database.Dis Markers. 2019 Oct 30;2019:8901649. doi: 10.1155/2019/8901649. eCollection 2019. Dis Markers. 2019. PMID: 31781309 Free PMC article.
-
Low tumor purity is associated with poor prognosis, heavy mutation burden, and intense immune phenotype in colon cancer.Cancer Manag Res. 2018 Sep 17;10:3569-3577. doi: 10.2147/CMAR.S171855. eCollection 2018. Cancer Manag Res. 2018. PMID: 30271205 Free PMC article.
References
-
- Andersen CL, Lamy P, Thorsen K, Kjeldsen E, Wikman F, Villesen P, Oster B, Laurberg S, Orntoft TF (2011) Frequent genomic loss at chr16p13.2 is associated with poor prognosis in colorectal cancer. Int J Cancer 129(8): 1848–1858. - PubMed
MeSH terms
LinkOut - more resources
Full Text Sources
Other Literature Sources

