. 2017 Jul 6;10(1):34.
doi: 10.1186/s13072-017-0139-z.

Metabolic labeling in middle-down proteomics allows for investigation of the dynamics of the histone code

Affiliations

Metabolic labeling in middle-down proteomics allows for investigation of the dynamics of the histone code

Simone Sidoli et al. Epigenetics Chromatin. .

Abstract

Background: Middle-down mass spectrometry (MS), i.e., analysis of long (~50-60 aa) polypeptides, has become the method with the highest throughput and accuracy for the characterization of combinatorial histone posttranslational modifications (PTMs). The discovery of histone readers with multiple domains, and overall the cross talk of PTMs that decorate histone proteins, has revealed that histone marks have synergistic roles in modulating enzyme recruitment and subsequent chromatin activities. Here, we demonstrate that the middle-down MS strategy can be combined with metabolic labeling for enhanced quantification of histone proteins and their combinatorial PTMs in a dynamic manner.

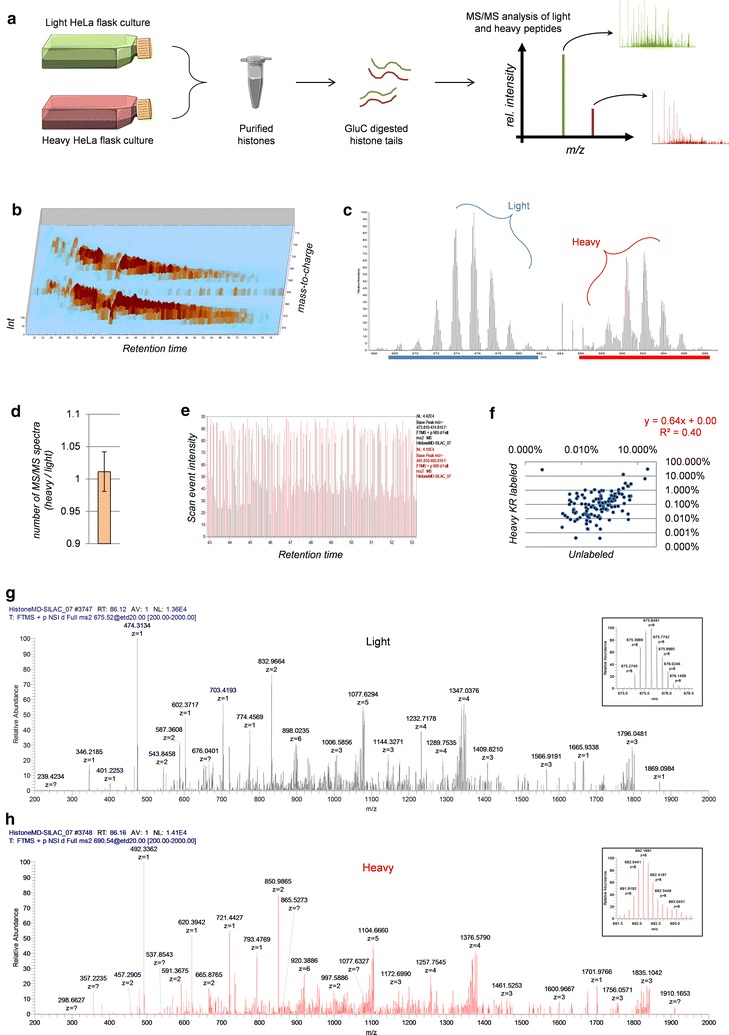
Methods: We used a nanoHPLC-MS/MS system consisting of hybrid weak cation exchange-hydrophilic interaction chromatography combined with high resolution MS and MS/MS with ETD fragmentation. After spectra identification, we filtered confident hits and quantified polypeptides using our in-house software isoScale.

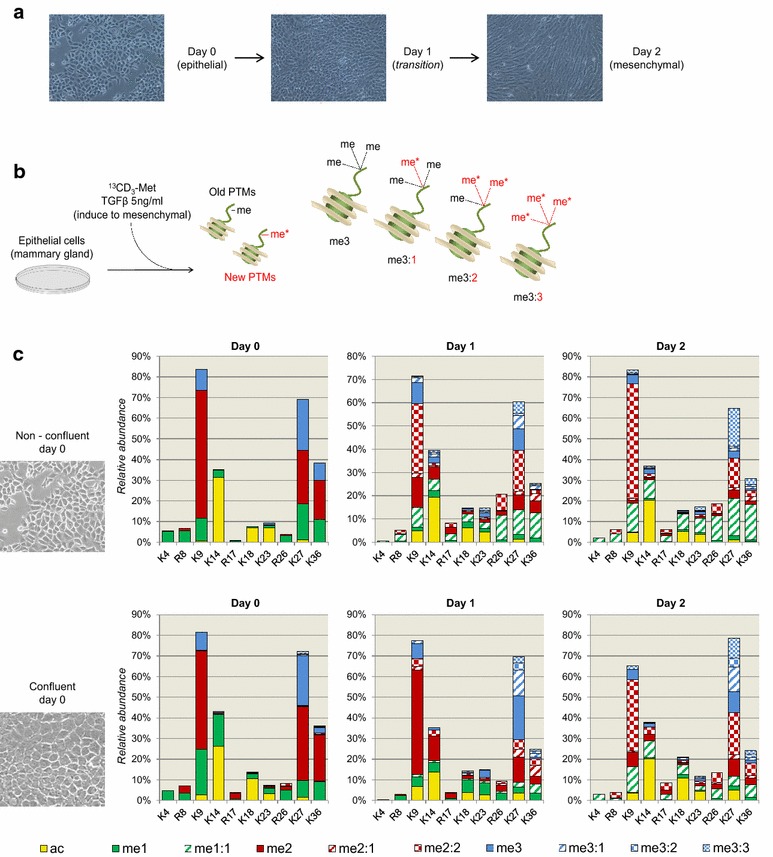
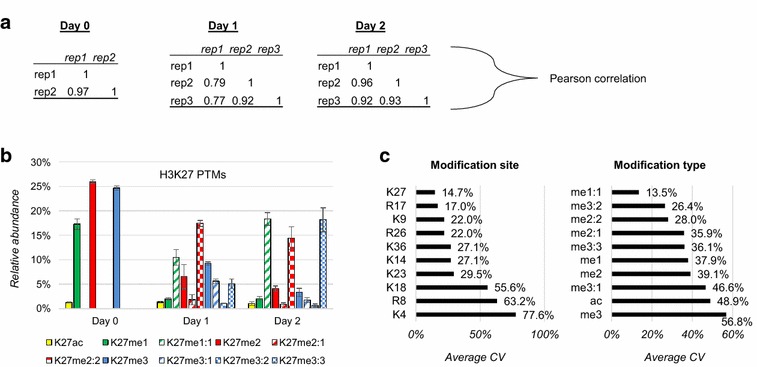
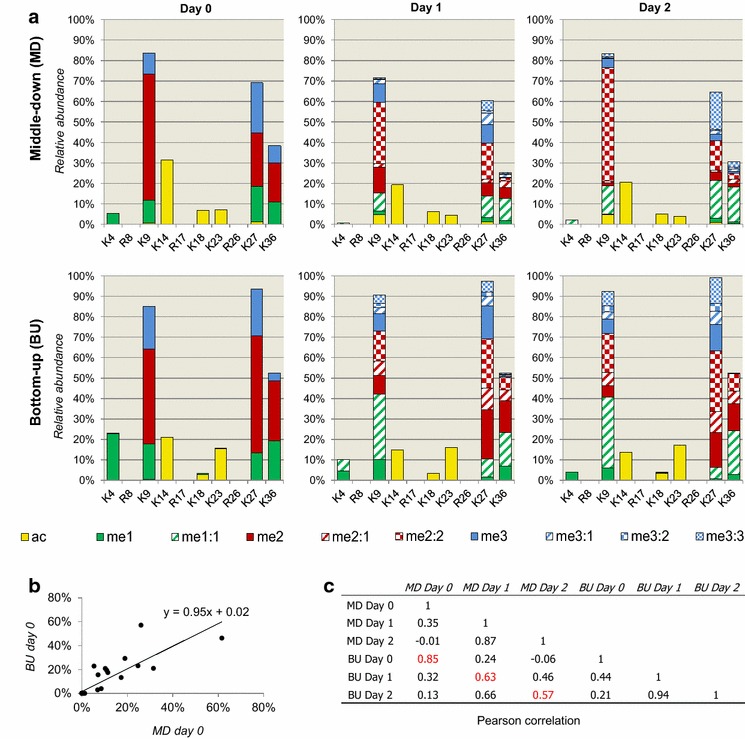
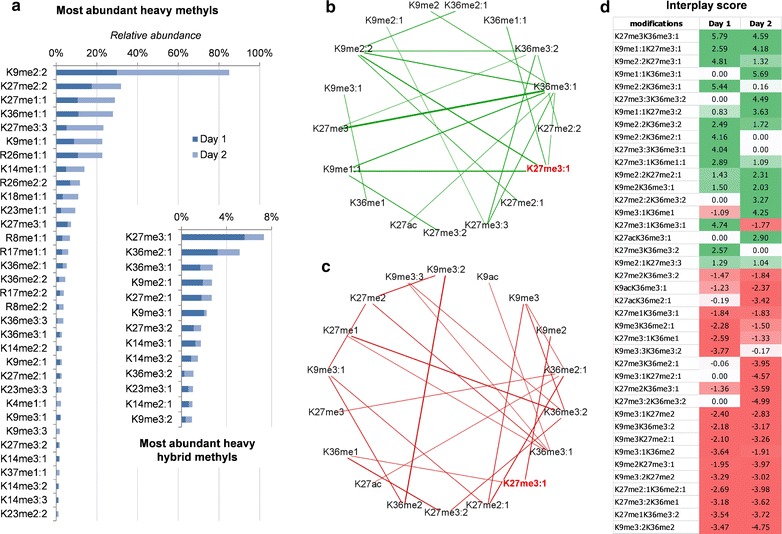
Results: We first verified that middle-down MS can discriminate and differentially quantify unlabeled from heavy labeled histone N-terminal tails (heavy lysine and arginine residues). Results revealed no bias toward identifying and quantifying unlabeled versus heavy labeled tails, even if the heavy labeled peptides presented the typical skewed isotopic pattern typical of long protein sequences that hardly get 100% labeling. Next, we plated epithelial cells into a media with heavy methionine-(methyl-13CD3), the precursor of the methyl donor S-adenosylmethionine and stimulated epithelial to mesenchymal transition (EMT). We assessed that results were reproducible across biological replicates and with data obtained using the more widely adopted bottom-up MS strategy, i.e., analysis of short tryptic peptides. We found remarkable differences in the incorporation rate of methylations in non-confluent cells versus confluent cells. Moreover, we showed that H3K27me3 was a critical player during the EMT process, as a consistent portion of histones modified as H3K27me2K36me2 in epithelial cells were converted into H3K27me3K36me2 in mesenchymal cells.

Conclusions: We demonstrate that middle-down MS, despite being a more scarcely exploited MS technique than bottom-up, is a robust quantitative method for histone PTM characterization. In particular, middle-down MS combined with metabolic labeling is currently the only methodology available for investigating turnover of combinatorial histone PTMs in dynamic systems.

Keywords: Epigenetics; Histones; Mass spectrometry; Methylation; Middle-down; Posttranslational modifications; SILAC.


Figures

Fig. 1
Fig. 1
Analysis of histone H3 N-terminal tails from HeLa cells labeled with heavy lysine/arginine residues (heavy KR). a Workflow for metabolic labeling of histone sequences. Histones were extracted from HeLa S3 cells grown in equal amounts in light and heavy medium. After extraction, histone H3 was purified using C18 chromatography and digested using GluC. MS/MS-based quantification was performed using isoScale labels. b Nano-liquid chromatography (nLC)-MS ion map of the histone H3 N-terminal tail in its unlabeled and isotopically heavy labeled form. The y axis represents m/z, while the x axis represents retention time. The pattern above is the sequential elution of modified histone tails with heavy KR label, while the pattern below is the unlabeled tails. Histone tails elute from the most modified to the least modified, which is why the m/z value decreases as function of time. c Full MS spectrum representing differently methylated histone tails co-eluting from chromatography. Unlabeled (light) forms are underlined in blue, while heavy KR-labeled peptides are underlined in red. d Number of MS/MS spectra performed for light and heavy histone tails. Their ratio indicates that both species are equally subjected to MS/MS selection; error bar represents standard deviation of 4 replicates. e MS/MS events selecting either unlabeled (black) or heavy KR-labeled (red) peptides for fragmentation. No clustering of colors indicates that there is no bias in MS/MS selection for the two forms. f Correlation between quantified polypeptides for each of the two labels. Axes represent the average relative abundance of given modified polypeptides quantified in the two forms. Axes are Log10 scaled to facilitate visualization. g MS/MS ion spectrum of a selected histone tail in its unlabeled form and h the same histone tail in its heavy KR-labeled form. The MS scan of their precursor mass is displayed on the square at the top right of the MS/MS spectrum
Fig. 2
Fig. 2
Heavy methyl labeling of epithelial to mesenchymal transition (EMT) cell lines. a Microscopy image of epithelial cell culture at days 0, 1 and 2. Day 0 is prior stimulation with TGFβ, inducing mesenchymal transition. b On the left, workflow displaying the treatment of epithelial cells to induce EMT. Briefly, epithelial cells were plated into a new media containing heavy labeled methionine. Newly synthesized PTMs are characterized by a mass shift of 4 Da, due to the replacement of CH3 with 13CD3. On the right, examples of the possible labeling combinations for trimethylation; the number of heavy labeled methyl groups is illustrated by the number after the colon (in red). c Relative abundance of single histone PTMs in EMT in not confluent culture (top) and confluent culture (bottom). Data are the average of three biological replicates (two for day 0). Heavy labeled methylations are highlighted by different degrees of dashed bars; one heavy methyl is indicated with diagonal lines, two heavy methyl groups with a cheeseboard-like theme and three heavy methyl groups with more dense tiny squares. The relative abundance of single PTMs was obtained by summing the relative abundance of all combinatorial forms containing each given PTM
Fig. 3
Fig. 3
Reproducibility of PTM quantification (including heavy labeled methylations) across the biological replicates of the non-confluent EMT cell experiment. a Pearson’s correlation of biological replicates for each of the three time points. b Relative abundance and standard deviation (represented as error bars) of the modified forms of H3K27. Figure illustrates the variation of the biological replicates. Color and theme coding is the same as Fig. 2c. c Coefficient of variation (CV) of the biological replicates grouped by modification site and modification type. The average across the three time points was taken
Fig. 4
Fig. 4
Comparison of single PTM quantification obtained from the middle-down and the bottom-up MS analysis. a Relative abundance of single histone PTMs quantifiable by both middle-down (top) and bottom-up (bottom) MS strategies. The relative abundance of single PTMs was obtained by summing the relative abundance of all combinatorial forms containing each given PTM. b Example of correlation between the day 0 results of bottom-up and middle-down MS. c Pearson’s correlation values between the described runs. Averages of biological replicates were used for the comparison; in red, correlation of the same time point of middle-down versus bottom-up MS
Fig. 5
Fig. 5
Analysis of heavily labeled methylations at days 1 and 2 of EMT. a Relative abundance of heavy labeled methylations, sorted by cumulative intensity for the days 1 and 2. In the smaller bar plot, zoom for the hybrid methylations, i.e., methylated states containing both unlabeled and heavy labeled methyl groups.Ring graph representing b positive and c negative interplay scores between methylations on K9, K27 and K36 sites. Line thickness represents interplay absolute values. High interplay values indicate that the two marks coexist on the same histone tail with a frequency higher (if positive) or lower (if negative) than random co-occurrence. d Most intense absolute interplay scores that include at least one hybrid mark

References

    1. Xu D, Bai J, Duan Q, Costa M, Dai W. Covalent modifications of histones during mitosis and meiosis. Cell Cycle. 2009;8:3688–3694. doi: 10.4161/cc.8.22.9908. - DOI - PubMed
    1. Kouzarides T. Chromatin modifications and their function. Cell. 2007;128:693–705. doi: 10.1016/j.cell.2007.02.005. - DOI - PubMed
    1. Jenuwein T, Allis CD. Translating the histone code. Science. 2001;293:1074–1080. doi: 10.1126/science.1063127. - DOI - PubMed
    1. Taverna SD, Li H, Ruthenburg AJ, Allis CD, Patel DJ. How chromatin-binding modules interpret histone modifications: lessons from professional pocket pickers. Nat Struct Mol Biol. 2007;14:1025–1040. doi: 10.1038/nsmb1338. - DOI - PMC - PubMed
    1. Fischle W, Wang Y, Allis CD. Histone and chromatin cross-talk. Curr Opin Cell Biol. 2003;15:172–183. doi: 10.1016/S0955-0674(03)00013-9. - DOI - PubMed

Publication types

LinkOut - more resources