. 2017 Jul 6;17(1):163.
doi: 10.1186/s12862-017-1001-4.

Uncovering missing pieces: duplication and deletion history of arrestins in deuterostomes

Affiliations

Uncovering missing pieces: duplication and deletion history of arrestins in deuterostomes

Henrike Indrischek et al. BMC Evol Biol. .

Abstract

Background: The cytosolic arrestin proteins mediate desensitization of activated G protein-coupled receptors (GPCRs) via competition with G proteins for the active phosphorylated receptors. Arrestins in active, including receptor-bound, conformation are also transducers of signaling. Therefore, this protein family is an attractive therapeutic target. The signaling outcome is believed to be a result of structural and sequence-dependent interactions of arrestins with GPCRs and other protein partners. Here we elucidated the detailed evolution of arrestins in deuterostomes.

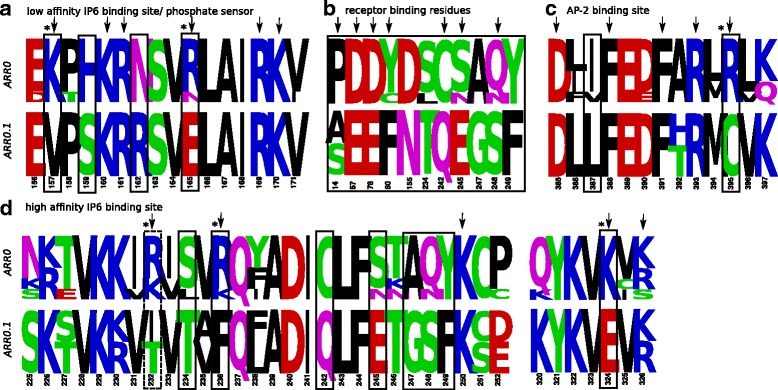
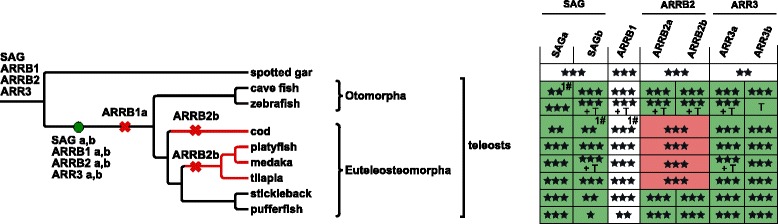
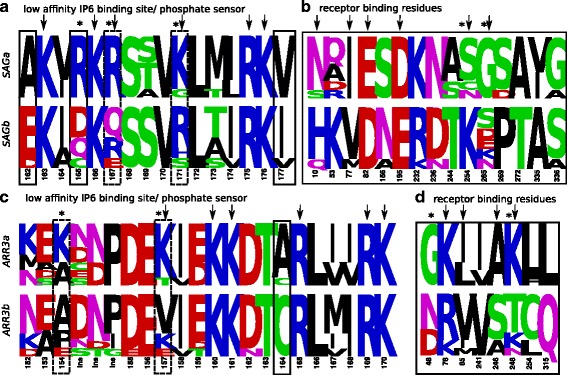
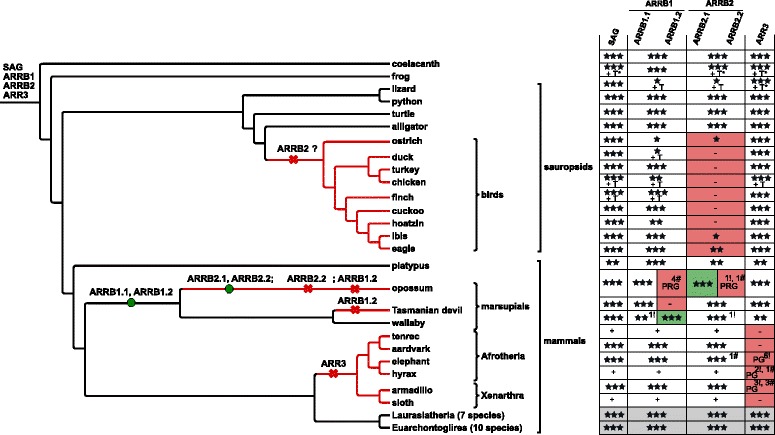
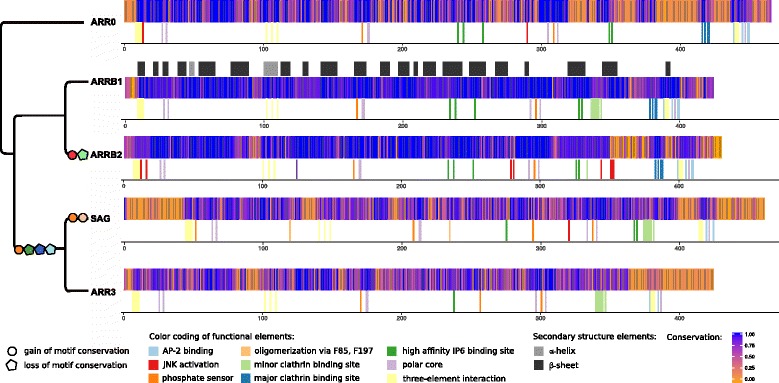
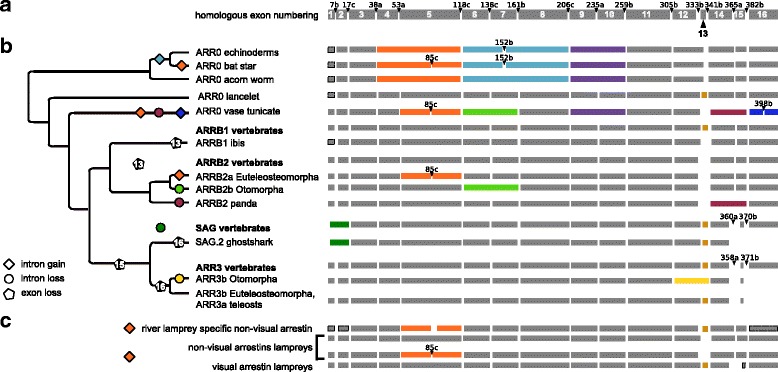
Results: Identity and number of arrestin paralogs were determined searching deuterostome genomes and gene expression data. In contrast to standard gene prediction methods, our strategy first detects exons situated on different scaffolds and then solves the problem of assigning them to the correct gene. This increases both the completeness and the accuracy of the annotation in comparison to conventional database search strategies applied by the community. The employed strategy enabled us to map in detail the duplication- and deletion history of arrestin paralogs including tandem duplications, pseudogenizations and the formation of retrogenes. The two rounds of whole genome duplications in the vertebrate stem lineage gave rise to four arrestin paralogs. Surprisingly, visual arrestin ARR3 was lost in the mammalian clades Afrotheria and Xenarthra. Duplications in specific clades, on the other hand, must have given rise to new paralogs that show signatures of diversification in functional elements important for receptor binding and phosphate sensing.

Conclusion: The current study traces the functional evolution of deuterostome arrestins in unprecedented detail. Based on a precise re-annotation of the exon-intron structure at nucleotide resolution, we infer the gain and loss of paralogs and patterns of conservation, co-variation and selection.

Keywords: Arrestin; Evolution; Gene duplication; Receptor specificity; Retrogene; Signaling.


Figures

Fig. 1
Fig. 1
Functional elements of arrestins. a – Crystal structure of bovine ARRB1 colored according to the conserved exon-borders in vertebrates (rainbow coloring from exon 2 - red to exon 16 - dark violet). Exons 1, 15 as well as parts of exons 13, 14 and 16 are missing in the crystal structure (shown as dotted lines if not situated on the N- or C-terminus). Amino acids whose codons are split among two exons are shown in grey [112]. b – Schematic, linear representation of bovine ARRB1 with important functional elements shown in bright colors (orange - AP-2 binding site, light blue - three-element interaction, dark blue - polar core, green - finger loop, brown - high affinity IP6 binding site, pink - low affinity IP6 binding site, red - phosphate sensor, purple - clathrin binding sites). Arrestins encode two key domains, the arrestin_N domain (wheat) and the arrestin_C domain (light pink). Other regions that are present in the crystal structure are shown in light green, while sequence parts missing therein are shown in white. c – Functional elements depicted in B are mapped to the crystal structure of bovine ARRB1. The clathrin binding sites are missing in the crystal structure as they are situated on exons 13 and 15. PDB: 1G4R [55]. Crystal structure images were created with Pymol 1.8.4.0 Open-Source [113]
Fig. 2
Fig. 2
Number of deuterostome arrestin paralogs resulting from the application of the ExonMatchSolver (EMS) pipeline and manual curation in comparison with the OrthoDB database. Higher and lower paralog counts were obtained by genome mining in combination with manual curation for 20 species (purple) and five species (orange), respectively, as compared to the OrthoDB. The paralog counts and annotations obtained with the EMS approach and that are based on an expert opinion, are assumed to be correct. OrthoDB overpredicted sequences due to mis-assembly (Sus scrofa), inclusion of a pseudogene (Monodelphis domestica), a naming mistake (Homo sapiens), included two additional sequences without any further reference (Branchiostoma floridae, Saccoglossus kowalevskii). Arrestins correspond to the OrthoDB group EOG091G05M2
Fig. 3
Fig. 3
Duplication and deletion of arrestin paralogs within basal deuterostomes. a - Species tree of basal deuterostomes with mapped duplication events of arrestins (dots). b - Schematic arrestin gene tree for vertebrates (square in A). A cross indicates a gene loss. New gene names are given above the dot or branch. The gene loss/ duplication pattern was simplified for bony fish (bf), see Fig. 6, Fig. 8 and Additional file 1: Figure S13 for details. The completeness of arrestin annotations in the respective genomes is depicted with three stars indicating 0-3 missing exons, two stars 4-8 missing exons, one star more than 8 missing exons and dash (-) that no gene fragments were detected. Additional support from other omics-data for cartilaginous fishes and jawless fishes and from experimentally validated genbank entries is indicated by the following abbreviations: T - transcriptome evidence, P - protein evidence. The hash (#) indicates the number of frame shift mutations contained in the exon annotation. Note that the order of cyclostome-specific and cartilaginous fish-specific duplications in relation to each other was chosen arbitrarily. An additional non-visual arrestin detected in the germline genome of river lamprey was not included in the scenario (see Additional file 1: Appendix 1). Phylogenetic trees were created with Treegraph 2.0.54 [114]
Fig. 4
Fig. 4
Maximum likelihood tree of arrestins. The tree was constructed from an amino acid alignment of deuterostome arrestins using PhyML (model JTT+I+G with α 1.04, 0.05% of invariable sites and 200 bootstraps). The different monophyletic and well-supported orthology groups are highlighted in different colors. Bootstrap support values from 50...100% are shown for the labeled monophyletic groups. The phylogenetic tree was visualized with Dendroscope 3.5.7 [115]
Fig. 5
Fig. 5
Specificity determining positions discriminating between sea urchin ARR0.1 and ARR0s including ARR0.2 from sea urchins. Amino acid frequency logos are shown for ARR0 and ARR0.1 of sea urchins ordered by functionality of motifs known from studies in vertebrate arrestins (ad). Positions that are known to directly confer the respective functionality are marked by arrows. Some mutations change the charge of the respective residue (marked with *). Positions identified by SDP analysis are highlighted by black boxes. As receptor specificity is mediated by a rather big interface, only the SDPs are shown that are known to be involved in receptor binding and their direct neighbors. An additional position that shows differences in both groups (manually identified) and is associated with the respective function is highlighted by a dotted box. The numbering of the positions refers to bovine ARRB1. See the following references: [2] (pos. 14), [32] (pos. 67, 78, 80, 82 in finger loop region), [17] (pos. 154, 233), [19] (pos. 242), [23] (pos. 245, 247, 248, 249) for receptor binding residues, [34] (pos. 157, 160, 161, 165, 232, 236, 250, 324, 326) for IP6 binding residues, [19] (pos. 165, 169) for phosphate sensing and [35] (pos. 385, 388, 391, 393, 395) for AP-2 binding residues. Results are also summarized in Additional file 6. The figure was created with Weblogo [116]
Fig. 6
Fig. 6
Duplication and deletion of arrestin paralogs within ray-finned fish. The teleost whole genome duplication (WGD) increases the number of arrestin paralogs within the two clades Otomorpha and Euteleosteomorpha. The two resulting copies of each paralog (SAG, ARRB1, ARRB2, ARR3) are depicted as a and b. Zebrafish ARR3b was annotated in GRCz10 as the gene was missing in the originally investigated genome version Zv9. The species tree was created based on [117] using Treegraph 2.0.54 [114]. Crosses depict gene losses. See caption of Fig. 3 for additional description of symbols
Fig. 7
Fig. 7
Specificity determining positions discriminating each pair of duplicated visual arrestins in teleosts. Amino acid frequency logos are shown for SAGa vs. SAGb (a, b) and for ARR3a vs. ARR3b (c, d) in teleosts. Positions that are known to directly confer a specific functionality in mammalian arrestins are marked by arrows. Of these, some mutations change the charge of the respective residue (marked with *). Positions identified by SDP analysis are highlighted by black boxes. As receptor specificity is mediated by a rather big interface, only the SDPs are shown that are known to be involved in receptor binding and their first and second order neighbors. Additional positions that show differences in both groups (manually identified) and might be associated with the respective function are highlighted with a dotted box. See [2] (pos. 10, 77, 81/76, 82, 319/313), [33] (pos. 195, 254/248), [23] (pos. 52, 54/49, 265), [17] (pos. 157, 273), [19] (pos. 90/85, 244, 267, 246/240, 261/255) for references of receptor binding residues, [19] (pos. 171/165, 175/169) for phosphate binding and [118] (pos. 163/157, 166/160, 167/161) for IP6 binding residues. The numbering refers to the position numbers in bovine SAG and ARR3, respectively. Results are also summarized in Additional file 6. The figure was created with Weblogo [116]. Ins - Insertion in comparison to reference
Fig. 8
Fig. 8
Duplication and deletion of arrestin paralogs in lobe-finned fish. ARRB2 could not be detected in the genomes and transcriptomes of birds (see Additional file 1: Table S1 for other 41 investigated bird species). Additional omics-data was investigated for sauropsids. The gene loss/duplication pattern was simplified for the monophyletic groups highlighted in light grey (see Additional file 1: Appendix 4). See caption of Fig. 3/6 for description of symbols. The exclamation mark (!) indicates the number of stop codons contained in the exon annotation, while plus (+) indicates that gene (parts) are encoded within the respective genome, but were not annotated in detail. Note that the order of the ARRB2.2 and ARRB1.2 losses is arbitrary. The phylogenetic tree was created using Treegraph 2.0.54 [114]. PG - pseudogene; PRG - pseudo-retrogene
Fig. 9
Fig. 9
Changes in conservation patterns and functional motifs of arrestins. Conservation of alignment positions of the individual orthology groups is shown. The conservation was calculated according to the Method of Karlin [110] using AACon [111] for each orthology group separately. Sequences with a coverage < 90% as well as all lamprey sequences were excluded. Functional motifs characterized in one or several paralogs were projected onto the individual alignments solely based on sequence homology. Putative loss (pentagon) and gain (circle) events based on conservation of the respective motifs were projected onto a simplified arrestin gene tree. The order of motif gain and loss on the respective branch was chosen arbitrarily. Positions were not marked if they did not conserve the amino acid known to be part of the motif in that orthology group in a majority of representatives. Some positions are marked although their conservation is restricted to a phylogenetic group as indicated by their lower conservation score (e.g. oligomerization is specific for Sarcopterygii SAG). The secondary structure based on the crystal structure of 1G4R (Fig. 1) is mapped onto the alignment of ARRB1. Note that only a selection of known motifs are shown
Fig. 10
Fig. 10
Evolutionary changes in exon-intron structure of arrestins. a - Exon-intron structure of the bovine ARRB1 gene. Exon and intron numbering is imposed onto arrestin homologs by sequence alignment. Positions of introns refer to their position on the amino acid sequence of cow arrestin-2 with a-c indicating their position after the first, second or third base of the codon, respectively. b - Exon-intron structure of arrestins (right hand side) is associated with a simplified gene tree (left hand side). Exons are shown as grey and colorful boxes, whereby homologous regions are “aligned” below each other. Colored exons highlight differences in exon-intron structure (intron gain, intron loss, exon loss). Changes in intron positions in comparison to the reference amino acid sequence of cow arrestin-2 are given whenever deviating except for the positions surrounding exons 13 and 15, which occasionally deviated by few nucleotides in our annotation (see Additional file 1: Appendix 7). Information about the corresponding exons was not available in the genomes if boxes are surrounded by a dotted line, but are assumed to be the same as in the 1:1 ortholog of the closest relative. If an unequivocal scenario of intron loss or gain is in accordance with the maximum parsimony principle, these events are indicated in the phylogenetic tree. Paralogs of species that share the exon-intron structure are summarized to phylogenetic clades, e.g. ARRB1 vertebrates. Structural differences in comparison to the family are shown right below associated with the corresponding species or phylogenetic clade. Losses of coding sequence (exons) are indicated by black pentagons with respective exons given as a number in the pentagon. The phylogenetic tree was created using Treegraph 2.0.54 [114]. c - Exon-intron structure of lamprey arrestins. Note that the length of the exon boxes is drawn to scale
Fig. 11
Fig. 11
Alignment of exon-intron borders after insertion of intron 85c into exon 5. Intron 85c is found in ARR0 of bat star (Pmi) and vase tunicate (Cin), but not in acorn worm (Sko) or lancelet (Bfl) (highlighted in grey). Exon 5 of one of the non-visual arrestins in lampreys (shown: Lca) as well as in ARRB2 in all Euteleosteomorpha (Gmo, Gac, Ola, Oni, Tru, Xma) is split into two parts, denoted as 5.1 and 5.2. In contrast, exon 5 of ARRB2 is not split in Otomorpha (Dre, Ame) and spotted gar (Lco) (grey). Only the 5’- and 3’-parts of the intron sequences are shown (green box), while the larger inner region is left out being non-informative (black lines). The proto-splice site motif ‘AGGY’ is conserved for all species genes shown except for Otomorpha (‘AAGC’). The alignment was visualized with Jalview 2.8.1 [93]

Similar articles

Cited by

References

    1. Gurevich VV, Gurevich EV. The structural basis of arrestin-mediated regulation of G-protein-coupled receptors. Pharmacol Ther. 2006;110(3):465–502. doi: 10.1016/j.pharmthera.2005.09.008. - DOI - PMC - PubMed
    1. Kang Y, Zhou XE, Gao X, He Y, Liu W, Ishchenko A, Barty A, White TA, Yefanov O, Han GW, Xu Q, Waal PWd, Ke J, Tan MHE, Zhang C, Moeller A, West GM, Pascal BD, van Eps N, Caro LN, Vishnivetskiy SA, Lee RJ, Suino-Powell KM, Gu X, Pal K, Ma J, Zhi X, Boutet S, Williams GJ, Messerschmidt M, Gati C, Zatsepin NA, Wang D, James D, Basu S, Roy-Chowdhury S, Conrad CE, Coe J, Liu H, Lisova S, Kupitz C, Grotjohann I, Fromme R, Jiang Y, Tan M, Yang H, Li J, Wang M, Zheng Z, Li D, Howe N, Zhao Y, Standfuss J, Diederichs K, Dong Y, Potter CS, Carragher B, Caffrey M, Jiang H, Chapman HN, Spence JCH, Fromme P, Weierstall U, Ernst OP, Katritch V, Gurevich VV, Griffin PR, Hubbell WL, Stevens RC, Cherezov V, Melcher K, Xu HE. Crystal structure of rhodopsin bound to arrestin by femtosecond X-ray laser. Nature. 2015;523(7562):561–7. doi: 10.1038/nature14656. - DOI - PMC - PubMed
    1. Renninger SL, Gesemann M, Neuhauss StephanCF. Cone arrestin confers cone vision of high temporal resolution in zebrafish larvae. Eur J NeuroSci. 2011;33(4):658–67. doi: 10.1111/j.1460-9568.2010.07574.x. - DOI - PubMed
    1. Gurevich VV, Hanson SM, Song X, Vishnivetskiy SA, Gurevich EV. The functional cycle of visual arrestins in photoreceptor cells. Prog Retin Eye Res. 2011;30(6):405–30. doi: 10.1016/j.preteyeres.2011.07.002. - DOI - PMC - PubMed
    1. Luttrell LM. Molecular Biology of Arrestins. Progress in molecular biology and translational science, vol. v. 118. Oxford: Elsevier Science & Technology; 2013. - PubMed

LinkOut - more resources