. 2017 Jul 7;5(1):71.
doi: 10.1186/s40168-017-0286-2.

Longitudinal profiling reveals a persistent intestinal dysbiosis triggered by conventional anti-tuberculosis therapy

Affiliations

Longitudinal profiling reveals a persistent intestinal dysbiosis triggered by conventional anti-tuberculosis therapy

Sivaranjani Namasivayam et al. Microbiome. .

Abstract

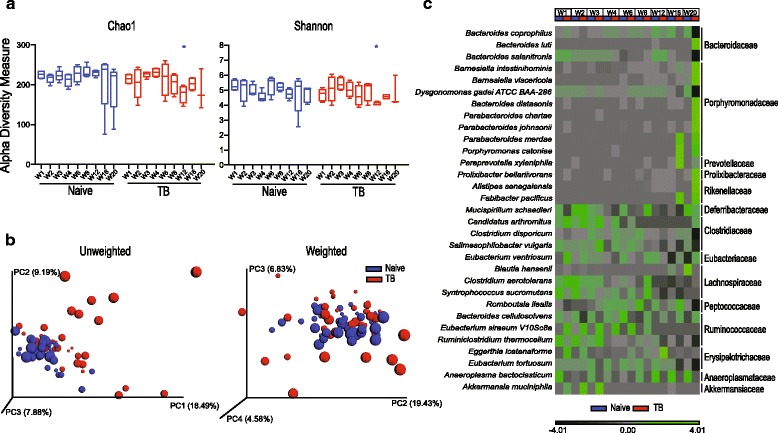
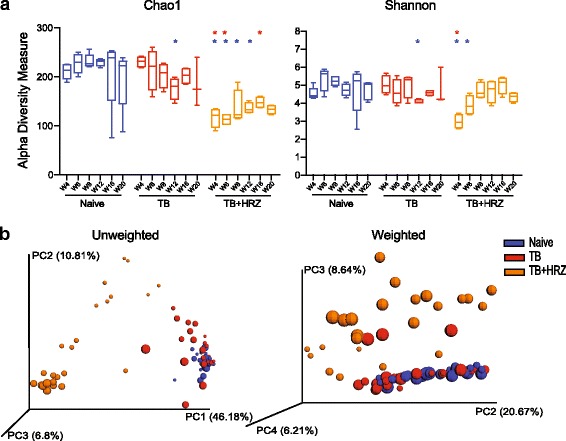
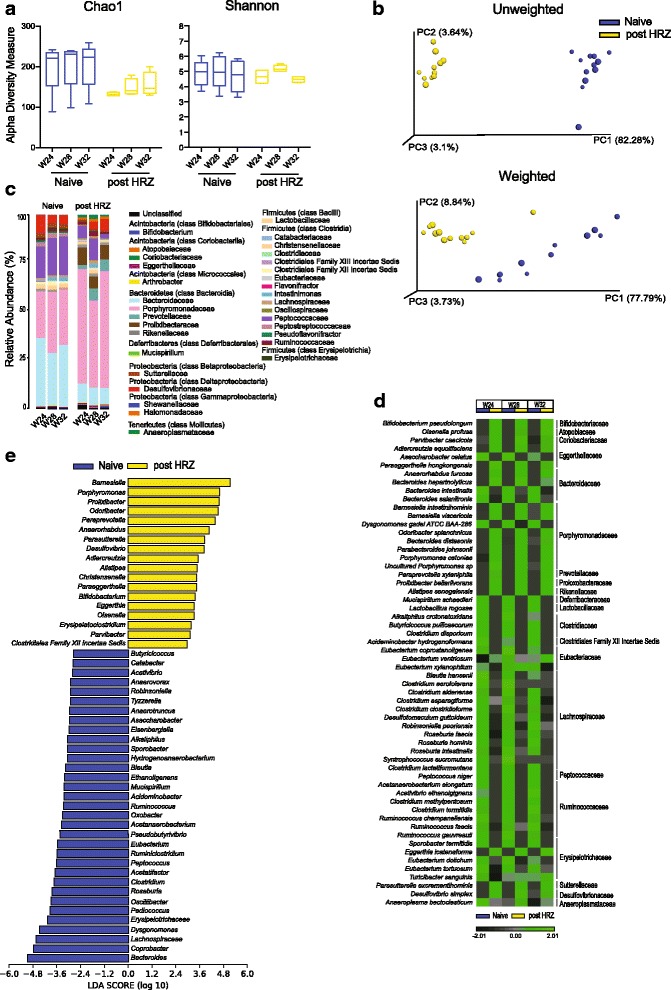
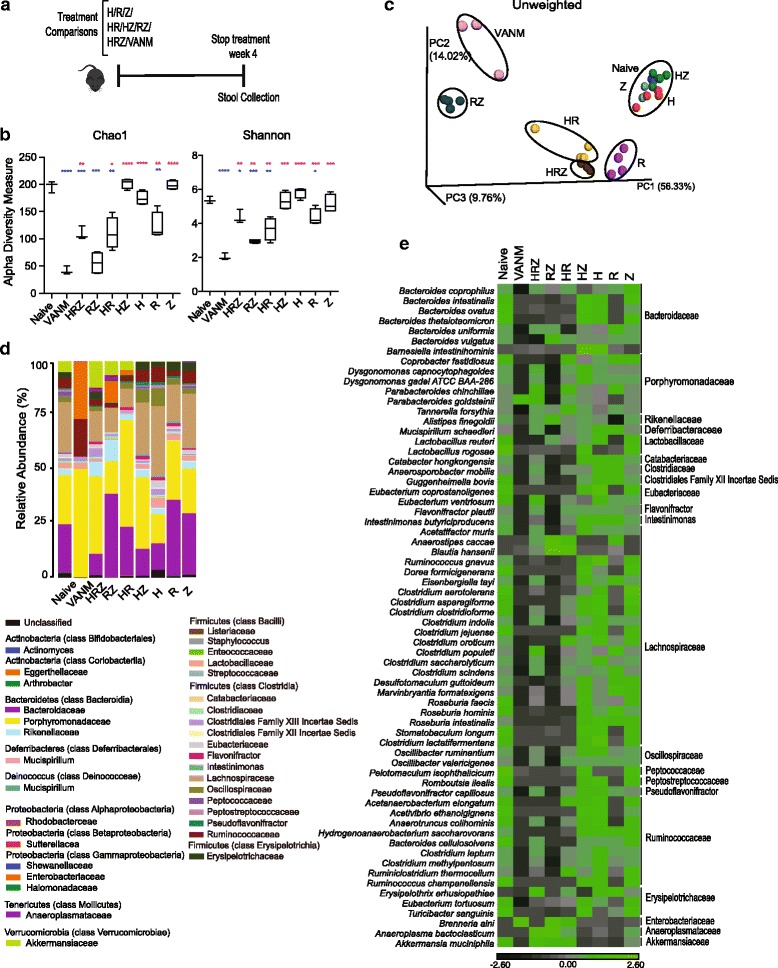
Background: Effective treatment of Mycobacterium tuberculosis (Mtb) infection requires at least 6 months of daily therapy with multiple orally administered antibiotics. Although this drug regimen is administered annually to millions worldwide, the impact of such intensive antimicrobial treatment on the host microbiome has never been formally investigated. Here, we characterized the longitudinal outcome of conventional isoniazid-rifampin-pyrazinamide (HRZ) TB drug administration on the diversity and composition of the intestinal microbiota in Mtb-infected mice by means of 16S rRNA sequencing. We also investigated the effects of each of the individual antibiotics alone and in different combinations.

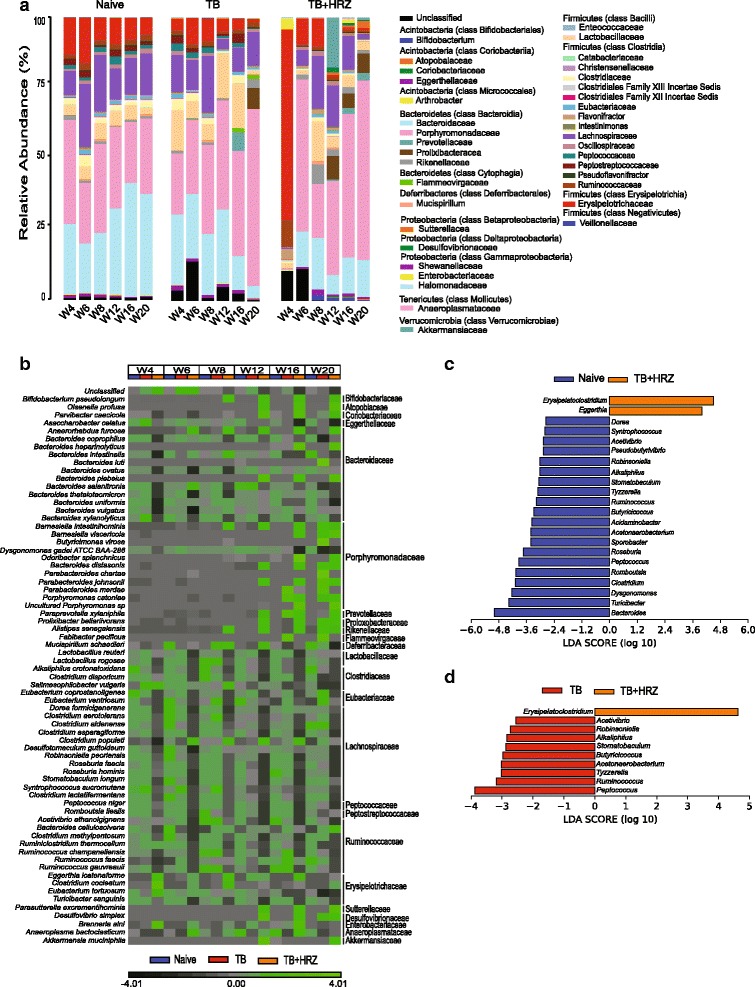
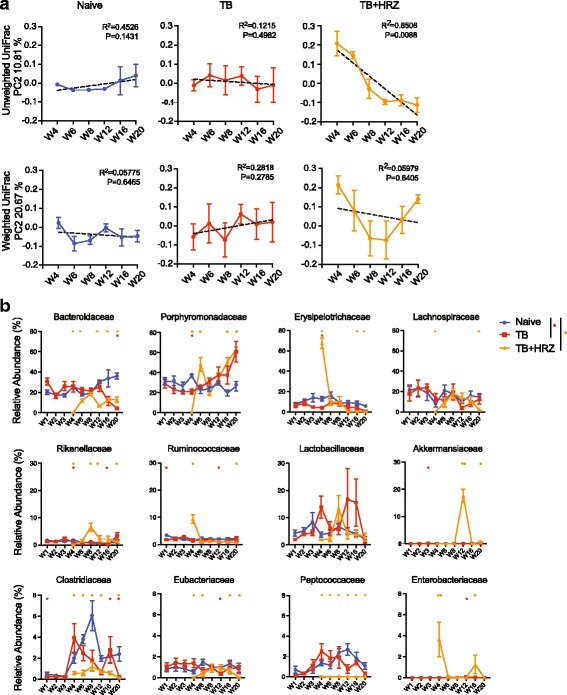
Results: While inducing only a transient decrease in microbial diversity, HRZ treatment triggered a marked, immediate and reproducible alteration in community structure that persisted for the entire course of therapy and for at least 3 months following its cessation. Members of order Clostridiales were among the taxa that decreased in relative frequencies during treatment and family Porphyromonadaceae significantly increased post treatment. Experiments comparing monotherapy and different combination therapies identified rifampin as the major driver of the observed alterations induced by the HRZ cocktail but also revealed unexpected effects of isoniazid and pyrazinamide in certain drug pairings.

Conclusions: This report provides the first detailed analysis of the longitudinal changes in the intestinal microbiota due to anti-tuberculosis therapy. Importantly, many of the affected taxa have been previously shown in other systems to be associated with modifications in immunologic function. Together, our findings reveal that the antibiotics used in conventional TB treatment induce a distinct and long lasting dysbiosis. In addition, they establish a murine model for studying the potential impact of this dysbiosis on host resistance and physiology.

Keywords: 16S rRNA; Antibiotics; Dysbiosis; Microbiota; Tuberculosis.


Figures

Fig. 1
Fig. 1
Mtb infection causes minimal alterations in the diversity and composition of the intestinal microbiota. a Alpha diversity estimates calculated from the sequenced data using Chao1 (left panel) and Shannon (right panel) indices for each time point (W1–W20) of stool sample collection in the naïve and TB group. Fecal collection time points are shown along the x-axis. Error bars indicate minimum and maximum values. Statistical significance was calculated between the corresponding time points of the two groups. *p < 0.05 (Wilcoxon rank-sum test). b Principal coordinate (PC) analysis of unweighted (left) and weighted (right) UniFrac distances of the microbial sequence data in the two animal groups. Each sphere represents a single animal with the size of the sphere referring to the sample collection time point (early to late time points indicated as a gradient in the size of the spheres from small to large). One sample each from W16 and W20 time points of the naïve group was not included in the analysis since these two samples formed an independent cluster highly separated from and inconsistent with the other clusters (For comparison, these samples are included, nevertheless, in Additional file 13: Figure S13). c Heat map comparing average abundances of species level classification of the 16S sequences from the naïve and TB animal groups. Data are clustered according to sample collection time point and animal group along the x-axis. The species indicated on the y-axis are grouped according to family level classification as noted on the right of the map and were filtered for those with an overall relative variance >3 (see “Methods”). n = 4–5 except TB group W20 time point where n = 3
Fig. 2
Fig. 2
ATT changes the intestinal bacterial community structure. a Community diversity in the naïve, TB, and TB + HRZ animal groups calculated from 16S sequences (W4–W20) using Chao1 (left) and Shannon (right) indices. Fecal collection time points are shown along the x-axis. Error bars indicate minimum and maximum values. Significance tests were performed between the corresponding time points in the naive and each experimental group (TB or TB + HRZ) and in a separate comparison between the TB and the TB + HRZ groups. Significant differences with respect to naive or TB are marked with a blue or red asterisks. *p < 0.05 (Wilcoxon rank-sum test). b Principal coordinate (PC) analysis of unweighted (top) and weighted (bottom) UniFrac distances of the sequences from the three groups. Sizes of spheres depict the time of sample collection as described in Fig. 1b. One sample each from W16 and W20 time points of the naïve group was not included in the analysis since these two samples formed an independent cluster separated from and inconsistent with the other clusters (For comparison, these samples are included, nevertheless, in Additional file 13: Figure S13)
Fig. 3
Fig. 3
ATT causes a rapid and persistent alteration in the composition of the intestinal microbiota. a Average relative abundance of bacterial families in each group and experimental time point identified from the sequenced data of the stool samples. Time points are indicated along the x-axis and arranged by the experimental groups. The bacterial families are grouped under their respective phylum and class in the color key. b Heat map showing the average species level abundance. Data are filtered for overall relative variance >5 and clustered as described in Fig. 1c. c, d LEfSe analyses depicting genera that are differentially abundant between the naïve and TB + HRZ groups (c) and TB and TB + HRZ groups (d). Analyses were performed on data from W4 to W20 time points (see “Methods”). Taxa significantly enriched in naïve, TB, and TB + HRZ groups are shown with blue, red, and orange bars, respectively. Data are filtered for p < 0.01 and linear discriminant analysis (LDA) score >2. n = 4–5 except TB group W20 time point where n = 3
Fig. 4
Fig. 4
ATT induces temporal changes in the community structure of the intestinal flora. a Principal coordinate (PC) values along the second ordinate of unweighted (top) and weighted (bottom) UniFrac analyses shown in Fig. 2b for each sample of the three animals groups are plotted. The x-axes indicate the sample collection time points and the y-axes indicate the PC values. The dotted lines represent the linear regression analysis trends. Error bars indicate mean ± SEM. b Relative abundances from W4 to W20 of select bacterial families for the three animal groups are plotted. *p < 0.05; **p < 0.01 (Wilcoxon rank-sum test). Error bars indicate mean ± SEM. n = 4–5 except TB group W20 time point where n = 3
Fig. 5
Fig. 5
The intestinal dysbiosis triggered by ATT is long-lasting and persists following cessation of treatment. a Community diversity in the naïve and post HRZ animal groups calculated from 16S sequences (W24–W32) using Chao1 (left) and Shannon (right) indices. Error bars indicate maximum and minimum values. b Principal coordinate (PC) analysis of unweighted (top) and weighted (bottom) UniFrac distances of the sequences from the two groups. Sizes of spheres depict the time of sample collection as described in Fig 1b. One sample each from W24, W28, and W32 time points of the naïve group was not included in the analysis since these three samples formed a separate independent cluster inconsistent with the other clusters. (For comparison, these samples are included, nevertheless, in Additional file 13: Figure S13). c Average relative abundance of bacterial families identified from the sequenced data of the naïve and post HRZ stool samples (W24–W32). The bacterial families are grouped under their respective phylum and class in the color key. d Heat map showing the average species level relative abundance. Data are filtered for overall relative variance >5 and clustered as described in Fig. 1c. e LEfSe comparisons showing the differentially abundant genera between the naïve and post HRZ groups (W24–W32). Taxa significantly enriched in naïve or post HRZ groups are depicted with blue or yellow bars, respectively. Data are filtered for p < 0.05 and LDA score >2. n = 4–5
Fig. 6
Fig. 6
Differential effects of the components in the HRZ cocktail on the intestinal microbiota. a Nine groups of mice with 3–4 animals in each group were employed. One group was left untreated as the naïve age-matched control. Seven of the groups were each treated with one or a combination of H (Isoniazid), R (Rifampin), and/or Z (Pyrazinamide) as indicated and separated by a ‘/’. The last group was treated with a cocktail of vancomycin, ampicillin, neomycin, and metronidazole (VANM). b Bacterial community diversity of all the samples in each group was estimated using alpha diversity indices Chao1 (left) and Shannon (right). Error bars indicate maximum and minimum values. *p < 0.05; **p < 0.01; ***p < 0.001; ****p < 0.0001, Welch’s t test. Blue and pink asterisks indicate significance in comparison to Naïve and VANM, respectively. c Principal coordinate (PC) analysis of unweighted UniFrac distances of sequences from all nine groups. d Average relative abundance of bacterial families in each group identified from the sequenced data. The bacterial families are grouped under their respective phylum and class in the color key. e Heat map showing the average species level abundance. Data shown are filtered for an overall relative variance >10 and depicted as described in Fig. 1c except along the x-axis which show the different treatment groups. Naïve, VANM, HRZ, n = 3; remaining groups n = 4

Similar articles

Cited by

References

    1. WHO . Global tuberculosis report. 2016. Geneva: WHO; 2016.
    1. Brennan PJ, Young DB. Isoniazid. Tuberculosis (Edinb). 2008;88(2):112–116. - PubMed
    1. Brennan PJ, Young DB. Pyrazinamide. Tuberculosis (Edinb). 2008;88(2):141–144. - PubMed
    1. Brennan PJ, Young DB. Rifampin. Tuberculosis (Edinb). 2008;88(2):151–154. - PubMed
    1. Brennan PJ, Young DB. Ethambutol. Tuberculosis (Edinb). 2008;88(2):102–105. - PubMed

Publication types

MeSH terms

LinkOut - more resources