. 2017 Jul 18;114(29):E5930-E5939.
doi: 10.1073/pnas.1705206114. Epub 2017 Jul 6.

BRAFV600 inhibition alters the microRNA cargo in the vesicular secretome of malignant melanoma cells

Affiliations

BRAFV600 inhibition alters the microRNA cargo in the vesicular secretome of malignant melanoma cells

Taral R Lunavat et al. Proc Natl Acad Sci U S A. .

Abstract

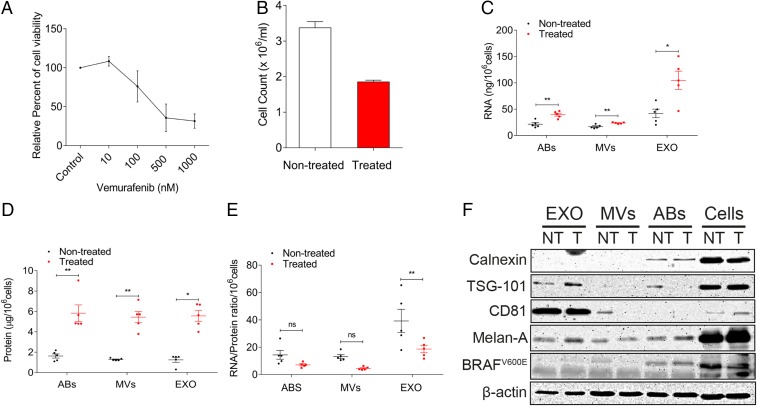
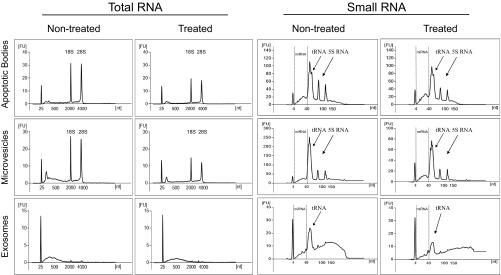
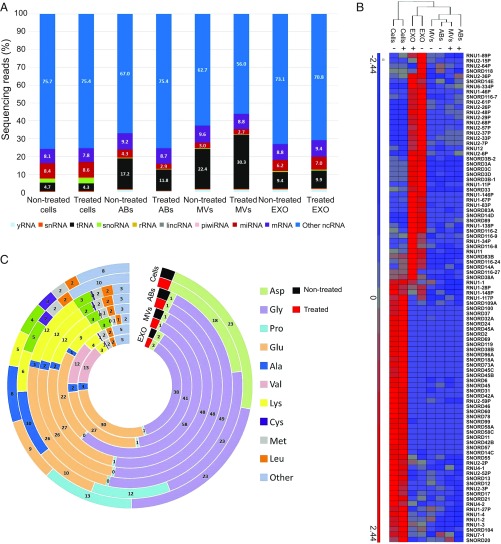
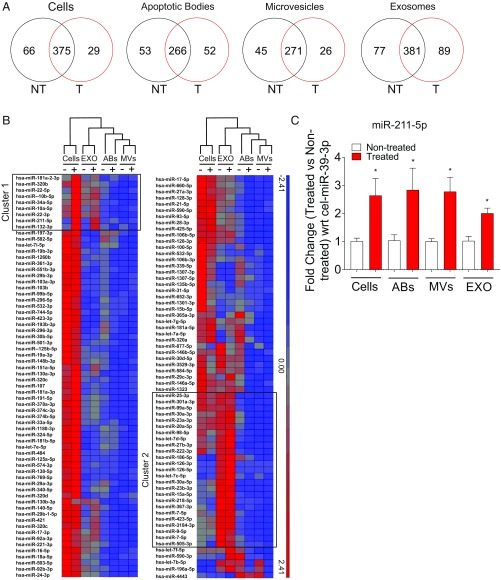
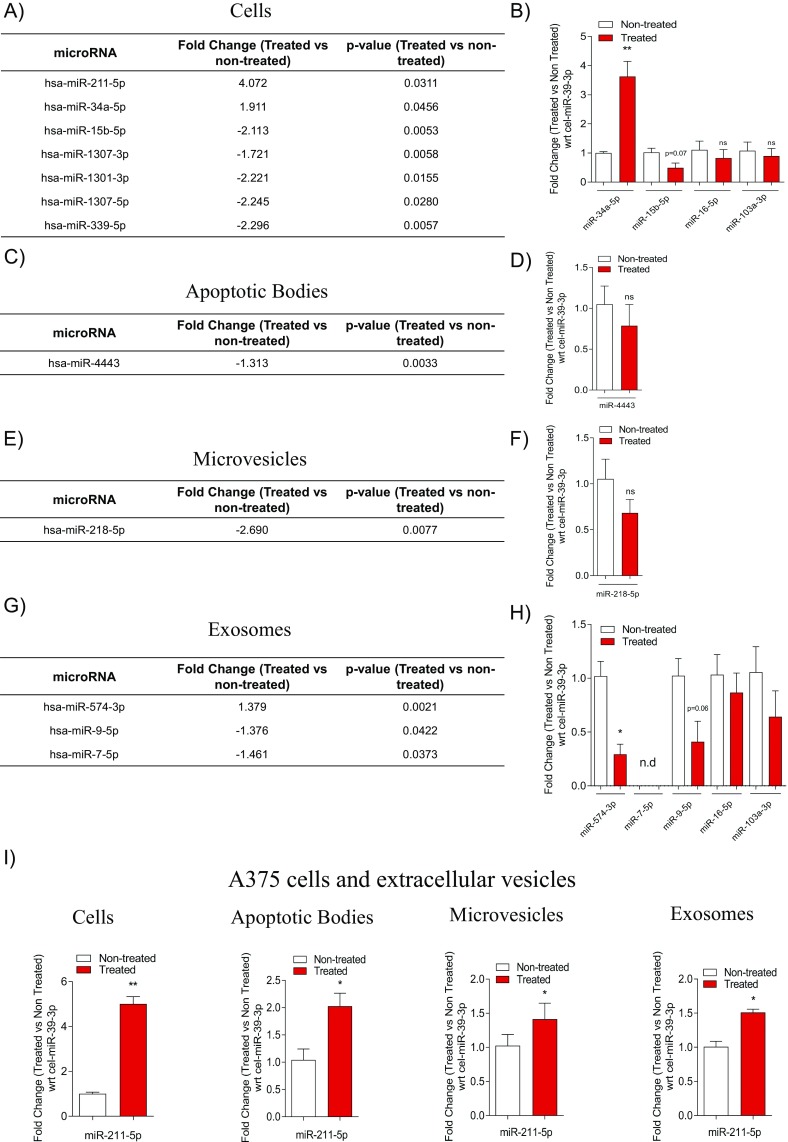
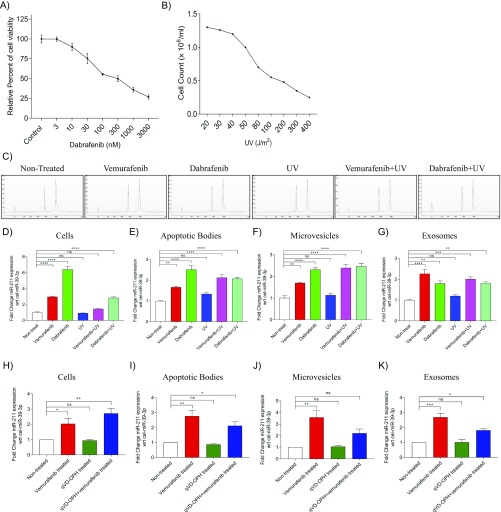
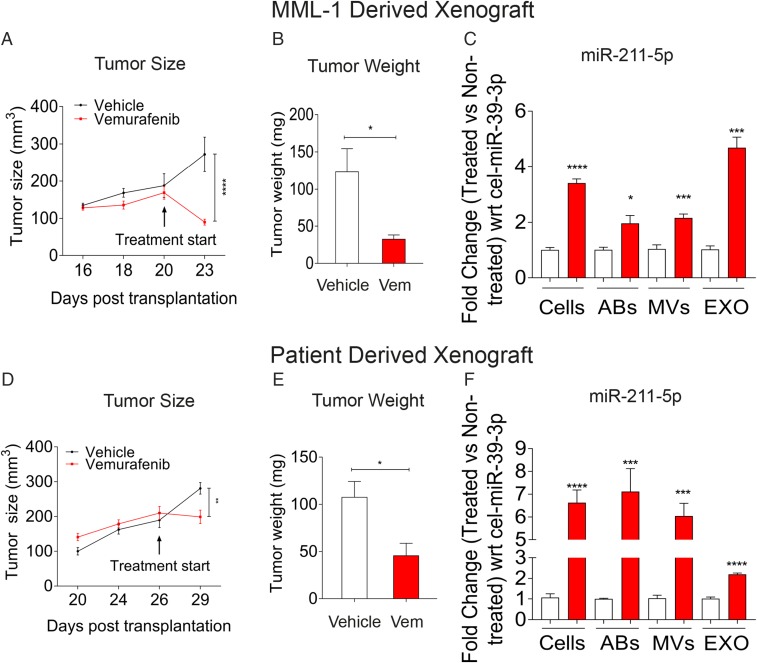
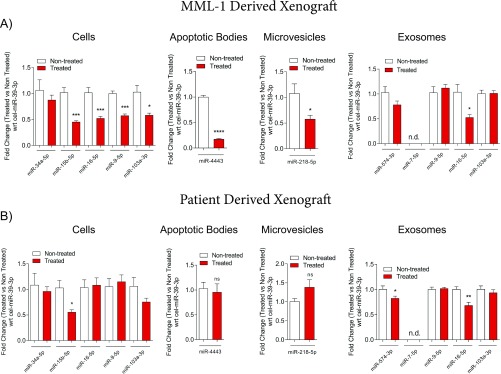
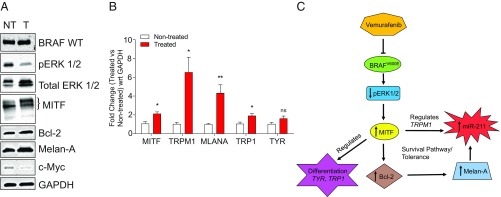
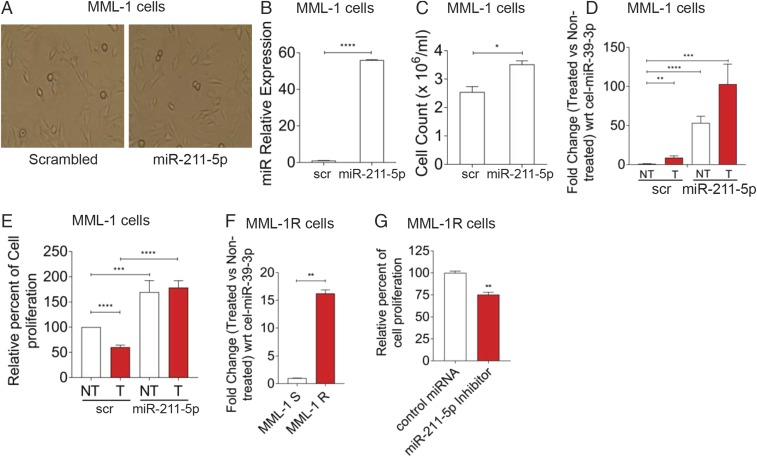
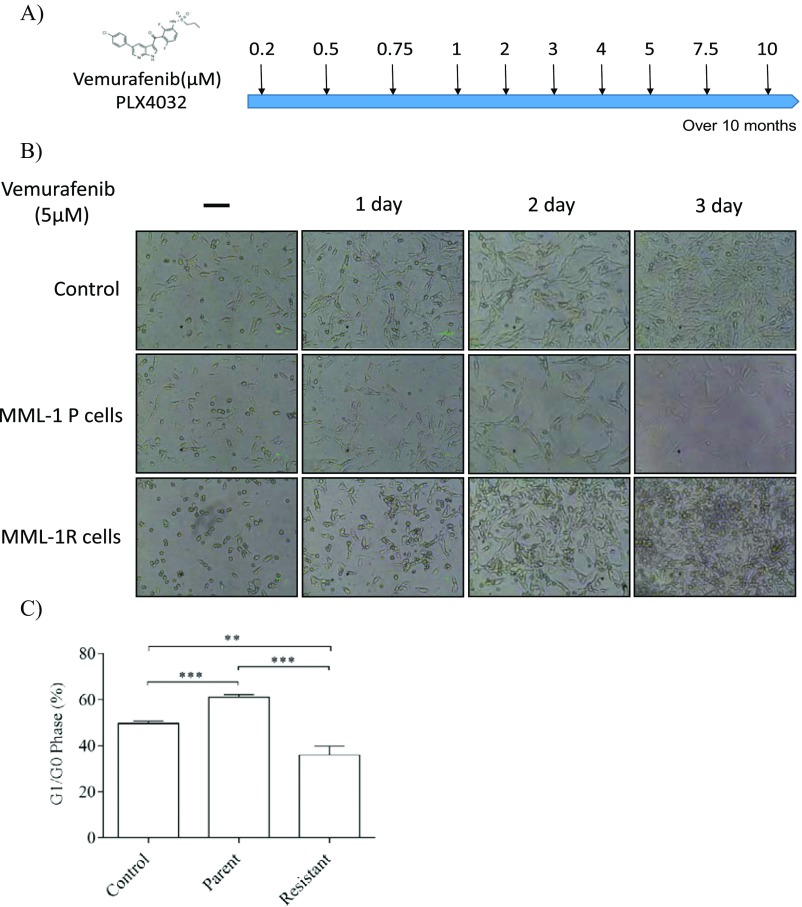
The BRAF inhibitors vemurafenib and dabrafenib can be used to treat patients with metastatic melanomas harboring BRAFV600 mutations. Initial antitumoral responses are often seen, but drug-resistant clones with reactivation of the MEK-ERK pathway soon appear. Recently, the secretome of tumor-derived extracellular vesicles (EVs) has been ascribed important functions in cancers. To elucidate the possible functions of EVs in BRAF-mutant melanoma, we determined the RNA content of the EVs, including apoptotic bodies, microvesicles, and exosomes, released from such cancer cells after vemurafenib treatment. We found that vemurafenib significantly increased the total RNA and protein content of the released EVs and caused significant changes in the RNA profiles. RNA sequencing and quantitative PCR show that cells and EVs from vemurafenib-treated cell cultures and tumor tissues harvested from cell-derived and patient-derived xenografts harbor unique miRNAs, especially increased expression of miR-211-5p. Mechanistically, the expression of miR-211-5p as a result of BRAF inhibition was induced by increased expression of MITF that regulates the TRPM1 gene resulting in activation of the survival pathway. In addition, transfection of miR-211 in melanoma cells reduced the sensitivity to vemurafenib treatment, whereas miR-211-5p inhibition in a vemurafenib resistant cell line affected the proliferation negatively. Taken together, our results show that vemurafenib treatment induces miR-211-5p up-regulation in melanoma cells both in vitro and in vivo, as well as in subsets of EVs, suggesting that EVs may provide a tool to understand malignant melanoma progression.

Keywords: cancer; extracellular vesicles; noncoding RNAs; small RNAs.


Conflict of interest statement

Conflict of interest statement: J.L. has written several patents in the field of extracellular vesicles as therapeutics and is currently an employee of Codiak BioSciences, in parallel with his position at the University of Gothenburg. R.O.B. has received honoraria from Roche for lectures.

Figures

Fig. 1.
Fig. 1.
Vemurafenib treatment increases the RNA and protein cargo in extracellular vesicle subsets. (A) Dose–response curve of vemurafenib treatment in MML-1 cells. The relative percent cell viability was assessed with an MTT assay. (B) Cell count of MML-1 cells after 200 nM vemurafenib treatment for 72 h. The cells were counted with a trypan blue exclusion assay. (C) RNA content in the subsets of EVs released by nontreated and treated cells, normalized per million cells (n = 5). (D) Protein content in the subsets of extracellular vesicles released from nontreated and treated cells, normalized per million cells (n = 5). (E) RNA/protein ratio in subsets of extracellular vesicles upon vemurafenib treatment (n = 5). (F) Western blot showing characteristics of extracellular vesicles using exosomal markers and melanoma markers. β-Actin was used as the loading control for cells. Data are presented as ± SEM. ABs, apoptotic bodies; EXO, exosomes; and MVs, microvesicles. *P < 0.05, **P < 0.01.
Fig. S1.
Fig. S1.
Vemurafenib alters the RNA profiles in the subsets of extracellular vesicles. RNA profiles showing the total RNA and small RNA in extracellular vesicles from nontreated and treated cells (n = 5). The arrows show the presence of tRNA and 5S RNA in the small RNA profiles analyzed by Bioanalyzer. FU, fluorescence unit; nt, nucleotide.
Fig. 2.
Fig. 2.
Sequencing analysis of small ncRNAs in subsets of extracellular vesicles from nontreated and treated cells. (A) The data show the percentage and distribution of sequencing reads mapping to ncRNAs in cells and extracellular vesicles. (B) Hierarchical clustering of significant snoRNAs in cells and extracellular vesicles. (C) tRNA distribution of mapping to respective tRNA isoacceptors. The numbers indicate the percentage of tRNA in cells and extracellular vesicles. (Fig. 1 legend for repeated abbreviations.) +, treated; −, nontreated.
Fig. 3.
Fig. 3.
Vemurafenib alters the miRNA expression in subsets of extracellular vesicles. (A) Venn diagrams showing the average of reads of unique miRNAs in nontreated (NT) and treated (T) cells and extracellular vesicles using small RNA sequencing. (B) Hierarchical clustering of miRNA in cells and exosomes upon vemurafenib treatment. The clustering shows the differential regulation of miRNA: red, up-regulated and blue, down-regulated. (C) Validation of miR-211–5p by qPCR in cells and extracellular vesicles supported the results of the small RNA sequencing. The fold change in expression between treated and nontreated cells was normalized with respect to the C. elegans external spike-in miR-39–3p (n = 3). Data are presented as ± SEM. *P < 0.05. (Figs. 1 and 2 legends for repeated abbreviations.)
Fig. S2.
Fig. S2.
BRAF inhibition alters miRNA expression in extracellular vesicle subsets. (A, C, E, and G) Tables showing the significant fold change in miRNA expression from sequencing analysis in cells and extracellular vesicles. The fold change is used as a measure of the up-regulation and down-regulation of miRNA in cells and extracellular vesicles. (B, D, F, and H) Validation of miRNA confirmed by sequencing in cells, apoptotic bodies, microvesicles, and exosomes showing the differentially expressed miRNAs normalized with respect to the C. elegans external spike-in miR-39–3p (n = 3). (I) Fold change in the expression of miR-211–5p in A375 cells and extracellular vesicles normalized to the C. elegans external spike-in miR-39–3p (n = 3). Ns, nonsignificant; wrt, with respect to. Data are presented as the ± SEM. *P < 0.05, **P < 0.01.
Fig. S3.
Fig. S3.
miR-211–5p expression is solely dependent on BRAF inhibition and not on cellular cytotoxicity. (A) Dose–response curve for dabrafenib treatment in MML-1 cells. The relative percent of cell viability was assessed with an MTT assay. (B) Cell count analysis of MML-1 cells treated with different units of UV exposure (J/m2). (C) Total RNA profiles of cells after different treatment conditions using Nano Chip and Bioanalyzer. All cellular profiles showed RIN values of 10 with no degradation of rRNA. (DG) Fold change of miR-211–5p in cells and extracellular vesicles after vemurafenib (200 nM), dabrafenib (100 nM), UV (80 J/m2), and cotreatments normalized to the external spike-in, C. elegans miR-39–3p (n = 3). (HK) Fold change of miR-211–5p in cells and extracellular vesicles after vemurafenib (200 nM), qVD-OPH (pan-caspase inhibitor), and cotreatments normalized to the external spike-in C. elegans miR-39–3p (n = 3). Ns, nonsignificant; wrt, with respect to. Data are presented as ± SEM. *P < 0.05, **P < 0.01, ***P < 0.001, ****P < 0.0001.
Fig. 4.
Fig. 4.
BRAF inhibition up-regulates miR-211–5p expression in MML-1 CDXs and PDXs. MML-1 cells (with the BRAFV600E mutation) and patient cells (with the BRAFV600K mutation) were transplanted s.c. into the mice, and tumors were allowed to grow until they attained a size of 150–200 mm3. The mice were then divided into vehicle and treatment groups, and the tumors were harvested at 3 d posttreatment. (A and D) Tumor size as measured with calipers. The treatment was initialized with PBS and vemurafenib in the food when the tumor size reached 150–200 mm3. (B and E) Weight of tumors harvested and measured 3 d after the treatment. (C and F) Validation of miR-211–5p in cells and extracellular vesicles derived from tumors. The fold change between the nontreated and treated cells and extracellular vesicles was normalized with respect to C. elegans external spike-in miR-39–3p (n = 5 in each group). Data are presented as ± SEM. *P < 0.05, **P < 0.01, ***P < 0.001, ****P < 0.0001. (Figs. 1 and 2 legends for repeated abbreviations.) Vem, vemurafenib.
Fig. S4.
Fig. S4.
BRAF inhibition alters miRNA expression in cells and extracellular vesicles derived from xenografts. (A and B) Validation of miR-15b–5p, miR-34a–5p, miR-9–5p, miR-16–5p, and miR-103a–3p in cells from MML-1 cell-derived and patient-derived xenografts and miR-4443 in apoptotic bodies, miR-218–5p in microvesicles, and miR-574–3p, miR-7–5p, miR-9–5p, miR-16–5p, and miR-103a–3p in exosomes derived from both MML-1 cell-derived and patient-derived xenografts. The fold change in relative miRNA expression is shown with respect to the C. elegans external spike-in miR-39–3p in apoptotic bodies and microvesicles isolated from MML-1 cells and patient-derived xenografts (n = 5 in each group). Data are presented as ± SEM. *P < 0.05, **P < 0.01, ***P < 0.001, ****P < 0.0001.
Fig. 5.
Fig. 5.
BRAF inhibition up-regulates miR-211–5p expression by regulating the survival pathways. (A) Immunoblotting of genes involved in survival pathways. The images are representative of three individual experiments. GAPDH was used as the loading control for the cells. (B) Fold change expression of differentiation genes as well as TRPM1 and MITF genes upon vemurafenib treatment as measured by qPCR. GAPDH was used as the internal control (n = 3). (C) Flowchart showing the up-regulation of miR-211–5p upon vemurafenib treatment. Data are presented as ± SEM. *P < 0.05, **P < 0.01. NT, nontreated; ns, nonsignificant; T, treated; wrt, with respect to.
Fig. 6.
Fig. 6.
Stable expression of miR-211–5p reduces sensitivity to vemurafenib. (A) Representative images of the MML-1 cells transfected with scrambled (scr) or miR-211 vectors. (B) The relative expression of miR-211–5p in MML-1 cells transfected with the miR-211–expressing lentiviral vector compared with MML-1 cells transfected with the scrambled gene-expressing vector. C. Elegans miR-39–3p was used as the external spike-in control to normalize the expression. (C) Cell counting shows that miR-211–5p–transfected cells proliferate more than the cells transfected with the scrambled gene. Cells were counted with the trypan blue exclusion assay. (D) Fold change in miR-211–5p expression with respect to C. elegans miR-39–3p between the scrambled and miR-211–transfected cells upon vemurafenib treatment. (E) Relative percent cell proliferation measured by MTT assay. The MTT assay was performed after 72 h of vemurafenib treatment. (F) Fold change regulation of miR-211–5p in MML-1R cells compared with the sensitive parental MML-1 cells. The fold change was normalized to the external spiked-in C. elegans miR-39–3p. (G) MML-1R cells were plated onto a 96 well plate at a density of 10,000 cells per well. Cells were transfected with control oligos or miR-211–5p inhibitors and the cellular proliferation was assessed by MTT after 24 h by using absorbance spectrum at 570 nm. All experiments were performed three times independently. Data are presented as ± SEM. *P < 0.05, **P < 0.01, ***P < 0.001, ****P < 0.0001. (Fig. 5 legend for repeated abbreviations.) MML-1R, MML-1 resistant cells; MML-1S, MML-1 sensitive cells.
Fig. S5.
Fig. S5.
Generation of MML-1 resistant cells. (A) Diagrammatic representation of the generation of MML-1 cells over the period of 10 mo by treating MML-1 cells with increasing doses of vemurafenib (0.2 µM–10 µM). (B) MML-1 parent cells and resistant cells (MML-1R) were treated with vemurafenib (5 µM) to observe the cellular growth at three different time points by microscopy (Scale bars, 10 μm.) (C) Flow cytometry analysis showing the cell cycle arrest at G1/G0 phase. MML-1P, MML-1 parent cells; MML-1R, MML-1 resistant cells. **P < 0.01, ***P < 0.001.

Similar articles

Cited by

References

    1. Davies H, et al. Mutations of the BRAF gene in human cancer. Nature. 2002;417:949–954. - PubMed
    1. Tsai J, et al. Discovery of a selective inhibitor of oncogenic B-Raf kinase with potent antimelanoma activity. Proc Natl Acad Sci USA. 2008;105:3041–3046. - PMC - PubMed
    1. Monsma DJ, et al. Melanoma patient derived xenografts acquire distinct Vemurafenib resistance mechanisms. Am J Cancer Res. 2015;5:1507–1518. - PMC - PubMed
    1. Kim VN. Small RNAs: Classification, biogenesis, and function. Mol Cells. 2005;19:1–15. - PubMed
    1. Lunavat TR, et al. Small RNA deep sequencing discriminates subsets of extracellular vesicles released by melanoma cells: Evidence of unique microRNA cargos. RNA Biol. 2015;12:810–823. - PMC - PubMed

Publication types

MeSH terms